
Abstract
Leukemia patients undergo chemotherapy to combat the leukemic cells (LCs) in the bone marrow. During therapy not only the LCs, but also the blood-producing hematopoietic stem and progenitor cells (HSPCs) may be destroyed. Chemotherapeutics targeting only the LCs are urgently needed to overcome this problem and minimize life-threatening side-effects. Predictive in vitro drug testing systems allowing simultaneous comparison of various experimental settings would enhance the efficiency of drug development. Here, we present a three-dimensional (3D) human leukemic bone marrow model perfused using a magnetic, parallelized culture system to ensure media exchange. Chemotherapeutic treatment of the acute myeloid leukemia cell line KG-1a in 3D magnetic hydrogels seeded with mesenchymal stem/stromal cells (MSCs) revealed a greater resistance of KG-1a compared to 2D culture. In 3D tricultures with HSPCs, MSCs and KG-1a, imitating leukemic bone marrow, HSPC proliferation decreased while KG-1a cells remained unaffected post treatment. Non-invasive metabolic profiling enabled continuous monitoring of the system. Our results highlight the importance of using biomimetic 3D platforms with proper media exchange and co-cultures for creating in vivo-like conditions to enable in vitro drug testing. This system is a step towards drug testing in biomimetic, parallelized in vitro approaches, facilitating the discovery of new anti-leukemic drugs.
Export citation and abstract BibTeX RIS

Original content from this work may be used under the terms of the Creative Commons Attribution 4.0 license. Any further distribution of this work must maintain attribution to the author(s) and the title of the work, journal citation and DOI.
1. Introduction
Patients with leukemia may have to undergo chemotherapy to destroy primarily the fast proliferating malignant leukemic cells (LCs) which are abnormal blood cells that arise from hematopoietic cells. Hematopoietic stem and progenitor cells (HSPCs) are responsible for life-long blood production in the red part of the bone marrow. They are the multipotent cells of the hematopoietic system, which have the ability to self-renew and to give rise to progeny that ensures oxygen supply, blood clotting or immunological reactions [1–3]. Chemotherapeutic drugs not only attack LCs but also destroy healthy HSPCs resulting in various side effects. The destruction of HSPCs can finally lead to failure of hematopoiesis [4, 5]. The subsequent decrease in white blood cells and bone marrow suppression, known as chemotherapy-induced myelosuppression, can increase the risk of infections [5, 6].
The bone marrow, hosting these cells, is composed of a network of various cell types including mesenchymal stem/stromal cells (MSCs), vascular structures and extracellular matrix (ECM). Together with soluble factors secreted by cells, a niche is formed that controls HSPC behavior including their maintenance and differentiation [7–9].
Mutations of HSPCs due to genetic defects caused by internal and external stress factors can lead to the formation of LCs. These cells are characterized by their ability to re-enter the quiescent cell state or increased proliferation as well as mechanisms leading to defective apoptosis and blood production [10]. In leukemia, LCs hijack the protective environment of the bone marrow by exploiting soluble or membrane-bound factors and transform it into a leukemic niche. The formed alternative niche impairs the normal function of HSPCs leading to a disturbed hematopoiesis. Furthermore, this leukemic environment supports the quiescence of LCs and thereby enhances the resistance of LCs to chemotherapeutics, which target actively dividing cells [11, 12].
Finding new therapeutic drugs that allow destroying LCs more effectively and reducing side effects, can increase the success of therapies and patient survival. To reach this goal, there is an urgent need to investigate the leukemic bone marrow in depth, its role in supporting the chemotherapeutic resistance of LCs and the effect of drugs on healthy hematopoietic cells. For this purpose, the development of in vitro models of the leukemic bone marrow allowing studies on the effects of chemotherapeutics on cell behavior in normal and malignant hematopoiesis is a promising strategy.
So far, the toxicity of drugs has mainly been investigated with the help of animal models. However, reducing animal experiments is requested in research these days and therefore in vitro three-dimensional (3D) systems are becoming more popular as an alternative platform for toxicity tests [13]. In 3D culture, the physiological morphology of cells and properties like sensitivity against drugs, the differentiation potential and the gene expression correlate more with the in vivo behavior than in conventional 2D culture methods [14, 15]. Such 3D systems can be used as tools for drug testing to assess their effectivity as well as potential toxic side effects. There are numerous systems described to culture hematopoietic cells in 3D, e.g. spheroids or macroporous hydrogels [16–24], some of which have been used for drug testing.
Despite the new insights revealed by such systems, technical shortcomings still limit the obtained information. A big disadvantage is that the nutrient exchange and removal of factors via diffusion are limited in static 3D culture systems. To overcome this limitation, movement can additionally be induced in these systems to gain a dynamic culture e.g. by rotation [25], stirring the medium, usage of vessel spinner flasks [26] or bioreactors, in which the 3D device is perfused with medium via a pump [18, 27]. However, those systems also have disadvantages. Stirring of the medium and rotation of the device in combination with 3D culture approaches provide no direct control over the movement and thus perfusion of applied 3D culture systems. Furthermore, systems such as spheroids or 3D scaffolds can collide with each other or the vessel wall, which can yield disturbance or even partial destruction of the construct. Previously, we presented a magnetic 3D system where 3D scaffolds, containing magnetic nanoparticles, can be brought under controlled movement in a magnetic field without stirring, rotation or the need of a pump leading to an increased nutrient exchange and thereby blood cell maturation [17]. However, this system, on which our current study is based, was limited by the lack of parallelization for simultaneous investigation of several (more than two) treatment conditions [17].
Monitoring strategies for close observation of the cell culturing process in order to ensure accurate cell growth and proliferation is another important parameter in the development of in vitro drug testing platforms. Depending on various factors like oxygen and substrate supply, the metabolic profile of cells changes in terms of glucose consumption as well as lactate and amino acid production [28]. For example, differentiating HSPCs consume significantly lower amounts of glucose and produce less lactate compared to proliferating HSPCs [28]. Rapidly dividing LCs have a high demand of energy due to their fast proliferation resulting in an altered glycolysis; even in the presence of oxygen, glucose is metabolized to pyruvate and further to lactate [29]. Adenosine production has also been discussed in the context of leukemia. It can result in enhanced homing, chemoresistance and altered drug responses of LCs, while polarizing the non-malignant immune cells towards tolerance which can finally lead to tumor growth [30, 31]. Given the different metabolic characteristics of healthy HSPCs and LCs, monitoring their metabolic profile is promising for investigating the effects of chemotherapeutics on cell behavior in in vitro drug testing systems.
To develop predictive in vitro drug testing devices, the improvement of existing systems by combining static and dynamic 3D culture systems with parallelization strategies as well as cell and metabolic analyses is needed. In the current study, we achieved this aim by developing a parallelized 3D culture approach allowing a controlled media exchange via a magnetic system. For this purpose, magnetic 3D scaffolds seeded with different types of cells (HSPCs, LCs and stromal cells) in co-culture, were developed to mimic the bone marrow in health and during leukemia.
The combination of endpoint analyses and online-monitoring allowed insights into the reaction of LCs and healthy hematopoietic cells to chemotherapeutics. Thus, the developed system is promising as an in vitro test platform for assessing efficacy and toxicity in drug development and also for personalized medicine.
2. Experimental section
2.1. Construction of the magnetic lift
The magnetic lift was constructed to bear a deep 12-well plate (Greiner Bio-One International GmbH, Frickenhausen, Germany) held by a movable stage (figure 1(A)). At the bottom of the magnet lift 12 disc magnets (Ø 25 mm, height: 15 mm; magnets4you GmbH, Lohr am Main, Germany) were positioned directly under the wells of the deep 12-well plate at its lowest point. Above the moveable stage 12 threaded rods with holders for another 12 disc magnets were installed. The threaded rods were fixed at a height very close to the 12-well plate at its highest moving point. The motor moved with a power supply and the movement of the stage was controlled with a control unit.
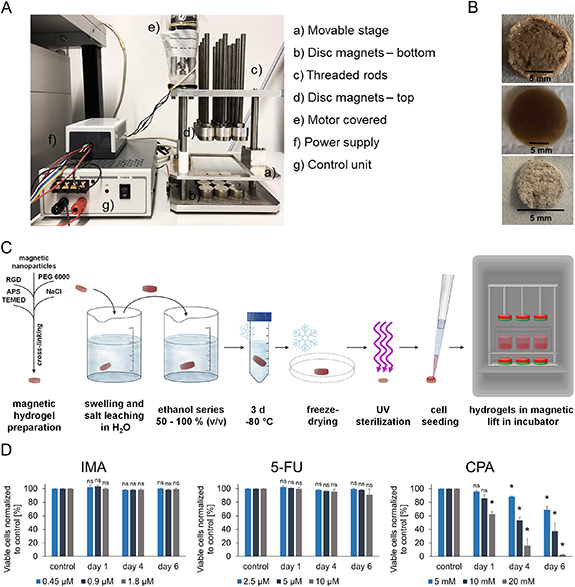
Figure 1. Development of a biomimetic 3D perfused culture system. (A) Setup of the magnetic lift inducing the movement into the system. (B) Magnetic hydrogel after production (top), after three days swelling (middle), after lyophilization (bottom); scale bar: 5 mm. (C) Scheme of gel preparation and experimental setup. (D) Viability of KG-1a cells in 2D culture after chemotherapeutic treatment in three different concentrations. Viable cells after IMA, 5-FU and CPA treatment were normalized to their controls [%]. The percentages of viable cells are depicted for day one, day four and day six. n = 3. Significant differences compared to the respective controls are given with an asterisk * for p ⩽ 0.05, while 'ns' indicates no significant changes (p > 0.05).
Download figure:
Standard image High-resolution image2.2. Functionalization of magnetic nanoparticles and production of magnetic 3D hydrogels
Magnetic nanoparticles (Chemagen, Baesweiler, Germany) were methacrylated and macroporous 3D magnetic hydrogels suitable to create artificial bone marrow analogs were produced as described previously [17] and as shown schematically in figure 1(C). Briefly, 60 mg methacrylated magnetic nanoparticles and 333 mg poly(ethylene glycol) diacrylate with a molecular weight of 6000 kDa (PEGDA 6000, kindly synthesized by the Soft Matter Synthesis Lab, Institute of Biological Interfaces, Karlsruhe Institute of Technology (KIT), Germany) were diluted in 1 ml saturated NaCl solution. The peptide RGD was added as 20 µM RGDSK-linker-acrylate (kindly provided by Dr Hubert Kalbacher, University of Tübingen, Germany) to complete the hydrogel precursor solution. As a porogen, 600 mg NaCl crystals (40–100 µm diameter) were mixed with 150 mg of the hydrogel precursor solution. The solution was cross-linked by adding 45 µl 10% (w/v) ammonium persulfate (APS; AppliChem, Darmstadt, Germany) and 8 µl N,N,N',N'-tetramethylethylenediamine (TEMED; Merck, Darmstadt, Germany). After 3 d of swelling and salt leaching in water, the gels were dehydrated using ethanol series (50%, 60%, 70%, 80%, 90%, 100% (v/v)), frozen in ethanol for 3 d at −80 °C and lyophilized for 24 h. Photographs of hydrogels after production, swelling and freeze drying are shown in figure 1(B).
2.3. Conductivity measurements
The exchange of soluble factors within the macropores of the 3D magnetic hydrogels with the surrounding fluid via diffusion was examined by conductivity measurements using NaCl as the diffusible agent. The exchange of ions in hydrogels using the magnetic lift (dynamic hydrogels) was compared to hydrogels placed in a well plate without movement (static hydrogels). Two hydrogels were soaked in 1 M NaCl solution for 1 h. One hydrogel was transferred to a deep 12-well plate containing 5 or 6 ml of ultrapure water and placed in the magnetic lift. The other hydrogel was placed in a non-moved deep 12-well plate containing the same amount of ultrapure water. The conductivity of the surrounding fluid was measured every three minutes with a conductometer LF 197S (WTW, Weilheim, Germany).
2.4. Isolation of HSPCs from umbilical cord blood
CD34+ HSPCs were isolated from umbilical cord blood provided by the DKMS Cord Blood Bank (Dresden, Germany) or from the Cord Blood Bank of the German Red Cross (Mannheim, Germany) with approval by the local ethics committee (Ethik-Kommission bei der Landesärztekammer Baden-Württemberg, B-F-2013-111) and informed consent of the parents. Isolation of HSPCs was performed as described previously [17].
2.5. Cell culture
HSPCs isolated from umbilical cord blood were cultured at a density of 2.5 × 10⁵ cells ml−1 for 24 h in Hematopoietic Progenitor Cell (HPC) Expansion Medium XF (PromoCell, Heidelberg, Germany) with 1% Cytokine Mix E (PromoCell) prior to each experiment. KG-1a cells (Deutsche Sammlung von Mikroorganismen und Zellkulturen GmbH, Braunschweig, Germany) were maintained in Rosewell Park Memorial Institute (RPMI)-1640 medium (Sigma-Aldrich®, Hamburg, Germany) with 20% (v/v) fetal bovine serum (FBS; Sigma-Aldrich®). RNA sequencing data of KG-1a cells is provided to confirm the leukemic nature of this AML cell line (supplementary figure 1 available online at stacks.iop.org/BF/14/035011/mmedia). MSCs isolated from human bone marrow were kindly provided by Prof. Dr. Karen Bieback (Institute of Transfusion Medicine and Immunology Mannheim, Faculty of Medicine, Heidelberg University; German Red Cross, Blood Donor Service Baden-Württemberg—Hessen, Mannheim, Germany). MSCs were cultured in Dulbecco's Modified Eagle's Medium (high glucose) (DMEM, Sigma-Aldrich®) with 5% (v/v) platelet lysate (PL, PL Bioscience, Aachen Germany) and 2 U ml−1 heparin (PL Bioscience). Only MSCs between passage two and six were used for experiments. KG-1a cells in co-culture with MSCs were cultured in DMEM with 5% (v/v) PL, 2 U ml−1 heparin, 100 U ml−1 penicillin and 100 µg ml−1 streptomycin. HSPCs in co-culture with MSCs as well as in triple co-culture with MSCs and KG-1a cells were cultured in HPC medium with 5% (v/v) PL, 2 U ml−1 heparin, 1% (v/v) Cytokine Mix E, 100 U ml−1 penicillin and 100 µg ml−1 streptomycin. Culture conditions for all cells were 37 °C and 5% CO2 in humid atmosphere.
2.6. In vitro proliferation staining for flow cytometry
To follow the proliferation in a double co-culture, HSPCs or KG-1a cells were stained with the CellTrace™ Violet (CTV) Cell Proliferation Kit (Thermo Fisher Scientific, Braunschweig, Germany) according to manufacturer's instructions using 5 µM CTV before seeding into 3D magnetic hydrogels for dynamic and 2D cell culture plates for static cultures. For the triple co-culture, HSPCs were stained with CTV and KG-1a cells using the CellTrace™ CFSE Cell Proliferation Kit (Themo Fisher Scientific). KG-1a cells were stained with 4 µM of CFSE equivalent to CTV staining. After culture, the stained cells were analyzed by flow cytometry (BD FACSverse, BD Biosciences, Heidelberg, Germany or MACSQuant® Analyzer 10 Flow Cytometer, Miltenyi Biotec, Bergisch Gladbach, Germany). Further description and exemplary histograms can be found in supplementary figure 2.
2.7. Preparation of chemotherapeutic drugs
The chemotherapeutics imatinib (IMA, Sigma-Aldrich®), 5-fluorouracil (5-FU, Merck) and cyclophosphamide (CPA, Thermo Fisher Scientific) were chosen for experiments based on their different mechanisms of action. Concentrations of 0.45 µM, 0.9 µM and 1.8 µM of IMA, 2.5 µM, 5 µM and 10 µM of 5-FU and 5 mM, 10 mM and 20 mM of CPA were used. Concentrations were chosen to match the previously investigated IC50 values of the compounds, along with their halved and doubled concentrations [18, 32, 33]. IMA and 5-FU were dissolved in DMSO and aliquots of 15 μl were stored at −20 °C. The stock solutions were prepared in a way that the desired concentrations could be used with a final concentration of maximum 0.1% (v/v) DMSO in the media. CPA was dissolved in HPC expansion medium and PBS in a ratio of 19:1. It was stored at 4 °C.
2.8. Response of KG-1a cells to different chemotherapeutics in static culture
The effectivity of chemotherapeutic treatment of LCs in different concentrations was tested using leukemic KG-1a cells. For this purpose, a 12-well plate (Greiner Bio-One International GmbH) was prepared with 2 ml cultivation medium per well. 2 × 10⁴ cells were resuspended in 50 μl cultivation medium and seeded into each well. After that, the chemotherapeutics and their respective controls were added at the desired concentrations. As control, the solvents of the chemotherapeutics were used in the same amounts as in the samples. After one, four and six days, the cells were analyzed with live/dead staining by flow cytometry and the supernatant was collected and stored at −80 °C for metabolic analysis.
2.9. Cell seeding in 3D magnetic hydrogels for static and dynamic 3D cultures and in cell culture plates for static 2D cultures
The 3D magnetic hydrogels, used in a dynamic 3D culture in the magnetic lift, were seeded with a double co-culture (HSPCs and MSCs or KG-1a cells and MSCs) or a triple co-culture (HSPCs, KG-1a cells and MSCs). For comparison, a static 3D culture containing the triple co-culture in magnetic hydrogels and 2D static cultures in standard tissue culture plates were used. When further referred to 2D culture, this static culture without movement and magnetic hydrogels is meant.
Before use, the lyophilized 3D magnetic hydrogels were sterilized under UV light for 20 min on each side. Into each hydrogel, a cell suspension of 100 µl containing 1.25 × 10⁵ HSPCs (CTV stained) and/or KG-1a (CFSE stained) cells along with 5 × 10⁵ MSCs was seeded [18]. After 10 min of incubation at room temperature, the soaked hydrogels were transferred into a deep 12-well plate and the wells were slowly filled with 6 ml of cultivation medium. For the static 2D culture, an optimal ratio of 1:4 HSPCs to MSCs was determined before using 0.5 × 10⁴ HSPCs ml−1 [16]. Here, a normal 12-well culture plate with a capacity of 2 ml volume was used. Hence, 1 × 10⁴ HSPCs and/or KG-1a cells and 4 × 10⁴ MSCs were seeded in 2 ml culture media.
The cells were treated with 0.9 µM IMA, 5 µM 5-FU or 10 mM CPA. The solvents of the chemotherapeutics were used as controls. For dynamic cultures, the deep 12-well plates with the cell-laden magnetic hydrogels in the wells were positioned on the stage of the magnetic lift, which was placed in a CO2 incubator, as performed previously by Rödling et al [17]. The static 2D and 3D cultures were carefully placed next to it. After one, two, five and six days, 500 μl of supernatant were taken from 3D cultures. Additionally, after six days 500 μl of supernatant was taken from the 2D cultures as well. The supernatant was centrifuged for 5 min at 300 × g to remove cell residues and stored at −80 °C until metabolic analyses. The cells were retrieved from the hydrogels as described previously by Rödling et al [34].
2.10. Immunostaining for flow cytometry
Depending on the availability, 2–10 × 104 HSPCs were washed with PBS + 0.1% (v/v) FBS and resuspended in 50 µl of PBS + 0.1% (v/v) FBS. The cells were stained with mouse anti-human CD34-PE (Thermo Fisher Scientific) and mouse IgG1-PE conjugate (Thermo Fisher Scientific) as isotype control as well as mouse anti-human CD45RA-APC (Miltenyi Biotec) and mouse IgG1-APC (isotype control; Miltenyi Biotec) following the manufacturers' instructions. Analysis was carried out using flow cytometry (BD FACSverse, BD Biosciences or MACSQuant® Analyzer 10 Flow Cytometer, Miltenyi Biotec).
2.11. Live-dead staining for flow cytometry
After experiments, in which a double co-culture of HSPCs or KG-1a cells together with MSCs was performed, the isolated cells were additionally stained with SytoxAADvanced™ (Thermo Fisher Scientific) and AnnexinV-FITC (BioLegend, San Diego, CA, USA) according to the instructions in order to determine dead and apoptotic cells. After staining, the cells were resuspended in 150 μl of Annexin buffer.
After performing triple co-culture experiments with HSPCs, KG-1a cells and MSCs, the isolated cells were only stained with SytoxAADvanced™ after the immunostaining. This was performed as described previously [17].
2.12. Glucose and lactate analysis
On three different days 500 µl of supernatant were taken with a syringe from the 3D cell cultures. In this way, the total volume of initially 6 ml was reduced during the growth period. The concentrations of glucose and lactate were measured using a Vi-cell Metaflex (Beckman Coulter, Krefeld, Germany) according to the manufacturer's instructions.
2.13. Adenosine and amino acid analysis
The cell culture supernatants were filled into concentrators with a molecular cut-off of 10 kDa (Pierce™ Protein Concentrators; Thermo Fisher Scientific) and centrifuged at 10 °C for 20 min at 15 000 × g. An equal volume of all three experiments was taken and interblended. The flow-through was used for analysis of the adenosine and amino acid concentrations via liquid chromatography–tandem mass spectrometry (LC-MS/MS). For the mass spectrometry measurements an API 4000™ quadrupole mass spectrometer with an electrospray ionization source was used (Applied Biosystems/MDS Sciex, Framingham, Massachusetts, USA).
In order to determine the adenosine concentration, the samples were diluted at a ratio of 1:10 in ultrapure water and separated by high-performance liquid chromatography (HPLC) (Agilent 1100, Waldbronn, Germany) using a column with 125 mm × 4 mm (LiChrospher® 100 RP C-18, 5 μm, Merck) and a gradient elution with 0.1% acetic acid (Sigma-Aldrich®) and acetonitrile (Sigma-Aldrich®).
For the determination of amino acid concentrations, the samples were diluted in a ratio of 1:100 or 1:1000 in ultrapure water. The samples were derivatized with butanol prior to determination of the concentrations. The separation was done by HPLC (Agilent 1100) using a column with 100 mm × 2.1 mm (Kinetex® 2.6 µm XB-C18 100 Å, Phenomenex, Aschaffenburg, Germany) and a gradient elution with ultrapure water with 0.1% (v/v) trifluoroacetic acid (TFA) and acetonitrile with 0.1% (v/v) TFA.
2.14. SEM imaging
After 6 d of culture, 3D cultures were fixed with 2.5% glutaraldehyde (Sigma-Aldrich®) for 10 min, followed by dehydration and freeze-drying as described above in section 2.2. Then, the samples were coated with a 5 nm 80% gold + 20% platinum layer (MED020Coating System BalTec, Balzers, Liechtenstein) and imaged with an scanning electron microscopy (SEM) (XL 30 FEG ESEM, Philips, Amsterdam, Netherlands) using an acceleration of 12 kV.
2.15. Data analysis and statistics
Determination of amino acids and adenosine was done once with a pool of three independent experiments (n = 1). All other experiments were performed in triple determination (n = 3). For the evaluation of these experiments, the mean value of the obtained data was calculated as well as the standard error. Statistical significances of the obtained data were estimated using a paired Student's t-test (data of sections 3.1, 3.2 and 3.5) with Excel (Microsoft, Dublin, Ireland) and marked with an asterisk * for a p-value ⩽ 0.05 or with 'ns' for a p-value > 0.05 (not significant). The data presented in sections 3.3 and 3.4 were separately analyzed for each chemotherapeutic with a two-factorial ANOVA using the Real Statistics Resource Pack software for Excel (Release 7.6, Copyright (2013–2021), Charles Zaiontz, www.real-statistics.com). Significant differences between the treated samples and their corresponding controls were calculated by a Tukey post hoc test following the ANOVA and marked with an asterisk * for a p-value ⩽ 0.05 or with 'ns' for a p-value > 0.05 (not significant). Additionally, we analyzed separately for each chemotherapeutic in a two-factorial ANOVA whether the effects of the drugs differed significantly between 2D and 3D. A significant interaction term then means that the difference between the chemotherapeutic and its corresponding control was significantly altered between 2D and 3D culture and was marked with a hash #.
To compare cell viability, proliferation and metabolite analyses (see table 1), the respective results were characterized with pluses to indicate an increase in comparison to the control and minuses to mark a decrease. A triple plus or minus (+++ or −−−) indicates a difference that is statistically significant and large, where large means >50% of the control value. When the change was >50% but not statistically different from the respective control or <50% and statistically significant, the result was characterized as double plus or minus (++ or −−). Non-significant differences with changes >30% of the control value are indicated with a single plus or minus. No change is indicated by a ' = '.
Table 1. Comparison of results of end point analyses for viable cell numbers and proliferation with results of monitoring glucose, lactate and adenosine concentrations during 3D culture.
| 3D double co-culture | ||||||||
|---|---|---|---|---|---|---|---|---|
| Cell type | Treatment | Viable cells | Proliferation | Glucose concentration | Lactate concentration | Adenosine concentration | ||
| HSPCs | IMA | = | = | ++ | − | = | ||
| 5FU | = | −−− | ++ | −−− | − | |||
| CPA | −−− | −−− | ++ | −−− | −− | |||
| KG-1a | IMA | = | = | −− | ++ | = | ||
| 5FU | = | − | = | = | = | |||
| CPA | −−− | = | ++ | −−− | −− | |||
| 3D triple co-culture | ||||||||
| Culture type | Treatment | Viable cells | Proliferation | Glucose concentration | Lactate concentration | Adenosine concentration | ||
| Static | 5FU | HSPCs | = | HSPCs | −−− | = | − | = |
| KG-1a | = | KG-1a | −− | |||||
| Dynamic | 5FU | HSPCs | = | HSPCs | −−− | = | − | −− |
| KG-1a | = | KG-1a | −− | |||||
+++/−−− indicates a significant large increase/decrease, ++/−− a moderate increase/decrease, +/− a small increase/decrease and = no change in comparison to the respective control.
3. Results
3.1. Development of a perfused biomimetic 3D drug testing system using a magnetic bioreactor
A parallelized, perfused culture system using a 3D in vitro bone marrow analog was established for simultaneous drug testing experiments. For this purpose, a contactless controlled movement of cell-laden magnetic 3D scaffolds in their growth media in multiwell plates was applied to ensure perfusion. A magnetic lift was constructed to enable the contactless movement of magnetic hydrogels by applied external magnetic fields. This magnetic lift carried a deep 12-well plate held by a movable stage (figure 1(A)). The top and the bottom of the movable stage were equipped with 12 disc magnets each, creating a magnetic field. This induced a continuous up and down movement of the magnetic hydrogels within the wells of the plate, when the stage with the plate was moved towards the upper or lower magnet panel (supplementary figure 3). The production of the magnetic hydrogel scaffolds, cell seeding and experimental setup as well as photographs of the magnetic scaffolds after production and lyophilization are shown in figures 1(B) and (C).
To characterize the effect of scaffold movement on the exchange of soluble factors of magnetic hydrogels with the surrounding liquid, the hydrogels were soaked with saturated NaCl solution and placed in the wells of a deep well plate filled with 5 or 6 ml water. The increasing conductivity resulting from the diffusion of NaCl from the hydrogels into the surrounding water was measured (supplementary figure 4). Movement of the hydrogels was induced via the magnetic lift in the dynamic setting, which was compared to the static setting using non-moved magnetic hydrogels in culture plates. In the dynamic setting, an accelerated exchange of Na+ and Cl− was observed.
3.2. Cell viability of KG-1a cells depends on chemotherapeutics and their concentrations
In order to develop a 3D model of the leukemic niche for drug testing, LC lines that are responsive to certain chemotherapeutics and resistant against others were required as cellular models. Therefore, the responsiveness of the acute myeloid leukemia (AML) cell lines KG-1a, OCI-AML3 and MOLM-13 to the chemotherapeutics imatinib (IMA), 5-fluorouracil (5-FU) and cyclophosphamide (CPA) in three different concentrations was tested in standard 2D cultures in initial experiments. These particular drugs were chosen because all three of them have different mechanisms of action. IMA is a known tyrosine kinase inhibitor [33, 35, 36], whereas 5-FU is recognized by DNA polymerases and gets incorporated into DNA [18, 37]. CPA alkylates DNA during cell proliferation and forms intra- and interstrand DNA cross-links in addition to DNA-protein cross-links resulting in the inhibition of DNA replication and apoptosis [38]. After one, four and six days, the cells were analyzed with live/dead staining by flow cytometry. CPA treatment of OCI-AML3 and MOLM-13 cells resulted in a reduction of viable cells, which was stronger with higher concentrations and increasing days of culture. The same effect was observed during 5-FU treatment of MOLM-13 cells (supplementary figure 5). KG-1a cells treated with IMA and 5-FU showed viabilities consistently comparable to the survival rates in the controls (figure 1(D)). CPA treatment led to a decrease of viable cells normalized to the control and this effect substantiated with increasing CPA concentrations and time.
All in all, the AML cell line KG-1a showed the highest resistance against chemotherapeutics, followed by the cell line OCI-AML3. Those cell lines were sensitive against all concentrations of CPA treatment whereas only MOLM-13 cells additionally were strongly affected by treatment with 5-FU. For the development of a 3D model of the leukemic niche, the cell line KG-1a was chosen as it fulfilled the criteria to be responsive to some chemotherapeutics (CPA) and resistant against others (IMA, 5FU) in 2D culture.
3.3. Cell survival, proliferation and differentiation of healthy and leukemic hematopoietic cells in double co-culture with MSCs depend on culture perfusion and chemotherapeutics
In order to analyze the effects of chemotherapeutic treatment on healthy HSPCs and LCs in a biomimetic environment, dynamic 3D double co-cultures containing HSPCs or LCs together with MSCs were carried out in the 3D perfused culture system. For this purpose, HSPCs or KG-1a cells were seeded with MSCs in magnetic hydrogels creating artificial healthy and leukemic niches respectively. The chemotherapeutics IMA (0.9 μM), 5-FU (5 μM) and CPA (10 mM) were applied to investigate the influence of the culture mode (static 2D/dynamic 3D) on the effectivity and toxicity of these drugs. Due to limited cell numbers from one donor and high donor-to-donor variability, we focused on the effects of the 3D dynamic system versus 2D static cultures.
The survival and proliferation of healthy HSPCs (figure 2(A)) and leukemic KG-1a cells (figure 2(B)) were analyzed after chemotherapeutic treatment. For this purpose, the cells were isolated from the magnetic hydrogels on day six and analyzed via flow cytometry for live/dead staining to assess survival (figures 2(A) and (B), left) and for CTV intensity (figures 2(A) and (B), right) to mirror the proliferation behavior of the cells. Under IMA treatment, no cytotoxic effects on HSPCs were observed, both in static 2D and in dynamic 3D conditions, in comparison to the untreated controls. Additionally, the proliferation behavior remained unaffected. 5-FU treatment yielded no significant differences in the percentage of viable cells but significantly affected the proliferation of HSPCs in both culture conditions. CPA treatment led to a decrease of HSPC survival in both static 2D and dynamic 3D culture compared to the control. Additionally, this effect was significantly stronger in 3D compared to 2D. Under the same conditions, the proliferation of HSPCs was lower in the static 2D and dynamic 3D cultures than in the corresponding controls as shown by the higher mean fluorescence intensities of the detected CTV signals.
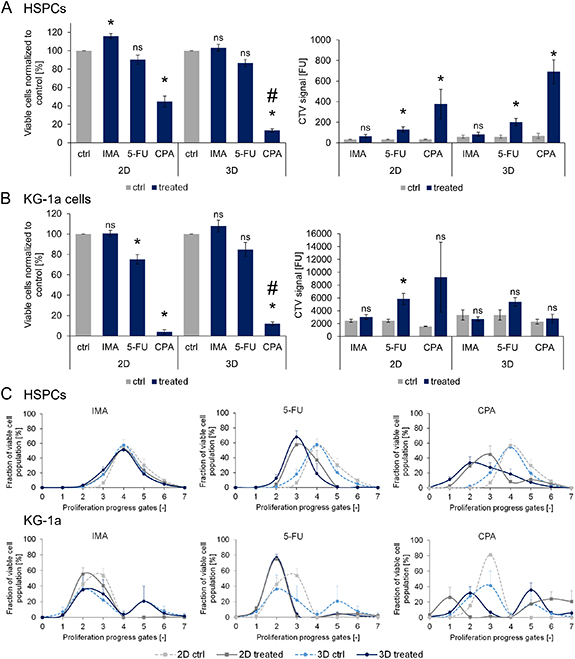
Figure 2. Viability and proliferation of HSPCs and KG-1a cells in static 2D and dynamic 3D co-culture after exposure to 0.9 µM IMA, 5 µM 5-FU and 10 mM CPA. Survival and proliferation of HSPCs (A) and KG-1a cells (B) in double co-culture with MSCs (static 2D or dynamic 3D) after chemotherapeutic treatment. The viable cells were normalized to their controls (%). The viable cells (%) and the CTV signals after six days of culture are depicted. n = 3. Significant differences compared to the control are given with an asterisk * for p ⩽ 0.05. Significant difference in the effects of a chemotherapeutic in 2D and 3D are marked with a hash #. 'ns' marks non-significant differences (p > 0.05). (C) The cell fractions of the viable HSPC and KG-1a cell populations (%) in the different proliferation progress gates after chemotherapeutic treatment compared to the controls are depicted. n = 3.
Download figure:
Standard image High-resolution imageTreatment of leukemic KG-1a cells with CPA revealed similar results as for HSPCs (figure 2(B)); a significantly lower percentage of viable cells compared to the control was detected under static 2D and dynamic 3D conditions. In comparison to 2D, a higher percentage of viable cells could be detected in 3D, indicating a significantly higher chemotherapeutic resistance of KG-1a cells in 3D. Similarly, 5-FU treatment led to a significantly reduced cell viability and proliferation in static 2D culture. Irrespective of whether KG-1a cells were cultured under static 2D or dynamic 3D conditions, IMA treatment was not toxic to the cells. In the 3D system, none of the chemotherapeutics had significant effects on the proliferation of KG-1a cells.
To investigate the impact of chemotherapeutic treatment on the cell proliferation, the distribution of viable cells progressing in proliferation was analyzed. For this purpose, the fraction of viable cells was plotted against proliferation progress gates (description in supplementary figure 2), which was determined by CTV distribution (figure 2(C)). Higher gate numbers indicate higher proliferation rates of cells detected within these gates. No changes were observed for HSPCs in either culture condition when they were treated with IMA, while 5-FU and CPA treatment resulted in less-proliferated cells in static 2D as well as in dynamic 3D culture compared to the controls.
In contrast to the HSPCs, two separate peaks representing distinct populations were visible in the CTV analyses of KG-1a cells under certain conditions. While the controls for the dynamic 3D cultures always yielded two peaks, the controls for the static 2D cultures showed a single less-proliferating population. In the static 2D culture under IMA treatment, the largest fraction of viable cells was found in a lower proliferation progress gate compared to the control. However, no changes were observed in the dynamic 3D condition. Treatment with 5-FU resulted in a single peak representing less-proliferated cells for both culture conditions. Interestingly, CPA treatment led to two distinct populations in the 2D culture, one with very less and the other with highly proliferated cells. Similar effects could be seen in the 3D condition where some cells had proliferated less while more cells were found in the higher proliferated population compared to the control.
SEM was performed to visualize the different cell types in the 3D environment and to discover potential effects of the chemotherapeutic treatments on cell morphology (supplementary figure 6). After six days of dynamic 3D double co-culture of HSPCs together with MSCs, IMA and 5-FU treatment changed the appearance of normally round cells with smooth surfaces (as visible in the controls) to a more longish form with rough surfaces and borders. After IMA treatment, the 3D environment created by the magnetic hydrogel and MSCs resulted in a less defined structure where cells and their environment were less distinguishable. In line with the findings of the live/dead staining after CPA treatment, more cell debris was visible in the surrounding of the MSCs and the hydrogel compared to the control, in which many healthy round cells could be observed.
In summary, CPA treatment showed the highest impact on cell behavior in 2D and 3D with lower cell survival and altered proliferation for both, HSPCs and KG-1a cells. Furthermore, chemotherapeutic treatment with 5-FU and CPA led to attenuated HSPC proliferation while for KG-1a cells effects were stronger in 2D than in 3D.
To investigate the impact of chemotherapeutic treatment on the differentiation of HSPCs and KG-1a cells, the expression of the surface markers CD34 and CD45RA was analyzed. After six days of double co-culture, HSPCs (figure 3(A)) and KG-1a cells (figure 3(B)) were isolated from the magnetic hydrogels and stained. Only 5-FU treatment of HSPCs in a dynamic 3D culture resulted in a lower percentage of differentiated CD34−/CD45RA− cells compared to the untreated control, although this change was not statistically significant. This was confirmed by the measurement of the percentage of less mature CD34+/CD45RA− cells. A higher percentage of these cells in comparison to the control was found after treatment with 5-FU in dynamic 3D culture.
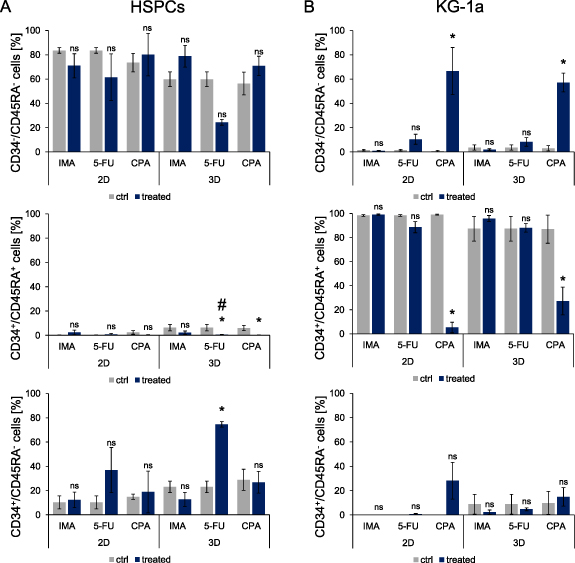
Figure 3. Cell surface marker expression analysis of CD34 and CD45RA on HSPCs (A) and KG-1a cells (B) in static 2D and dynamic 3D double co-culture with MSCs. The percentage of the expression of CD34 and CD45RA on HSPCs and KG-1a cells was analyzed after exposure to 0.9 µM IMA, 5 µM 5-FU and 10 mM CPA on day six. n = 3. Significant differences compared to the corresponding control are given with an asterisk * for p ⩽ 0.05 and a hash # indicates a significantly altered effect of a chemotherapeutic in 2D and 3D. Differences with p > 0.05 are considered as not significant and are marked with 'ns'.
Download figure:
Standard image High-resolution imageIn contrast to 2D, 5-FU and CPA treatment significantly reduced the number of CD34+/CD45RA+ HSPCs in 3D. Treatment of KG-1a cells with IMA and 5-FU had no influence on their differentiation state in comparison to the controls. However, for CPA-treated KG-1a cells, a loss of CD34 and CD45RA expression could be observed. Significantly less KG-1a cells were CD34+/CD45RA+ after culture with CPA in both culture conditions compared to the controls. These findings were confirmed by the CD34−/CD45RA− measurement. CPA treatment resulted in a higher percentage of CD34−/CD45RA− KG-1a cells in static 2D and dynamic 3D cultures than in the controls. Taken together, the differentiation of HSPCs was impaired by 5-FU treatment after culture in 3D dynamic conditions resulting in a higher percentage of less mature cells. CPA treatment promoted a change of differentiation marker expression in KG-1a cells cultured under static 2D and dynamic 3D conditions.
3.4. 5-FU treatment of a triple co-culture affects proliferation but not survival or differentiation of healthy and leukemic hematopoietic cells
During leukemia, LCs coexist with HSPCs and stromal cells in the bone marrow. To mimic this condition, a triple co-culture was established. HSPCs isolated from healthy donors, the AML cell line KG-1a and MSCs were co-cultured in the magnetic hydrogels. SEM revealed that HSPCs occurred as dense but clearly separated round cells within the magnetic hydrogels in both monoculture and double culture with MSCs. In contrast, KG-1a cells formed clusters consisting of a few round cells closely attached to each other (supplementary figure 7 upper panel). MSCs tightly attached to the hydrogel structure were spreading largely, thereby contributing to the matrix within the created artificial niche. These spreading MSCs were also found in the triple co-culture. HSPCs and KG-1a cells could not be distinguished although single roundish cells as well as clusters could be observed (supplementary figure 7 lower panel).
To challenge the triculture leukemic model with chemotherapeutics, 5-FU was chosen as a model drug, because of the observed toxicity on healthy cells and resistance of LCs in dynamic 3D culture. Therefore, 5-FU was well-suited to assess potential toxicity and effectivity by evaluating the sensitivity or resistance of healthy and diseased cells to this drug. Triple co-culture under dynamic 3D conditions was treated with 5-FU (5 µM) and compared to a static 3D culture with unmoved magnetic hydrogels and a traditional static 2D culture. In order to differentiate between HSPCs and KG-1a cells, the cells were stained before seeding with different proliferation tracing dyes (CTV for HSPCs and CFSE for KG-1a cells). In comparison to the controls, the percentage of viable cells after treatment with 5-FU was only reduced for KG-1a cells in the 2D culture. For all other culture conditions no significant differences could be detected (supplementary figure 8).
Regardless of the survival of HSPCs, 5-FU treatment significantly affected their proliferation (figure 4(A)). Higher CTV signals, indicating slower proliferation of HSPCs were recorded for all treated culture conditions in comparison to the controls. A similar trend was observed for KG-1a cells. Looking at the distribution of viable HSPC and KG-1a cells versus progressing proliferation (figure 4(B)), it can be observed that 5-FU treatment led to an increase in less-proliferated cells under all culture conditions compared to the respective controls. When assessing the differentiation of healthy and leukemic hematopoietic cells in triculture via the expression analyses of CD34 and CD45RA, no differences in percentages of early (CD34+/CD45RA−) or more differentiated (CD34+/CD45RA+ and CD34−/CD45RA−) hematopoietic cells could be detected in response to 5-FU treatment (figure 4(C)).
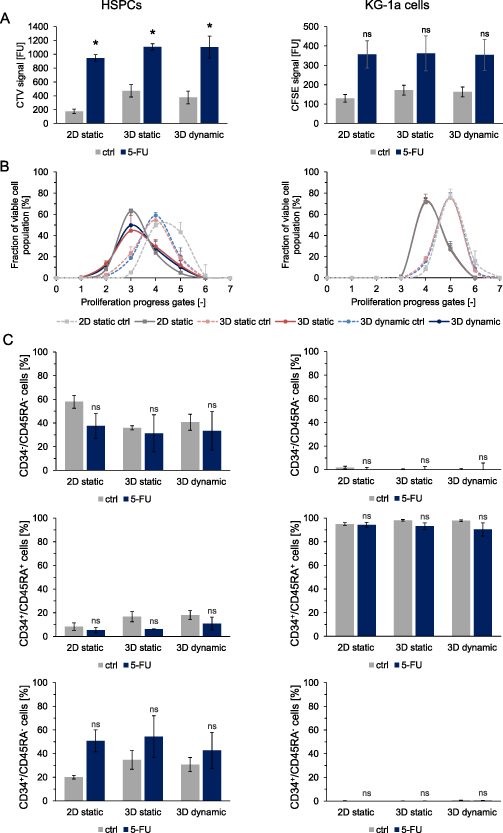
Figure 4. Characterization of HSPCs and KG-1a cells cultured in a triple co-culture with MSCs after 5-FU treatment in static 2D, static 3D or dynamic 3D culture on day 6. (A) Proliferation of HSPCs (left) and KG-1a cells (right). The CTV and CFSE signals of treated cells compared to the controls are depicted. n = 3. Significant differences compared to the corresponding control are given with an asterisk * for p ⩽ 0.05. Non-significant differences (p > 0.05) are marked with 'ns'. (B) The cell fractions of viable HSPCs (left) and KG-1a cells (right) in the different proliferation progress gates after 5-FU treatment compared to the controls are shown (%). n = 3. (C) The percentage of CD34−CD45RA−, CD34+CD45RA+ and CD34+CD45RA− HSPCs (left) and KG-1a cells (right) are depicted. n = 3. Significant differences compared to the respective controls are given with an asterisk * for p ⩽ 0.05. Differences with p > 0.05 are considered as not significant and are marked with 'ns'.
Download figure:
Standard image High-resolution imageAll in all, 5-FU treatment of the developed leukemic bone marrow triculture model revealed inhibiting effects on the proliferation of HSPCs in 2D and 3D, which was in tendency also observed for leukemic KG-1a cells. Survival and differentiation of both cell types were largely unaffected.
3.5. Metabolic analysis of cell culture supernatant emerges as a good non-invasive method to monitor the cell activity in double and triple co-culture
To analyze the cultures over time, the previous end-point analyses are not suited as they require destruction of the scaffold and final cessation of the experiment. Therefore, the potential of analyzing the medium supernatant for monitoring the culture was assessed.
Measuring amino acid concentrations in the supernatants of double and triple co-cultures did not show any clear effects of chemotherapeutic treatments of static or dynamic culturing conditions (supplementary figure 9, supplementary tables 1–7). Of note, in these analyses we averaged over three independent experiments by pooling the supernatants of these independent experiments. While in this way an averaging is possible, the dispersion of the individual samples cannot be assessed.
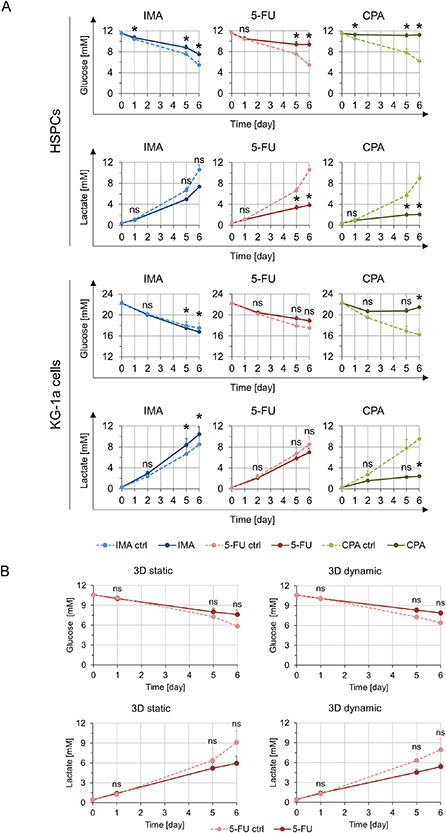
Analysis of glucose, lactate and adenosine allowed monitoring the culture state without scaffold destruction. Metabolically active cells consume glucose and produce lactate and adenosine. Hence, supernatant was taken from the chemotherapeutically treated 3D double and triple co-cultures on three different days and lactate, glucose, and adenosine concentrations were determined.
For the dynamic 3D double co-culture of HSPCs with MSCs, higher glucose concentrations indicating lower metabolic activity of the cells were observed compared to the corresponding controls without treatment. Statistically significant differences were obtained for all chemotherapeutics compared to the control. In line with the above findings, lower lactate concentrations were observed after IMA, 5-FU and CPA treatment (figure 5(A)). Additionally, lower adenosine concentrations could be seen when treated with 5-FU and CPA (supplementary figure 10(A)).
Figure 5. Metabolic analyses of the supernatant of the double co-culture and the triple co-culture after chemotherapeutic treatment with 0.9 µM IMA, 5 µM 5-FU and 10 mM CPA. (A) Depicted are the glucose (n = 3) and lactate (n = 3) concentrations measured in the supernatant of a dynamic 3D double co-culture containing HSPCs (top) or KG-1a cells (bottom) with MSCs at different time points after chemotherapeutic treatment. Significant differences compared to the control are given with an asterisk * for p ⩽ 0.05. Differences with p > 0.05 are considered as not significant and are marked with ns. (B) The glucose (n = 3) and lactate (n = 3) concentrations (mM) measured in the supernatant of the control and 5-FU treated 3D static and 3D dynamic triple co-cultures at different time points are shown. Significant differences compared to the control are indicated with an asterisk * for p ⩽ 0.05. Non-significant differences (p > 0.05) are indicated as ns.
Download figure:
Standard image High-resolution image
In the dynamic 3D double co-cultures of KG-1a cells with MSCs, a decreased metabolic activity was reflected by higher glucose and lower lactate and adenosine concentrations for the CPA treatment. However, in contrast to the HSPCs, the KG-1a cells showed a slightly higher metabolic activity when treated with IMA, as was evident from lower glucose as well as higher lactate concentrations (figure 5(A), supplementary figure 10(A)).
The triple co-cultures in both the static and dynamic settings did not show significantly altered glucose and lactate concentrations although a tendency of increased glucose and decreased lactate levels was visible, which could indicate a lower metabolic activity (figure 5(B)). In case of adenosine concentration, no difference was observed between the treated and the untreated samples in the 3D static system. However, in the dynamic setting a strong increase of adenosine level was measurable in the control, but this effect could not be seen when the cells were treated with 5-FU (supplementary figure 10(B)). In triple co-cultures, the analyses of the supernatant draw a direct relation to the overall metabolite concentrations, thus making it difficult to discriminate the influence of 5-FU treatment on the individual hematopoietic cell types. To identify the discrete effects of 5-FU on HSPCs and KG-1a cells, endpoint analyses as performed previously (figure 4, supplementary figure 8) are necessary. Referencing back to these data, the same trend in viability and proliferation was observed for HSPCs and KG-1a cells.
In summary, particular changes in glucose and lactate concentrations over the entire culture period appeared to reflect the results of cell viability and proliferation obtained in the endpoint analyses of the 3D double and triple co-culture experiments (table 1).
4. Discussion
During progression of AML, the bone marrow niche, in which HSPCs reside, is hijacked by LCs leading to an alteration of the niche making it advantageous for quiescence and self-renewal of LCs [12, 39]. Chemotherapeutic treatment of leukemia affects not only the fast proliferating LCs but also healthy cells like HSPCs, leading to a failure of hematopoiesis and various adverse side effects [4–6]. Investigating the leukemic bone marrow and its contribution to chemotherapeutic resistance of LCs is an important step in order to find new therapies targeting LCs more effectively without affecting HSPCs [16, 18–21]. Therefore, we developed a parallelized drug testing system, using a 3D bone-marrow analog that can be moved in the medium by a magnetic field in a contact-free manner, which leads to perfusion of the analog. It mimics healthy and leukemic conditions that allow drug testing in disposables. To the best of our knowledge, this system is the first of its kind and is suitable for drug testing, focusing on chemotherapeutic effectivity and hematotoxicity.
The applicability of the used magnetic macroporous hydrogels for establishing perfused and non-perfused HSPC-MSC 3D co-cultures was shown before [17]. Based on this system, we developed it further to allow for parallelization and triple co-culture, mimicking not only healthy but also leukemic bone marrow. As before, the enhanced perfusion of the hydrogels was shown by using NaCl, which proved to be indicative for the exchange of soluble factors within macroporous bone marrow analogs, as similar cell behavior could be observed upon perfusion with a conventional perfusion system and using a magnetic reactor [17, 18]. However, Na+ and Cl− have a much smaller molecular weight than cytokines, chemokines as well as the applied chemotherapeutics. Therefore, the precise diffusion behavior of those ions and the larger biomolecules and drugs will differ from each other.
For the development of the leukemic bone marrow analog, different AML cell lines (KG-1a, MOLM-13 and OCI-AML3) were tested for their responsiveness to various chemotherapeutics (IMA, 5-FU and CPA). KG-1a cells (M0 subtype) are human undifferentiated promyeloblastic cells that closely resemble AML stem cells and express ATP-binding cassette transporters which expel chemotherapeutics from the cytosol thus making them chemoresistant to a multitude of drugs. Therefore, KG-1a cells are widely used as model cell line to study AML stem cells [40]. KG-1a cells are resistant to differentiation [41–44] and accordingly the expression of myeloid transcription factors PU.1 and C/EBPα is low [43]. OCI-AML-3 cells (M4 subtype, acute myelomonocytic leukemia) carry mutations in NPM-1 and DNMT3a genes [45]. These mutations are correlated with chemoresistance in AML [46–48]. Furthermore, DNMT3A is a DNA methyltransferase that is important during myeloid differentiation. Its mutation leads to a deregulation in DNA methylation, which has a variety of effects in leukemogenesis including e.g. CDK1 overexpression or deregulation of AML-promoting genes, such as Meis1, Mn1, Hoxa7 or Mycn [49, 50]. In MOLM-13 (M5a subtype, acute monocytic leukemia) cells the tyrosine kinase FLT3 is mutated [51]. FLT3 mutations are correlated with alterations in the myeloid transcription factor PU.1 (e.g. [52, 53]). Thus, MOLM-13 represents a cell line carrying mutations in signal transduction pathways which are important in hematopoietic differentiation and maintenance. The different effects on proliferation and survival of the AML cell lines to the chemotherapeutics indicate that different mechanisms were responsible for the chemotherapeutic resistance. KG-1a cells were chosen for further studies, as their strong chemotherapeutic resistance makes them a good model for LC drug testing [40].
Bone marrow toxicity, i.e. hemato- or myelotoxicity, are often the dose-limiting side effects of chemotherapy [54]. However, so far surprisingly little attention has been paid to the development of systems to reliably predict such toxicities in vitro. In the present study, the effect of chemotherapeutic treatment on the healthy bone marrow niche was analyzed using HSPCs in co-culture with MSCs in a biomimetic 3D scaffold. Due to limited cell numbers from one donor and high donor-to-donor variability, we focused on static 2D and dynamic 3D cultures. Dimensionality and perfusion are known to influence the side effects of chemotherapeutics on healthy HSPCs, as also shown in previous studies assessing bone marrow toxicities by chemotherapeutics in 3D systems [18, 55]. Our results show that the used chemotherapeutics affect healthy cells not only through direct destruction by initiating apoptosis but also by modifying their differentiation potential and thereby changing hematopoiesis. Moreover, decreased viability and proliferation of HSPCs in response to chemotherapeutics were observed in 3D cultures compared to 2D. This can be an important factor in developing severe secondary diseases. These differences underscore the importance of creating in vivo-like conditions to achieve meaningful results from in vitro drug tests for hematotoxicity [13, 16, 56].
To assess the effectivity of chemotherapeutics in impairing LCs along with the toxic side effects on healthy cells, dynamic 3D co-cultures of KG-1a cells and MSCs were established. Here, the effectivity of the chemotherapeutics CPA and 5-FU on the survival of KG-1a cells was greater in standard 2D cultures than in the biomimetic perfused 3D system, indicating that such effects could be overestimated in 2D cultures. This is in line with previous studies showing that the resistance of LCs is increased in biomimetic 3D systems [19, 56–59]. Similar to HSPCs, LCs may reside in a quiescent state resulting in resistance against chemotherapeutics [12, 60]. Given that KG-1a cells serve as model for the investigation of chemotherapeutic resistance of LCs [40], it seems possible that a certain population of the cells proliferated less than others and therefore remains in earlier generations leading to chemotherapeutic resistance. Previous studies showed that the so-called cell adhesion-mediated drug resistance induces LCs to become quiescent and thus resistant to the action of chemotherapeutics that act on proliferating cells. A similar mechanism might as well be responsible for the observed enhanced drug resistance of LCs, when they adhere to a stromal 3D microenvironment [61]. In the present study, a reduction in KG-1a cell proliferation was observed for IMA treatment in 2D culture but not in 3D as shown by proliferation progression analyses. The cytostatic effect of IMA on KG-1a cells in 2D was observed previously [62]. Considering the increased chemotherapeutic resistance in the 3D culture described before, the effect of IMA in the 2D culture is explainable. The cells are less resistant in 2D due to the missing supportive effects from a 3D environment leading to a reduced proliferation observed after IMA treatment. All in all, for some drugs a stronger cellular response of healthy HSPCs—reflecting toxic side effects of the chemotherapeutics on healthy cells—and enhanced resistance of diseased LCs could be observed in 3D. Therefore, drug testing in 2D alone, could lead to underestimation of the toxicity on healthy cells while overestimating drug response of the diseased cells.
The combinatory analysis of CD34 and CD45RA allows discrimination of early and more progressed HSPCs [2]. CD34 expression was additionally correlated to the survival and proliferation of LCs [63]. This finding is in line with the present study showing that the CPA treatment yields a significant reduction of CD34+/CD45RA+ cells as well as a reduced survival and proliferation after static 2D culture and dynamic 3D culture. The observed effect of CPA on the percentage of CD34+/CD45RA+ cells was lower in the dynamic 3D system than in the static culture. Thus, the enhanced resistance of KG-1a cells against chemotherapeutics in the stromal 3D environment that we observed via proliferation experiments, could be verified using cell surface markers that correlate with the proliferation of LCs. All in all, similar to earlier studies reporting enhanced drug resistance of LCs interacting with a stromal 3D environment [21, 57, 64], we also observed enhanced resistance against chemotherapeutics when KG-1a cells were cultured in the magnetic 3D hydrogels supported by stromal cells indicated by altered proliferation and cell surface marker expression.
During leukemia, LCs coexist in bone marrow not only with the stromal microenvironment but also with the healthy hematopoietic system including HSPCs. Thus, a triple 3D co-culture consisting of LCs (KG-1a), HSPCs and MSCs was set up as a leukemic model to mimic this state more closely. This allows simultaneous analyses of both the healthy and diseased hematopoietic cells in response to chemotherapeutic drugs. The results obtained in double and triple co-cultures differed from each other. In both cases, treatment with 5-FU decreased the proliferation of HSPCs and tended to decrease that of KG-1a cells. However, differentiation and viability of HSPCs were only significantly reduced in the double co-culture but not in the triple co-culture. This demonstrates that analyzing the effect of a drug in an environment similar to in vivo may be very useful with regard to detection of chemotherapeutic resistance. 5-FU treatment of KG-1a cells led to a changed proliferation profile with a higher percentage of less-proliferated cells compared to the controls under all culture conditions. This reflects the situation in vivo, where LCs may reside in a quiescent state and thus become resistant to chemotherapy [39, 65]. Early HSPCs usually also reside in a quiescent state in vivo. However, upon treatment with myeloablative agents, early HSPCs may be mobilized, leave the protective niche and enter the cell cycle [66]. This might explain why in our experiments no protective effect of the environment on HSPCs could be observed under 5-FU treatment, indicated by similar proliferation profiles in the double and triple co-cultures. While in the present study rather the endosteal/stromal compartment of the HSC niche was mimicked, inclusion of the vascular compartment in such systems, as elegantly shown in previous studies [19, 24], could enhance the biomimicry and relevance of the system even further.
In many 3D culture systems, monitoring cell behavior is usually done by endpoint analysis that requires destruction of the system and thus, reflects only one time point of the experiment and terminates it. Therefore, analysis of metabolites in the supernatant of 3D cultures is a promising approach to monitor the status of the cells in culture over time. It was shown that analyzing the concentrations of amino acids and metabolites like glucose, lactate and adenosine provides information about cell behavior [28, 67, 68]. Here, it was shown that chemotherapeutic treatment affected the metabolic activity of HSPCs and KG-1a cells in co-culture with MSCs, indicated by an altered consumption of glucose and production of lactate and adenosine compared to the controls. Thus, the analysis of glucose, lactate and adenosine from the culture supernatant was suitable to assess the cell response to the treatment with chemotherapeutics, as the overall shifts in the metabolite levels reflected the observed effects on the cells determined in the endpoint analyses of the experiments.
All in all, the dynamic 3D model for the healthy and leukemic niche can be monitored via determination of metabolite concentrations. Analysis of the supernatant of cell culture represents a non-invasive and sensitive way of assessing chemotherapeutic effects and drawing conclusions about possible resistances.
5. Conclusion
In this work, a novel drug-testing device allowing parallelized analysis in perfused biomimetic 3D leukemic niche analogs is presented. The importance to find a suitable therapy for individual patients in order to avoid possible complications is indisputable. For this purpose, the impacts of possible therapies on the patient cells need to be investigated. The presented approach allows not only to find drugs affecting the LCs but also to spare the healthy cells by assessing effectivity and hematotoxicity at the same time. In addition, metabolic analysis was shown as a non-invasive method to monitor the culture conditions closely and investigate the impact of chemotherapeutic treatment on the survival and proliferation of cells. The presented approach is promising as a test system for the development of new drugs as well as the establishment of disease models in personalized medicine.
Acknowledgments
This work was supported by the NanoMatFutur program of the German Federal Ministry of Education and Research (BMBF; FKZ 13N12968 and 13XP5076A). This project has received funding from the European Research Council (ERC) under the European Union's Horizon 2020 research and innovation programme (Grant Agreement No. 757490). This work also received support from the framework of the SMART BIOTECS alliance between the Technische Universität Braunschweig and the Leibniz Universität Hannover. This initiative is supported by the Ministry of Science and Culture (MWK) of Lower Saxony, Germany. The authors thank Saskia Kraus (Institute of Functional Interfaces, KIT and Institute of Cell Biology and Biophysics, Leibniz University Hannover) for her excellent technical assistance and support in the preparation of magnetic hydrogels, Dr. Domenic Kratzer (Institute of Functional Interfaces, KIT and Institute of Cell Biology and Biophysics, Leibniz University Hannover) for SEM imaging, Frank Kirschhöfer (Institute of Functional Interfaces, KIT) and Michael Nusser (Institute of Functional Interfaces, KIT) for the support regarding adenosine and amino acid determination, PD Dr. Frank Schaarschmidt (Institute of Cell Biology and Biophysics, Leibniz University Hannover) for statistical consultation and Kai Sachsenheimer (Institute of Microstructure Technology, KIT) for rebuilding of the magnet lift. The authors are grateful to Professor Karen Bieback (Heidelberg University; German Red Cross Blood Donor Service Baden-Württemberg–Hessen, Mannheim, Germany) for kindly providing MSCs and Birgit Huber (Soft Matter Synthesis Lab, KIT) for the synthesis of PEGDA.
Data availability statement
The data that support the findings of this study are available upon reasonable request from the authors.
Conflict of interest
The Karlsruhe Institute of Technology (KIT) holds a patent entitled 'Verfahren zur dreidimensionalen Kultivierung von Zellen in einem flüssigen Nährmedium' on the process for the three-dimensional cultivation of cells in a liquid culture medium using macroporous magnetic hydrogels (Patent applicant: Karlsruhe Institute of Technology; names of inventors: C Lee-Thedieck, L Rödling, L M Franzreb, A Raic, E Volz, B Rapp; Patent Number: EP3375864 B1; status of application: granted). The authors declare no other competing interests.