
Abstract
Morphogenesis, a complex process, ubiquitous in developmental biology and many pathologies, is based on self-patterning of cells. Spatial patterns of cells, organoids, or inorganic particles can be forced on demand using acoustic surface standing waves, such as the Faraday waves. This technology allows tuning of parameters (sound frequency, amplitude, chamber shape) under contactless, fast and mild culture conditions, for morphologically relevant tissue generation. We call this method Sound Induced Morphogenesis (SIM). In this work, we use SIM to achieve tight control over patterning of endothelial cells and mesenchymal stem cells densities within a hydrogel, with the endpoint formation of vascular structures. Here, we first parameterize our system to produce enhanced cell density gradients. Second, we allow for vasculogenesis after SIM patterning control and compare our controlled technology against state-of-the-art microfluidic culture systems, the latter characteristic of pure self-organized patterning and uniform initial density. Our sound-induced cell density patterning and subsequent vasculogenesis requires less cells than the microfluidic chamber. We advocate for the use of SIM for rapid, mild, and reproducible morphogenesis induction and further explorations in the regenerative medicine and cell therapy fields.
Export citation and abstract BibTeX RIS

Original content from this work may be used under the terms of the Creative Commons Attribution 4.0 license. Any further distribution of this work must maintain attribution to the author(s) and the title of the work, journal citation and DOI.
1. Introduction
Engineering the hierarchical complexity of living tissues is a key challenge in regenerative medicine and an essential step towards the production of functional organs [1]. 2D cell cultures have been used for decades to elucidate a variety of key pathophysiological cellular processes, with an invaluable role in the process of drug development. However, more complex multicellular tissue functions, such as tissue development, are directed by a complex spatial orchestration of biochemical and biophysical cues within the extracellular matrix (ECM) environment [2].Therefore, methodologies able to spatially organize cells within hydrogels that resemble the ECM physicochemical properties are of paramount importance. Indeed, cell patterning is fundamental to both unravel biophysical mechanisms of morphogenesis, and to recreate complex tissue organization in vitro with the ultimate aim to develop novel therapeutic approaches. Standard technologies to fabricate architecturally organized constructs include micro-molding [3], magnetic levitation [4], photolithography [5] and 3D-bioprinting technologies [6]. Although important advancements have been reached in improving the resulting cellularized constructs, as for example in terms of resolution [7, 8], several limitations still have to be overcome, including: (a) loss in cell viability due to, for example, the shear rate or the toxicity of the used photocrosslinking system; (b) long manufacturing times; (c) high costs; (d) limited materials and (e) difficulties in translating these technologies from 'bench to bedside' [9, 10]. Additionally, despite the effort to design scaffolds that mimic the native ECM, these approaches cannot generate physiologically relevant cell-packing density and have no control over the cell proximity typical of tissues with minimal ECM.
The success of the in vitro fabrication of most functional and complex 3D tissues and organs is linked to the generation of a vascular network [11]. During vasculogenesis, aggregation of endothelial cells is fundamental to ensure cell-cell interaction, responsiveness to pro-angiogenic factors and the subsequent organization into tube-like structures. The most common approaches to promote in vitro vascularization can be divided into bottom-up, where cell self-assembly is induced by physical or chemical stimuli [12, 13] and top-down, where the vascular architecture is predefined by biofabrication methods [14–16].
Recently, cell self-assembly to form vascular networks has been obtained by applying extrinsic cues such as magnetic or acoustic fields, and the cell organization was globally defined by the spatiotemporal distribution of the extrinsic field [17].
Specifically, acoustic wave patterning is an emerging technology that provides a platform to control the spatial location of cells [18]. Acoustic vibrations generate a pressure gradient in a fluid and allow to precisely pattern suspended microparticles and cells in a simple, fast and contactless way within medium or ECM-based hydrogels, reducing cell damage compared to traditional bioprinting techniques. Up to now, acoustic cell patterning has been used to replicate biological processes such as myotubes formation [19], angiogenesis [20], neural differentiation [21], and cardiomyocyte differentiation [18].
Most of these approaches are based on acoustophoretic devices well known for their implementation in microfluidic platforms for cell/particulate isolation, separation or densification [22] using ultrasound standing waves [19–24]. Despite the rapidity of the process and the high resolution of the patterns, these platforms show limitations such as the use of complex devices, amplitude attenuation in large constructs, and increase in temperatures that may affect ECM properties and cell viability. These limitations hinder the scalability of the process and the translation potential of those techniques.
As an alternative, a different acoustic patterning method has been recently introduced by pioneering studies from Chen and colleagues [25]. This method involves the use of Faraday waves created at the liquid-air interface by a low-frequency vertical vibration applied at the bottom of a chamber. After sedimentation, positioning of cell aggregates happens in few seconds under the nodes of acoustic standing surface waves. This phenomenon provides excellent systems to study pattern formation due to the high degree of control compared to other pattern-forming systems such as convection or chemical reactions [26], a higher freedom and flexibility over a variety of patterns [27], and the possibility to overcome the above-mentioned limitations of the acoustophoretic devices. In particular, Chen and colleagues have already demonstrated the patterning of spheroids in a number of highly complex geometries and formed microtissues by tuning vibration parameters (frequency and amplitude), fluid properties (viscosity, density, surface tension) and chamber shape. Despite these initial advancements, there are still no studies that focus on specific functional tissues or biological responses.
Therefore, in this study we propose an acoustic-based technology, namely sound induced morphogenesis (SIM), to investigate the combination of acoustic patterning with physiological self-assembly and its effect on lowering the number of cells required to generate multiscale and perfusable vascular networks. Firstly, the efficacy of the SIM device was tested using inorganic particles (tricalcium phosphate, TCP) in a gelatin methacryloyl (GelMA) precursor. Two TCP geometrical patterns have been investigated in terms of frequency and amplitude variation, i.e. concentric rings and an array of N × N dots. Afterwards, self-assembly of cells was evaluated after SIM patterning of endothelial cells (human umbilical vein endothelial cells, HUVEC) in combination with human mesenchymal stem cells (hMSC) in fibrin gel, both as single cells and as spheroids (figure 1). As a result, a multi-scale vascular network was created starting from gradients of cell densities in a fast, single-step procedure within 5 d. A comparison between SIM and the traditional self-assembly technique, such as that exploited in microfluidic models [13] was carried out in order to assess the potential of our device in terms of vascular network formation.
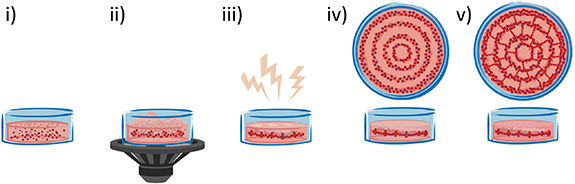
Figure 1. Schematic representation of vascular network formation with SIM process. (i) Cells or spheroids are dispersed in the hydrogel precursor. (ii) A vertical mechanical vibration is applied and a pattern is generated. (iii) Crosslinking of the patterned geometry within the hydrogel is carried out by using different stimuli (e.g. light, enzymatic, thermal crosslinking) depending on the selected material. (iv) Patterned cells or spheroids at day 0 show a local density enhancement. (v) Vessel network formation at day 5 via cells self-assembly and organization.
Download figure:
Standard image High-resolution imageIn a nutshell, in this work we develop an in vitro experimental model as proof-of-concept to assess the feasibility of SIM for creating vascular structures. We show that this is a highly versatile method with many degrees of freedom (material, cells, patterning parameters), allowing to exploit the SIM device in several biomedical fields.
2. Materials and methods
2.1. Matrices for sound patterning
Two crosslinkable hydrogels, namely gelatin methacryloyl (GelMA) and fibrin gel, were employed as matrices for the acoustic patterning of TCP particles or cells, respectively. The precursor gel was placed into an insert contained in a petri dish, and this system was positioned in the vibration chamber (figure S1 (available online at https://stacks.iop.org/BF/13/015004/mmedia)). After patterning with sound, the GelMA was crosslinked with UV light exposure, whereas fibrinogen underwent enzymatic crosslinking.
2.1.1. GelMA synthesis.
Methacrylated groups were grafted to gelatin as previously reported [28]. Briefly, gelatin derived from porcine skin (Sigma-Aldrich, St. Louis, MO, USA) was dissolved at 10% w v–1 in PBS at 60 °C. After obtaining a clear solution, 0.14 ml of methacrylic anhydride for each gram of gelatin was added dropwise and the reaction was carried on for 3 h at 50 °C. The GelMA solution was then dialyzed against deionized water using 12–14 kDa cutoff dialysis tubes (VWR scientific, Radnor, PA, USA) for 6 d at 50 °C to remove unreacted methacrylic anhydride and any additional by-products. GelMA was lyophilized and stored at −20 °C until further use.
2.1.2. Fibrin gel.
Fibrinogen solutions (64% protein, 90% clottable protein, Sigma-Aldrich) were prepared at concentrations of 5 mg·ml−1 in PBS and incubated for 1 h at 37 °C. Then, the solutions were sterile-filtered using 0.2 μm pore filters and stored at −20 °C. A 100 U·ml−1 thrombin solution was prepared by reconstituting lyophilized thrombin from human plasma (Sigma-Aldrich, 143 NIH U·mg−1protein) with a solution of 1.1% NaCl and 2 mM CaCl2. Aliquots were stored at −20 °C.
2.2. Patterning of TCP particles
A panel of different geometries was obtained by patterning tricalcium phosphate particles (TCP, Kuros Biosciences BV, Bilthoven, The Netherlands) with a diameter range of 125–250 μm in a photocrosslinkable methacrylated-gelatin hydrogel (GelMA). In particular, 70 mg TCP particles were mixed with 5% w v–1 GelMA and 0.3% w v–1 Irgacure 2959 within two different chamber geometries, the squared chamber (side of the inner square = 15 mm and h = 1 mm) and the circular chamber (diameter of the inner circle = 21 mm and h = 1 mm). These inserts were made of polycarbonate and were manufactured via conventional subtracting manufacturing. For both the squared and circular geometries, a range of frequencies and amplitudes was applied for 10 s in order to study the pattern reproducibility. Patterns were fixed via UV exposure using a Bio-Link BLX-365UV radiation chamber (Vilber Lourmat, Collegien, France) for 5 min (0.1 J cm−2). All samples were obtained in triplicates. Clips of TCP pattern formation were acquired with a camera integrated to the SIM prototype (mimiX Biotherapeutics Ltd., Neuchâtel, Switzerland).
2.3. Particle dynamic simulation of acoustic waves
The potential energy U of the system can be described by two different components,  and
and  [29]:
[29]:
The first component,  applies to the n simulated particles and represents the effect of the vibrations that produce the Faraday waves on the liquid-air interface. Chen and colleagues have already described an equation for
  of a particle in the system, which is a position-dependent potential [30]:
where R and  are the average radius and density of the particle respectively,
  is the density of the liquid, μ is the dynamic viscosity of the liquid and δ is the submerged length of the particle; these values require parameterization according to the particles and the liquid used. Other parameters are function of the amplitude A and frequency f of the vertical vibrations of the system:
α is the acceleration of the system, ω is the angular frequency of the standing waves, ζ is the liquid surface deformation and  is its 90° phase shift in x and y directions.
For the liquid surface deformation equation ζ, two different forms were used to simulate the patterning observed in two different chamber shapes,  for a square chamber or
  for a circular chamber of radius
  :
:


After applying a vibration to the system, by using the linear dispersion relationship:
it is possible to calculate the wavelength λ of the Faraday waves by applying the limits of capillary waves and thin liquid films [11], where wavelength is equal or greater than the liquid thickness, to get the following equation:
where  and H are the surface tension and the depth of the liquid,
  is the frequency of the Faraday waves and corresponds to half the value of the frequency f for the vibrations applied to the system.
The second component,  , regulates the interaction between the particles and applies to all their possible pairs, preventing an intersection of their volumes. It is described by truncated cut-off (and purely repulsive) Lennard-Jones interactions between the pairs of particles:
where ε is the well depth of the potential, σ is the distance at which the potential between the two particles is 0 (chosen as the sum of the radiuses of the two particles interacting) and  is the distance between particles i and j. To calculate the trajectories of the particles, a Verlet algorithm was used. This required the calculation of the components x, y and z of the forces F acting on the particles, which were obtained through the relationship:

Non-conservative forces were applied to the system to simulate the friction of the moving particles with the bottom of the patterning chamber and with the fluid. These forces allowed the particles to stop. The simulation box was set up as a square or circle with solid borders and the simulated particles were placed randomly on its surface. This boundary conditions corresponded to the experimental settings. A C++ script was developed to calculate the simulations; the results and potential energy surfaces were visualised with MatlabTM (MathWorks, Natick, MA, USA). The in silico simulations were performed by using parameters equivalent to those of GelMA 5% (density = 1.063 g cm−3), TCP particles approximated as spheres with a diameter of 125 μm and density = 3.14 g cm−3, and using 1000 particles for the square geometry and 2000 particles for the circular geometry. A timestep of 0.1 ms was used.
2.4. Cell culture and spheroid formation
Green fluorescent protein-expressing Human Umbilical Vein Endothelial Cells (GFP-HUVEC) were purchased from Angio-Proteomie (Boston, MA, USA) and cultured in complete EGM-2 Endothelial Cell Growth Medium (Lonza, Basel, Switzerland) on tissue culture plastic pre-coated with Quick Coating Solution (Angio-Proteomie). Medium was refreshed every second day and cells were used up to passage 7.
Human mesenchymal stem cells (hMSC) were isolated using established protocol [31]. Bone marrow aspirates were harvested during routine procedures from the vertebral body of patients with full ethical approval (Bern Req-2016-00141). hMSC were subcultured maintaining a seeding density of 3 × 10³ cells·cm−2 in α-MEM (Minimum Essential Medium Eagle - alpha modification, Gibco, Thermo Fisher, Zürich, Switzerland) with 10% MSC-qualified FBS (Fetal bovine serum, Pan-Biotech, Aidenbach, Germany), 100 U·ml−1 penicillin, 100 μg·ml−1 streptomycin (Gibco) and 5 ng·ml−1 basic Fibroblast Growth Factor (bFGF, Fitzgerald Industries International, Acton, MA, USA). Medium was changed every second day. hMSC up to passage 4 were used for the experiments. Both GFP-HUVEC and hMSC were maintained at 37 °C in a 5% CO2 humidified atmosphere.
For spheroid formation, cells were detached with 0.05% Trypsin-EDTA (Gibco, Thermo Fisher) and counted in a Neubauer chamber with Trypan Blue exclusion. Mixtures of 1:1 GFP-HUVEC:MSC (2 × 10⁶cells each) were seeded in 100 mm ultra-low attachment culture dishes (Corning, New York, NY, USA) to avoid cell adhesion to the substrate and favour cell-cell interactions and spheroid formation. The medium was composed of 1:1 mixture of EGM-2 and MSC growth medium as described above. The cells were incubated for 48 h at 37 °C—5% CO2 to allow for spheroid formation, then the spheroids were used for further experiments.
2.5. SIM patterning of single cell suspension
hMSC were suspended in medium at a concentration of 5 × 10⁶cells·ml−1 and placed in a 60 mm-Petri dish. A 3 G acceleration amplitude and a frequency of 157 Hz were used for 10 s in order to obtain the desired pattern. After patterning, the Petri dish containing the cell pattern was kept at rest for 1.5 h to ensure a stable adhesion of cells to the Petri dish. Samples were run in triplicates and non-patterned hMSC in medium were used as control. After 1 d of culture, both metabolic activity and cell viability were assessed respectively by CellTiter-Blue® Assay (Promega, Dübendorf, Switzerland) and Live/Dead Assay (10 μM calcein AM and 1 μM ethidium homodimer, Sigma-Aldrich). Morphological evaluation of cell organization was performed using phalloidin staining. After an initial washing in PBS, patterned cells were permeabilized with 0.25% Triton X-100 for 15 min RT, then stained with 2 μg·ml−1 of TRITC-conjugated phalloidin for 45 min at RT. HUVEC and hMSC were patterned after embedding within a fibrin gel to assess the formation of vascular networks. In particular, HUVEC alone or HUVEC and hMSC (ratio 10:1) were mixed in fibrinogen (final concentration 2.5 mgml). After the addition of thrombin at a 0.5 U·ml−1 final concentration, cells were patterned in the circular insert (10.5 mm radius) with 1.2 g acceleration amplitude and 80 Hz frequency for 30 s. Three different HUVEC concentrations (0.4 × 10⁶, 0.8 × 10⁶ and 3 × 10⁶ cells·ml−1) were tested in order to study the influence of cell density on the microvascular network formation. The resulted patterns were cultured up to 5 d in EGM-2 medium in a 37 °C and 5% CO2 humidified atmosphere. The medium was changed every two days. At different time points (3, 24, 72 and 120 h) the vascular network was analysed for the following parameters: average number of branches, average junctions, total network length and vessel diameter. An ethidium homodimer staining (1 μM) was carried out to check the influence of the SIM patterning on the viability of cells embedded in a hydrogel matrix. All samples were prepared in triplicates.
2.6. Vascular network formation in microfluidic chip
A poly(dimethylsiloxane) (PDMS; Silgard 184, Dow Chemical, Midland, MI, USA) microfluidic device was produced as previously reported [32, 33] and bound to a glass coverslip with oxygen plasma in order to create channels with a 150 μm height. In particular, the device consisted of 4 channels for media supply (1300 μm wide × 10 000 μm long and 150 μm high) and 3 channels that hosted the fibrin gel (1000 μm wide × 8000 μm long and 150 μm high). Each hydrogel channel is designed with trapezoidal micro-posts (200 μm length and 100 μm distance) that allow surface-tension during the filling of the channel with the cell-laden fibrin hydrogel. The channels were accessible through inlets created with 4 mm—diameter biopsy puncher (for medium reservoir) and 1.2 mm biopsy puncher for hydrogel filling. GFP-HUVEC alone or in combination with hMSC were resuspended in complete EGM-2 medium mixed with thrombin and seeded in two of the 3 channels. Three different HUVEC concentrations (0.4 × 10⁶, 0.8 × 10⁶ and 3 × 10⁶ cells·ml−1) were tested in order to study the influence of cell density on the microvascular network. Thrombin and fibrinogen were mixed at 1:1 v v–1 ratio to obtain a final concentration of 0.5 U·ml−1 and 2.5 mg·ml−1, respectively. The microfluidic chips were kept in a humidity chamber for 15 min to allow the complete gelation and afterwards the medium channels of all microdevices were filled from one side with complete EGM-2 and placed into an incubator (humidified, 37 °C, 5% CO2). The EGM-2 medium was changed at day 1 and day 3. At different time points (3, 24, 72, and 120 h) the vascular network was analysed for different parameters, such as average number of branches, average junctions, total network length and vessel diameter.
2.7. Sound induced patterning of HUVEC-hMSC spheroids
HUVEC-hMSC spheroids formed after 48 h of incubation were collected and mixed in thrombin solution, then mixed with fibrinogen solution immediately before patterning (final concentrations: 0.5 U·ml−1 thrombin + 2.5 mg·ml−1 fibrinogen). The spheroid-fibrinogen-thrombin solution was quickly transferred to a Petri dish containing the SIM circular insert (10.5 mm radius) and pattern formation was induced using a frequency of 80 Hz and 0.5 g acceleration amplitude for 10–15 s in order to obtain a pattern with concentric rings. The samples were incubated for 5 min at 37 °C to ensure complete fibrin crosslinking, then 1:1 EGM-2:MSC growth medium was added. Samples were maintained in culture in a 37 °C and 5% CO2 humidified atmosphere up to 5 d and medium was refreshed every second day.
2.8. Perfusion of a multi-scale vascular network
Polycarbonate inserts with a circular and square geometries were modified with two 1000 μm-diameter holes in the middle (figure S1(c)). The inserts were attached to a glass slides by using a double-sided tape and were sterilized with UV light for 1 h. The insert was designed to be placed directly into 60 mm-petri dishes. A sterile polyetheretherketone (PEEK) tube (external diameter 0.9 mm and internal diameter 0.8 mm) was inserted in the middle of the insert through two 1000 μm-diameter holes in order to recreate a macrovessel. Afterwards, spheroids of GFP-HUVEC (passage 6) and hMSC (passage 2) with a 1:1 ratio were embedded in a fibrin gel (2.5 mg·ml−1 of fibrinogen and 0.5 U·ml−1 of thrombin) that was polymerized in the insert keeping the PEEK tube in the middle to ensure interconnection between the macrovessel and the microvessels generated by the spheroids pattern. After crosslinking, the PEEK tube was removed, and the macrochannel with a resulting diameter of 800 μm was perfused with 107 cells·ml−1 GFP-HUVEC or RFP-HUVEC. Cell adhesion to the fibrin was ensured by keeping the cell suspension inside the macrochannel for 30 min per side. Finally, PBS was perfused through the macrochannel and the patterned sample was cultured with EGM-2 for 5 d. At day 5, the macrochannel was perfused with Texas-Red dextran (70 kDa, Thermo Fisher). Mosaic and z-stack images were acquired on days 0, 1 and every 2 d thereafter using a Zeiss LSM800 confocal microscope (Zeiss, Oberkochen, Germany). Perfusion tests were performed, and images were acquired in time sequence. Afterwards, the samples were fixed in 4% neutral buffered formalin.
2.9. Immunofluorescence
After an initial washing in PBS, the gels with cell patterns were fixed in paraformaldehyde 4% for 15 min at RT. The non-specific binding sites were blocked with 10% FBS and permeabilization was performed with PBS/Tween20 for 30 min. Anti VE-cadherin primary antibody (CD144, Waltham, US) at a concentration of 5 μg·ml−1 was added for 1 h at RT. Gels were washed with PBS, then the secondary antibody was added (Alexa Fluor 647 IgG 1:800, Thermo Fisher) for 1 h at RT. After washing with PBS, cell nuclei were counterstained with DAPI (4',6-diamidino-2-phenylindole) (1:800) and evaluated with a Zeiss LSM800 confocal microscope.
2.10. Image acquisition and analysis
Phase-contrast and fluorescence images of cells viability and morphology were acquired using a Zeiss LSM800 confocal microscope equipped with a CCD camera (Axiocam 506 color) at magnification 5X (0.16), 10X (0.45), 25X (water immersion objective 0.8) and 40X (water immersion objective 1.1). Time-lapse images of cell growth and spatial organization were obtained at 0, 24, 72, 120 h after SIM patterning or random organization. Image analyses were performed using ImageJ software (NIH, Bethesda, MD, USA).
The grown kinetic of the pattern was evaluated by measuring the total green area in the time-lapse pictures between 0 and 24 h after the pattern formation. The image of the green channel was converted into 8-bit and a gaussian filter (1 pixel) was applied prior thresholding (minimum and maximum threshold values were set at 15 and 255, respectively). The total area was then measured and plotted against time.
The intensity profile was evaluated by applying the ImageJ built-in function 'Profile plot'. The orientation of the images was maintained constant and a median filter with neighbourhood of three pixels was applied in order to reduce the noise and smooth the image's features. The background was then removed with ImageJ built-in function 'Subtract background' with a rolling ball radius of 50 pixels. Next, a line with a thickness of seven pixels was drown through the image's center, horizontally and for all length of the sample image.
The vessel network was analysed by applying an ImageJ macro. Specifically, three different areas (1000 μm × 1000 μm) were selected for each sample and converted into 8-bit greyscale and adjusted through thresholding (minimum and maximum threshold values were set at 15 and 255, respectively). Images were smoothed with Gaussian blur to reduce image noise and redundant details. The images were then examined with the ImageJ function 'Analyze skeleton'. This plugin tags all pixels in a skeleton image and counts all its junctions, triple points (junctions with exactly three branches) and branches. The vessel diameter was calculated as average of ten measures per sample.
3. Results and discussion
3.1. System optimisation with TCP particles/GelMA
Polycarbonate contour chambers with a square (side = 15 mm, h = 1 mm) or circular (diameter = 21 mm, h = 1 mm) geometry were placed into 60 mm-diameter Petri dishes, which were accommodated within the circular vibration chamber on the SIM device (figure S1). These chambers were filled with selected matrices (cell culture medium, GelMA hydrogel precursor or fibrinogen) containing particles (TCP particles, cells or spheroids). Frequency and amplitude were applied through the electromagnetic vibration generator controlled by a sine wave generator integrated into an SIM prototype (mimiX Biotherapeutics Ltd., Neuchâtel, Switzerland) and the resulting acceleration amplitude, which is a function of both frequency and amplitude, was then measured by using an accelerometer.
Firstly, pattern formation was tested in the presence of 70 mg TCP particles (diameter = 125–250 μm) mixed within 2 ± 0.5 ml of GelMA precursor (5% w v–1, G' = 240 Pa). Amplitude and frequency were kept constant at 0.5 g and 40 Hz, respectively. Patterns were generated after 10–15 s (square pattern showed in supplementary video 1). Afterwards, the exposure to UV light ensured the crosslinking of GelMA and shape stabilization.
A 3D visualization of the acoustic potential field (figure 2(a), i) and a particle dynamic simulation (figure 2(a), ii) were generated for both circular and square geometries in order to understand the influence of the chamber shape on pattern generation.
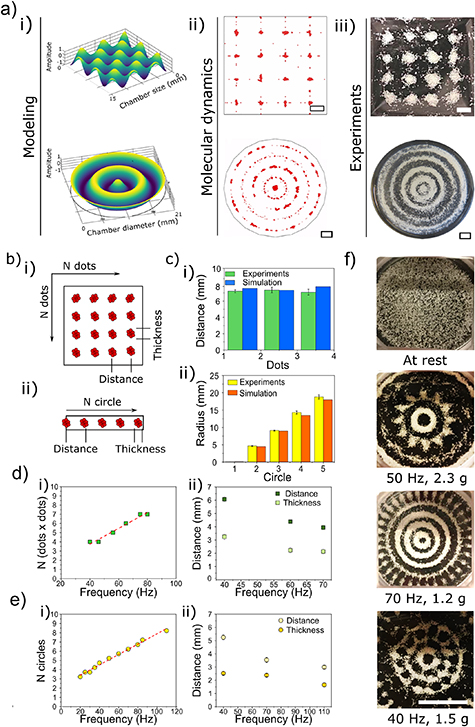
Figure 2. TCP Patterning in GelMA using two different geometries, a square and a circle. (a) i. 3D Modelling of the standing acoustic waves generated using the different geometries; ii. Particle dynamic simulation, scale bars = 2 mm; iii. Patterns obtained experimentally by applying 40 Hz frequency and 0.5 g acceleration amplitude, scale bars = 2 mm; (b) schematic of TCP patterns in both square (i) and circle (ii) geometries showing the thickness and the distance. (c) Comparison of spot distance (i) and circle radius (ii) for experimental (green bars for the square and yellow bars for the circles) and simulated patterns (blue bars for the square and orange bars for the circle). (d) Using a square geometry: i. linear correlation (red dashed line, R2 = 0.986) between dots number per side and frequency applied; ii. distance between adjacent spots (dark green squares) and thickness of the TCP spots (light green squares) obtained at three different frequency values, 40, 60 and 70 Hz. (e) Using a circular geometry: i. linear correlation (red dashed line, R2 = 0.995) between rings number and frequency; ii. distance between adjacent rings (light yellow circles) and thickness (dark yellow circles) at three different frequency values, 40, 70 and 110 Hz. (f) TCP patterns obtained with a circular geometry varying both amplitude and frequency. From top to bottom: at rest; 50 Hz and 2.3 g amplitude; 70 Hz and 1.2 g amplitude; 40 Hz and 1.5 g amplitude; scale bar = 10 mm. The experimental data are shown as an average of three replicates and the error bars represent the standard deviation.
Download figure:
Standard image High-resolution imageThe simulated pattern obtained in the square geometry was characterized by N × N spots, with N linearly increasing with the vibration frequency. The different zones in the petri dish correspond to anti-nodes and nodes of the combined standing waves on the liquid surface (supplementary video 2. The timing of the simulation does not reflect the time for real pattern formation). The simulated pattern was experimentally confirmed with TCP particles (figure 2(a), iii), showing comparable results in terms of spots distance and a high correlation between the experimental and simulated spots distribution (figure 2(a), iv). The simulation was optimized using the parameters of GelMA viscosity as matrix and TCP particles size and densities; the modelization with other hydrogels and particles/cells is feasible by setting up a different parameterization.
The circular geometry showed a pattern with N concentric rings, with N being related to the frequency applied (supplementary video 3). At 0.5 g amplitude and 40 Hz frequency, a central spot and 4 concentric rings were visible, both in the simulation and in experimental patterns (figure 2(a), i–iii). The comparison between SIM patterns obtained via simulation or experimentally showed similar values in terms of radii of the patterned concentric rings, in line with the results of the square geometry (figure 2(c), iv). We observed that the viscoelastic properties of the hydrogel matrix and its crosslinking chemistry play a key role in determining the final pattern geometry
These initial experiments allowed to understand the interplay between parameters such as frequency and amplitude, and their respective importance on obtaining the desired pattern and assembly.
With increasing the frequencies and fixing the amplitude at low values, a linear correlation was observed between the frequency and the number of spots (for the square geometry, figure 2(d), i) or of concentric rings (figure 2(e), i), showing a R2 of 0.986 and 0.995, respectively. In contrast, both the thickness of the TCP rings or spots and their distance, calculated between the centers of two adjacent rings or spots, decreased with an increase of the frequency (figure 2(d), ii and (e), ii). The fraction 0.5 was used to identify the formation of a central spot in the circular pattern. The spot is visible only at specific frequency values.
Additionally, a panel of patterns were generated for circular geometry by varying both the frequency and the amplitude, as shown in figure 2(f). By increasing both frequency and amplitude, the complexity of the patterns increased, going from simple concentric rings to complex regular honeycomb-like structures.
3.2. SIM patterning of single cells in spatially and multi-scale organized vascular networks
After conducting the preliminary experiments by employing TCP particles, hMSCs were patterned as single cells in medium in a 60 mm Petri dish, by applying a frequency of 157 Hz and 3 g acceleration amplitude that resulted in a pattern of concentric circles. We assessed if the SIM technology may negatively affect cells. hMSCs showed a cell viability and a metabolic activity comparable to the non-patterned controls (figure S2). In particular, a cell viability of 93% and 92% at days 1 and 4 was observed for the patterned cells compared to the control, 98% and 92%, at day 1 and 4, respectively.
Next, GFP-HUVEC cells were mixed with hMSC at a ratio 10:1 to ensure a proper formation of the vascular network as shown in previous studies [34, 35]. The cells were patterned using concentrations of 0.4 × 10⁶, 0.8 × 10⁶ and 3 × 10⁶ cells·ml−1, that are reported throughout the manuscript as 0.4 M, 0.8 M and 3 M, respectively. HUVEC alone were also patterned. A 2.5 mg·ml−1 fibrin gel was selected as hydrogel matrix to support the formation of vessels thanks to its well-known natural angiogenic properties and its intrinsic ability to stimulate endothelial assembly [36, 37]. Thrombin concentration of 0.5 U·ml−1 allowed to obtain a fast gelation (clotting time < 5 min [38] of the matrix right after the stabilization of the pattern). Without the use of sound patterning (Random group), GFP-HUVEC/hMSC cells were randomly distributed within the fibrin gel, whilst the SIM patterning (SIM group) allowed to organize cells into circular patterns by applying a frequency of 80 Hz and a 2.5 g amplitude within the circular insert. The amplitude and frequency were tuned in order to achieve the desired pattern shape considering the cell size and the viscoelastic properties of fibrin (G' = 264 Pa). In particular, the resulting pattern was characterized by concentric rings that subsequently connected to each other thanks to the sprouting of the HUVEC (figure 3(a)). This specific pattern geometry was selected to show the functionality of the generated vessel-like structures in terms of angiogenic properties, hence the branching of pre-existing structure represented by the patterned concentric circles. The vascular network formation was followed until day 5: the pattern evolution at early time points (2, 24 and 72 h) is shown in figure S3. The obtained pattern was confirmed by the quantification of the fluorescence intensity on confocal images. For the three cells concentrations the GFP intensity values of the patterned samples varied in correspondence with the cell density (figure 3(b)). The random samples showed a constant flat baseline intensity value throughout the surface areas.
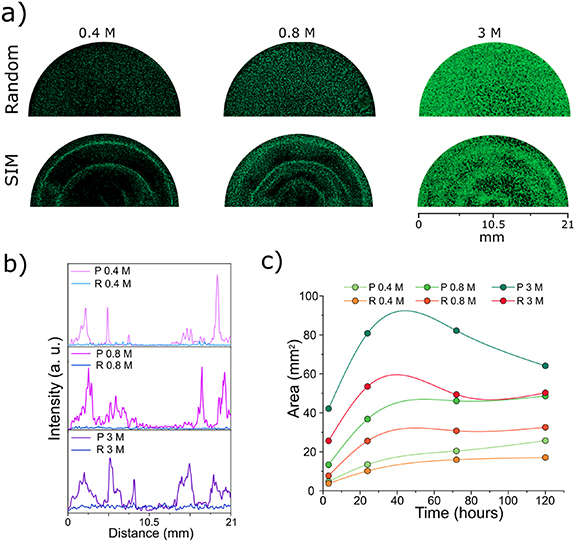
Figure 3. Single cell patterning in fibrin gel. (a) 10:1 HUVEC:hMSC seeded in 1 ml fibrin gel at 0.4 × 10⁶ cells·ml−1 (0.4 M), 0.8 × 10⁶ cells·ml−1 (0.8 M) and 3 × 10⁶ cells·ml−1 (3 M), imaged after 5 d in culture; cell patterns were generated by applying SIM or cells were randomly distributed (scale bar = 4000 μm). (b) Green intensity distribution at day 5 for random (self-assembly) or SIM patterned cells at 0.4 M, 0.8 M and 3 M; (c) cell pattern evolution calculated as green area (mm2) from day 0 to day 5.
Download figure:
Standard image High-resolution imageFurthermore, for both random and patterned group, the quantification of the green area over time for 0.4 M and 0.8 M HUVEC in co-culture with hMSC showed an increase in the green area at day 1 and these values were stable over time until day 5, whereas the group with 3 M showed a decrease in the green area from day 3 (figure 3(c)). As expected, the addition of hMSC in the fibrin gel guaranteed both a stability of the vascular network over time and a higher sprouting from the HUVEC. In particular, in the control groups with HUVEC alone, cells showed mostly a rounded morphology, with a low number of elongated cells both in the SIM and in the randomly distributed cells, as confirmed by confocal imaging (figure S4). For all concentrations, the addition of hMSC led to an increased stability of the cellular network and to a higher area covered by HUVEC: with 0.8 M HUVEC/hMSC, the green area value (47 mm2) doubled compared to the HUVEC alone, underlying an increase in cell sprouting. A percentage of dead cells below 1% was found for both random and sound-pattern groups as assessed by the ethidium homodimer staining (figure S5). These low values were confirmed over time within 5 d.
Additionally, SIM patterning increased proximity between cells, promoting the formation of areas with high cell density (HD) as shown in figures 4(a) and (b). HUVEC sprouted from a HD area into the low-density area (LD), connecting to the nearest HD area. A comparison between three selected areas (1000 μm × 1000 μm) of constructs generated via sound-patterning (HD and LD) and microfluidic devices was carried out to evaluate how the patterning capability of SIM influenced the formation of vascular networks (figure 4(c)) compared to state of the art technology (figure 4(d)). When co-culturing HUVEC and hMSC at HD (3 M), SIM LD and microfluidics showed a similar behaviour in vascular network formation, with an average number of junctions of 145 ± 22 and 140 ± 14, respectively (figure 4(f)). When HUVEC density was reduced to 0.8 M, the vessel network became less dense with average number of junctions of 104 ± 18 for SIM LD and 54 ± 7 for microfluidics. At 0.4 M HUVEC, no network formation was observed in either SIM LD areas, showing a low number of elongated cells and average number of junctions of 7.5 ± 0.7 for SIM LD and 6.5 ± 0.7 for microfluidics. Confirming this trend for both number of average branches (figure 4(e)) and total network length (figure 4(g)). However, at 0.4 M, the HD areas of the sound patterned samples showed the formation of a vascular network with 109 ± 30 average number of junctions, demonstrating the effect of the sound patterning and creation of local cell density gradients followed by self-assembly (SIM), compared to a self-assembly process alone (microfluidic) at low cell density. A similar behaviour was observed for the average branch numbers and the total network length (figure S4 shows quantification also for random controls). When co-culturing HUVEC and hMSC, the capillary-like structures showed diameters of about 20 μm with both 3 M and 0.8 M cells in the LD area, whereas in the microfluidic chip the average vessel diameter decreased from 17.5 μm to 10 μm when decreasing cell concentration (figure 4(h)).
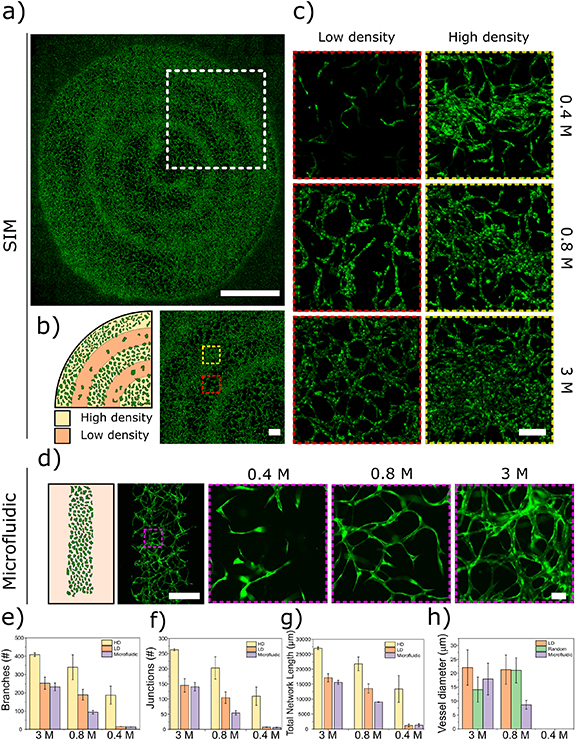
Figure 4. Spatially and multi-scale organized vascular networks for large scale and more physiologically relevant 3D models. (a) SIM patterned HUVEC:hMSC (10:1) at day 5, scale bar 5000 μm. (b) Schematic of single cell patterning at day 0 showing high density (HD) and low density (LD) areas, scale bar = 750 μm. (c) High magnification of LD and HD area at three different HUVEC:hMSC concentrations (0.4 M, 0.8 M and 3 M), scale bar = 200 μm. (d) Vessel formation in a microfluidic channel using the same HUVEC:hMSC concentrations, scale bars = 500 μm and 50 μm. Comparison of vascular network analysis for HD and LD areas of SIM patterned samples and microfluidics: branches (e), junction (f), total network length (g), and vessel diameter (h). The data are shown as an average of three different areas (1000 μm × 1000 μm) selected within the SIM, microfluidic and random groups; the error bars represent the standard deviation.
Download figure:
Standard image High-resolution imageOur work proved that by employing SIM patterning, vascular networks could still be formed while starting from low cell concentrations (0.4 M). The advantage of SIM over self-assembly alone in generating vascular networks starting from low cell numbers could be of high translational relevance for cell therapy and tissue engineering. Indeed, in cell therapy the shortage of autologous cells, due to issues in harvesting, expansion, manipulation, represents one of the main bottlenecks [29]. Therefore, the use of SIM technology paves the way to novel approaches for clinical applications.
3.3. SIM patterning of spheroids for the creation of vessel-like structures
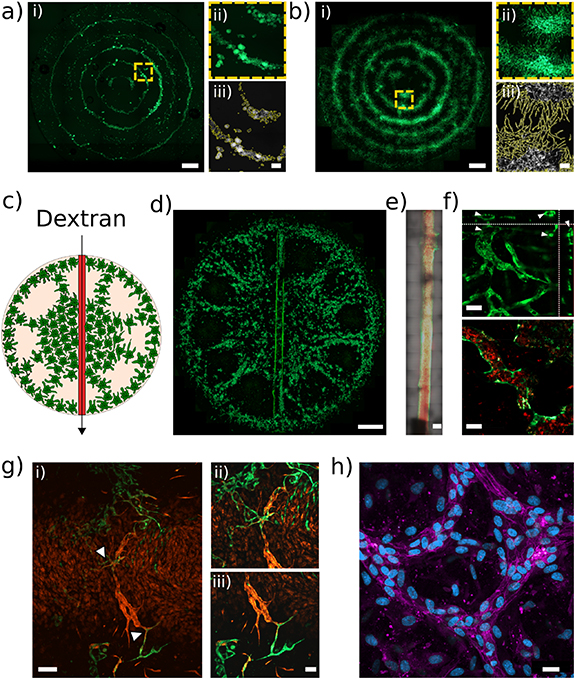
In addition to single cells, SIM can efficiently pattern bigger elements such as cell, as already showed for TCP particles. In the context of vascular network formation, spheroids have been shown to be versatile vascularization units both in vasculogenic and angiogenic approaches thanks to the production of growth factors for the paracrine stimulation of blood vessel development [39]. The sound-induced patterning is therefore a promising approach for 'organoid technology', where organoids are usually originated from epithelial cells and generally lack complex structures such as blood vessels. In this context, it was recently found that hMSC cell-driven contraction is essential for the dynamic condensation of heterotypic cell collectives with improved vascularization potential [40]. With this premise, the SIM technology was employed to pattern spheroids. GFP-HUVEC/hMSC spheroids (cell ratio 1:1) were produced in ultra-low attachment culture dishes (figure S6) and distributed in a regular pattern made of concentric rings by applying a frequency of 80 Hz and low amplitude resulting in a 0.5 g acceleration amplitude (figure 5(a), supplementary video 4). Though here we focused principally on the pattern evolution of endothelial cells, the relative amount of MSC on HUVEC was increased to a 1:1 ratio with the perspective of using such system for regenerative medicine/tissue engineering applications, where MSC can potentially differentiate towards the desired cell type, while HUVEC or other endothelial cells might provide the coupling to angiogenesis which is necessary especially if large constructs are required (as for the case of, but not limited to, bone tissue engineering) [41–43]. HUVEC sprouted from the patterned spheroids in capillary-like structures that, at day 5, fused together with the capillaries sprouted from the spheroids of the adjacent rings (figure 5(b)). As in the case of single cell patterning, the analysis of the area covered by HUVEC increased over time (figure S7(a) and (b)) suggesting a sustained cell growth.
Figure 5. Patterning of GFP-HUVEC/hMSC spheroids (ratio 1:1) at (a) day 0 and (b) day 5, scale bar = 2000 μm; yellow dashed boxes indicate higher magnification areas (a ii and b ii, scale bars = 250 μm); the magnified areas were used to study the sprouting kinetics (a iii and b iii) Perfusion of a multiscale vascular network with injection of Texas red-Dextran in the 800 μm macrovessel: (c) schematic of spheroids patterning at day 0 and (d) pattern evolution at day 5 (scale bar = 2000 μm). (e) Detail of the macrovessel during the injection of dextran, (scale bar = 500 μm). (f) Z projection (top, scale bar = 50 μm) and representative area (bottom, scale bar = 25 μm) of the perfusion of dextran from the main macrovessel to the nearby microvessels developed after the SIM patterning of the HUVEC/hMSC spheroids. (g) i. Interaction between RFP-HUVEC of the macrovessel and the GPF-HUVEC sprouted from the patterned spheroids in a multiscale vascular network (scale bar = 250 μm); arrowheads indicate the area ii and iii, higher magnification images showing the interaction between the cells of the macro- and the microvessels (scale bar = 50 μm). (h) VE-cadherin (magenta) and DAPI (blue) staining of the microvessels, showing the junctions among adjacent cells in the formed vascular network, scale bar = 50 μm.
Download figure:
Standard image High-resolution image
In order to verify the potency of the vessels and capillaries generated with the SIM technology, an endothelialized macrovessel accessible with a syringe needle was embedded into the construct (see schematic in figure 5(c) and experimental pattern in figure 5(d)) for perfusion with a Texas Red-dextran solution. A 3D reconstruction of the macrovessel showed the successful generation of a channel within the fibrin gel, uniformly seeded with HUVEC cells inside (figure S8b and supplementary video 5). As shown in figure 5(e), after perfusion dextran entered the macro-vessel and consequently perfused all the small vessels directly connected to it (figure 5(f) and supplementary video 6). The dextran (red in figures 5(e)–(f)) was clearly visible inside the lumen of the green vessels formed by the HUVEC. The perfusion of the network was confirmed with an ortho-analysis of the microvessels by Z-stack scanning that showed the presence of open lumina typical of a mature and organized structure.
Additionally, the integration between the macro- and the microvessels network, needed to ensure perfusion, was verified by using GFP-HUVEC for spheroid formation and RFP-HUVEC for the macrovessel generation. Figure 5(g) shows how the sprouting from the GFP-HUVEC spheroids connected with the RFP-HUVEC that formed the central macrovessel resulting in a multiscale vascular network. Mosaic confocal images of spheroids patterns that generated multiscale vascular networks are shown in figure S8. These patterns were generated by applying specific amplitude and frequency values.
Finally, in order to confirm the effective maturation of the vessels, an immunohistochemical analysis was performed by labelling the construct for VE-cadherin, a marker that allows to define mature endothelial junctions (figures 5(h) and S9). The expression of VE-cadherin confirmed the tight connection between HUVEC cells in the vascular networks.
4. Conclusions
In this work, we present a mild, fast and easy method for the generation of multiscale organized vascular networks. This technology produces organized vascular networks starting with pre-patterned gradients with a lower absolute number of cells compared to current techniques. For the first time, we show that despite the low initial density, cells with a pre-established local density [20, 40] self-assembly into functional multiscale vascular networks. Overall, these results pave the way to further applications of the SIM technology, such as the development of advanced spatially orchestrated patient-specific microphysiological models for drug screening and its implementation in biofabrication platforms to provide automated tissues fabrication towards clinical translation.
Acknowledgments
This work was supported by the BRIDGE Proof of Concept (178259) Swiss National Science Foundation (SNSF) and the AO Research Institute Davos. The authors would like to thank MimiX Biotherapeutics for donating the SIM device, Kuros Biosciences BV for supplying TCP particles.
Conflict of interest
TS is Chief Scientific Officer of Mimix Biotherapeutics Ltd. which explore the technology in this manuscript.