
Abstract
A 3D fluidic device (3D-FD) is designed and developed with the capability of auto bubble guidance via a helical pathway in a 3D geometry. This assembly is integrated to a multi-electrode array (MEA) to maintain secondary cell lines, primary cells and primary retinal tissue explants of chick embryos for continuous monitoring of the growth and electrophysiology recording. The ability to maintain the retinal tissue explant, extracted from day 14 (E-14) and day 21 (E-21) chick embryos in an integrated 3D-FD MEA for long duration (>100 h) and study the development is demonstrated. The enhanced duration of monitoring offered by this device is due to the controlled laminar flow and the maintenance of a stable microenvironment. The spontaneous electrical activity of the retina, including the spike recordings from the retinal ganglion layer, was monitored over a long duration. Specifically, the spiking activity in embryonic chick retinas of different days (E-14 to 21) is studied, and the presence of light-stimulated firings along with a distinct electroretinogram for E-21 mature retina provides the evidence of a stable microenvironment over a sustained period.
Export citation and abstract BibTeX RIS

Original content from this work may be used under the terms of the Creative Commons Attribution 4.0 license. Any further distribution of this work must maintain attribution to the author(s) and the title of the work, journal citation and DOI.
1. Introduction
Microfluidic technology offers a platform for physiological studies with features superior to current in vitro methods. These features include a controlled cell culture microenvironment mimicking in vivo conditions with attributes of sustained laminar flow, debris elimination and controlled introduction of biochemical agents that is conducive for long-term studies. Microfluidic device (MD)-based cell culture systems are preferred over conventional perfusion chamber-based systems for long-term live cell studies. MDs can be designed to maintain the temperature, pH, osmolarity, gaseous environment and nutrient concentration [1–6]. More specifically, the possibility of obtaining electrophysiological time-series recordings from active cells and tissues at high spatial resolution juxtaposed with microscopy imaging has wide implications for development studies.
An example of a model system for such ex vivo and in vitro studies is the vertebrate retina. Studies of the retina are performed in various modes; as primary dissociated monolayer cultures, secondary cell lines expressing light-sensitive G protein-coupled receptors (GPCRs), retinal explants with and without the retinal pigment epithelium and as a perfused whole eye. Long-term dissociated primary culture of the retina has for a long time been used as an in vitro platform for experimental retinal studies, primarily to study a single type of cell interaction in isolation from its environment. Isolated cell populations such as retinal pigment epithelial cells, cone photoreceptor cells or cell lines such as retinoblastoma are used for these studies [7]. Specific gene manipulation and its effect on the morphology of cell populations and synapses between them are crucial to study cues that affect retinal development [8, 9]. The organotypic culture of the retina, in particular, has advantages as a model system as it maintains the architecture and cellular connections of the tissue in vitro. It therefore serves as an exemplary platform for studies pertaining to development, neurodegeneration, neuroprotection and pharmacological manipulation [10, 11]. Retinal explants have been isolated and cultured since 1933 both as an intact retina culture and as a neuroretinal explant (with only the neural retina) [12]. Most explants are maintained in the floating and rolling configurations. However, maintenance of organotypic culture of the explant is fraught with difficulties due to the soft-fragile nature and the fuel requirement to sustain photoreceptor activity of the mature retina [13, 14]. Significant pyknosis of retinal ganglion cells between 12–24 h of culturing and complete apoptosis within 3–4 d have been reported [15]. The retinas were kept afloat on a rocking platform atop custom-made boats inside a large media reservoir that was agitated with a magnetic stirrer. The importance of the continuous agitation of the media reservoir and its replacement at frequent intervals to maintain high viability of ganglion and amacrine cells were emphasised [14]. Recently, a platform that could study both tissue explants and organoids under the same conditions was presented, to enable translation of therapeutics from animal model studies for retinitis pigmentosa to human organoids derived from human pluripotent stem cells [16]. A system to record from specific subcellular regions of an engineered network architecture of primary cortical cultures for understanding the in vivo physiological environment along with a demonstration of high-throughput manipulation/testing for therapeutics was recently presented [17]. Various in vitro microfluidic platforms have been introduced for tissue engineering studies [18, 19]; however, the integrated microfluidic microelectrode array generally has limitations arising from continuous oxygenation. The formation of bubbles during medium exchange perturbs the microenvironment and the electrophysiology recording of neuronal systems, and is an issue that needs to be addressed [20, 21].
In this context, we introduce a versatile setup for controlled medium exchange to maintain the metabolites without any trace of fluid leakage and bubble formation. The auto-bubble-guidance mechanism incorporated in a custom-made design ensures the complete elimination of bubbles in the vicinity of the targeted area. The separated bubbles are guided along the helical periphery towards the outlet. The efficacy of this setup is demonstrated through long-term recordings of the primary retina explant of chick embryos at different stages of development. The multi-electrode array (MEA)-integrated microfluidic culture system was implemented for studying the development of retina using an MEA platform for real-time data acquisition. The presence of distinct characteristics such as light-induced electroretinogram (ERG) accompanied by the firing of stimulated retinal ganglion cells (RGCs) along with spontaneous electrical activities provide an unambiguous tracking signature during the long-term recordings. The results of these studies are consistent with previous studies of the developing chick retina and offer additional insights. To the best of our knowledge, no long-term studies of chick retina explants using a microfluidic system or indeed any studies on retina explants along with electric field recordings have been previously conducted outside the incubator and under ambient conditions.
The chick embryo retina is known to develop gradually, and the displacement and growth of the ganglion cells have been monitored previously. The chick embryo also offers a sizeable retina during the early developmental stages. The onset of RG differentiation and the associated mechanisms and structures which develop into the final mature structure have been well documented [22]. Further, the cone-rich retina of the chick has also been used as a model for the developmental aspects of pattern formation for all photoreceptor subtypes. The embryonic chick retina has been reported to exhibit marked differences in the distribution of rods and cones, as well as cone subtypes, which define specialised regions similar to those found in other species [22, 23]. The 3D fluidic device (3D-FD) platform can be utilised to explore and verify some of these features observed in retina development. From the translation point of view, the embryonic chick retina in the early stage of development where photoreceptors are not functional has been used as a suitable model system in our laboratory to demonstrate the utility of an extrinsic photoactive soft material layer for retinal stimulation. The 3D-FD platform is useful for studying and identifying mechanisms and pathways in the vision system with artificial retina prosthetic elements [24–26].
The key highlights of the 3D-FD presented in this paper are the following: incorporation of auto-bubble-guidance geometry, uninterrupted live long-term electrophysiological recording, compatibility with inverted or upright microscopy for long-term imaging, suitability for measurements with the commonly available MEA [27], and maintenance of the microenvironment for primary explant tissue culture [28]. A variety of adherent and suspended secondary cells were also cultured for different periods of time from several hours to several days. The cell morphology, migration and division of these cells were studied over a long period of time. Though the paper mainly focuses on the results of the studies on the primary explant tissues [29], a brief set of results from studies on secondary cells is also described in the results section. The results of the electrophysiology recordings, light-stimulated activities [30–33] and microscopy imaging of the developing tissues are also discussed. These results open up new avenues to study many problems related to development and long-term issues for controlled drug delivery.
2. Experimental section
2.1. System setup
The novel experimental setup consists of a 3D-FD integrated to a microelectrode array, mounted on an inverted phase contrast microscope (Nikon, Japan) with an in-house-developed perfusion system, a DSLR camera (Canon, Japan), a 60-pin extracellular multichannel recording system (MCS, Germany) and a customised digital light processor projector (DLP Light Crafter 4000, Texas Instruments, USA) light source for stimulation, as shown in figures 1(A) and S1 (available online at stacks.iop.org/BF/12/045019/mmedia). The tissues inside the 3D-FD were connected to the MEA. The tissue images were focussed by a 40X objective lens onto the DSLR camera and the images were captured continuously. All the devices were synchronised to measure neural activity. The 3D-FD-integrated MEA is continuously perfused with buffered medium to avoid bubble formation, which changes the osmolality as the pH drift results in tissue degeneration. In addition, the system allows simultaneous optical and electrical measurements in the 3D-FD.
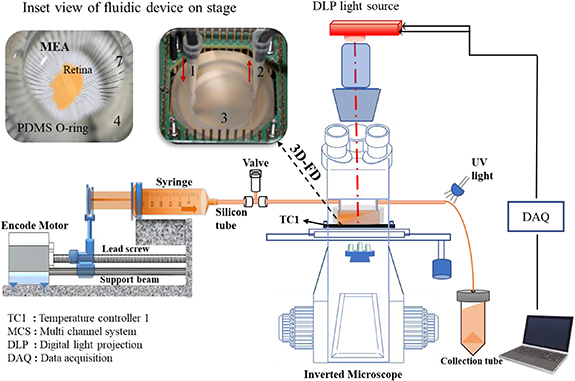
Figure 1. (A) Schematic representation of experimental setup. (B) MEA and PDMS ring with integrated washer, adhered retina slice on MEA. Vertically assembled 3D-FD-integrated MEA with inlet and outlet (red arrows) inside amplifier of electrophysiology setup.
Download figure:
Standard image High-resolution image2.2. Fabrication and assembly of the 3D-FD
The 3D-FD platform (figures 1(A)–(C)) and integrated O-ring washer were custom designed and fabricated. The integrated O-ring washer was fabricated with the standard polydimethylsiloxane (PDMS; Sylgard 184, Dow Chemical, USA) replica moulding technique. The metal moulding templates were made using a brass rod of 40 mm diameter and 8 mm height, and 33 mm outer diameter and 32 mm inner groove for the O-ring washer. The PDMS was degassed to yield bubble-free elastomeric media prior to transfer into the template housing. The metal template with the clear PDMS O-ring was then baked for 3 h at 55 °C. The metal templates were then removed to obtain the complete integrated O-ring washer. The pre-baked O-ring washer was exposed to plasma for 2 min to make it hydrophilic. The O-ring washer was then immediately embedded on top of the MEA using PDMS. The geometry of the bubble guidance assembly was designed in Autodesk Inventor software and fabricated using a five-axis computer numerical control (CNC) machine. The design file was converted into the STEP file format, which is compatible with the CNC machine. An acrylate polymer, which is biocompatible, non-flammable and optically transparent, was used for the fabrication. The 3D-FD used in this study had an oval trajectory within the inner cylindrical extrusion of the device, which served as a bubble guidance rail as shown in figure 1(C). A micro washer groove having 32 mm outer diameter and 30 mm inner diameter with a horizontal V-shaped cut from inner to outer diameter, was designed so that fluid leakage was prevented. The bubble guidance geometry had a 20 mm outer diameter with a 52° angle slope, and a step curved around the slope, which was designed to guide bubbles from inlet to outlet (figure S6). The two polymers PDMS and PMMA (acrylate) used in the 3D-FD had good biocompatibility and enabled gas permeability while ensuring that the system was free from leakages and created a stable microenvironment for tissue or cell culture. The PDMS O-ring integrated washer (figure S6) was an in-house laboratory product and was fabricated using soft lithography techniques. It was then subjected to plasma treatment and bonded onto the MEA, again using the PDMS 1:10 mix (Sylgard 184, Dow Corning). This procedure is well established in the literature [34].
The confined MEA was then coated with a mixture of poly-l-ornithine 0.1 mg ml−1 and laminin 10 µg ml−1 and placed in a standard cell culture incubator (CO2 5%, 37° C, humidity 95%) overnight. The seeded MEA then was carefully placed in a square chamber (40 × 40 × 2 mm) to restrict the cell/tissue culture movements during assembly.
The microfluidic platform (3D-FD) was gradually and carefully press-fitted onto the seeded MEA, with measures to restrict any perturbation and movements. The entire assembly was mounted inside a biosafety cabinet to avoid contaminates as shown in figure 1(C). The assembled microfluidic platform with the MEA was carefully aligned onboard the MCS system for electrophysiology recording as shown in figure 1(A). In summary, the facile integration was enabled by the PDMS O-ring presence between the microfluidic platform and MEAs. The microfluidic platform can be reused multiple times after standard dry sterilisation methods.
2.3. Dissection and tissue alignment
The chick embryos were sacrificed through cervical dislocation. The eyes were enucleated by separating from the central nervous system and were transferred into the cell culture petri dish containing bubbled artificial cerebrospinal fluid (ACSF), with the vitreous humour removed before the neural retina was isolated from the choroid (retinal pigment epithelium). The whole procedure was carried out in ACSF bubbled with carbogen gas (95% oxygen and 5% CO2). The isolated retina was placed into a freshly bubbled carbogen gas solution. Subsequently, the slice was dissected to the appropriate size. By using a polyvinylidene fluoride filter (thickness 100 µm) the tissue was lifted gently onto the photoreceptor side to avoid tissue folding, with the ganglion side placed on top of the laminin matrix present on the subset of the planar MEA procured from MCS Inc., Germany (figure 1(B), retina (yellow)) [35]. The MEA was immediately sealed with the 3D-FD. Before, the 3D-FD was soaked in tetra-enzyme solution to remove the contaminants at room temperature for 24 h and wet-autoclaved at 125 °C for 45 min and inspected for any structural changes of the device. The 3D-FD geometry or internal circular extrusion remained directly on top of the chick retina with a work distance approximately 150–200 µm; this internal fabrication kept the retina intact on the electrode matrix. The assembled device was placed inside a standard CO2 incubator (CO2 5%, 37° C, humidity 95%) for an hour with very low media volume. This process prevents any physiological movements and ensures good contact between the retinal tissue and the electrodes (figure 1(A)) [36]. All the sample preparation protocols followed national and institutional guidelines and were approved by the Animal Ethics Committee and the Institute Bio-Safety Committee at JNCASR.
2.4. Tissue recording and signal analysis
The retina tissue signal was recorded using a commercially available inverted 60 channel MEA filter amplifier with a variable gain and bandwidth (1 Hz to 300 Hz) for recording the field potential and action potentials (300 to 3000 Hz) and a software user interface (MC_rack). The retinal (RGC) side was placed on the electrodes and the activity was continuously recorded at 20 kHz rate, typically for a duration of around 65 min after the dissection. During the acquisition, the temperature was maintained at 37 °C with the aid of an external temperature controller (TC-1, MCS). The raw signals were analysed offline using a high pass filter (cut-off at 200 Hz). The spikes were recorded in the filtered data by allowing a negative threshold of three standard deviations of peak-to-peak noise. Neuroexplorer analysis software was used for representing spike trains in terms of time-stamps.
2.5. Immunofluorescence imaging
The selected tissue slices were fixed with 4% (w/V) paraformaldehyde and preserved in 4% (w/V) sucrose solution upon removal from the culture medium and washed with warm 1X phosphate-buffered saline (PBS). The tissue was permeabilised with 0.2% Triton X-100 in 1X PBS solution for 15 min and the tissue slices were incubated with a blocking buffer (1% goat serum, 3% bovine serum albumin, 1X PBS (Thermo Fisher Scientific, USA)) solution for 4 h. The tissue slices were incubated with primary antibodies overnight at 4° C. The primary antibodies used were anti-visinin (DSHB), XAP-2 (DSHB) and anti-Tau (Thermo Fisher, USA). It was then washed with 1% PBS repeatedly (three times), followed by incubation with a secondary antibody for 2 h at room temperature. The secondary antibody used was goat anti-mouse, alexa-fluor-488. Finally, a mounting solution containing DAPI to stain the nuclei was added to each slice and the sample was covered a glass coverslip. The fluorescence image was acquired using an inverted confocal microscope (LSM 700) with a 40X objective, using ZEN software (Carl Zeiss, Germany) and processed with ImageJ software.
2.5.1. Bubble guidance/removal efficiency
2.5.1.1. Fluid flow and simulation mechanism in the 3D-FD
Figure 2(A) Collection of bubbles during the 96 h experiment: a) incoming bubble (red circle) in inlet tube; b) magnified view of accumulated bubbles (B). Representation of the auto bubble guidance from the inlet towards the outlet in the designated path I. White arrows show inlet and outlets of 3D-MP, and the red dotted circle shows bubble entry through the inlet and bubble formation at the bottom (black arrows). II. The bubble remains in location (red dotted circle) but increases in size upon introducing additional bubbles (at ∼ 45 s); the black arrows indicates the movement trajectory. III. At t ∼ 72 s the bubble size collapses to enter the inlet bottom and exits via the outlet. IV. Complete removal stage of bubbles from the 3D-FD. C. COMSOL simulation model of the flow distribution within the fluid domain to map the velocity and pressure in the 3D-FD. The Navier–Stokes equation with no-slip boundary conditions was used to solve the model. The above figures represent the mesh (I), velocity gradient (flow rate 0.014 m s−1) (II) and pressure gradient (III). The efficacy of the 3D-FD was verified initially using a standard protocol by introducing the medium buffer solution into the flow system and imaging it using a video camera. It was possible to track the bubble guidance trajectory right from the inlet to the outlet of the flow system (figure S2, video SM1). Bubble formation is typically present in perfusion-based MDs as there is a continuous oxygen supply. Bubble accumulation at the inlet eventually results in a deflection to the circular trajectory along the boundary (figures 2(B) I–IV) resulting in a clear media solution which enters via the narrow pore leading to the cell culture device. The guided bubbles are eventually flushed out from the outlet. The flow rates and volume of the media were adjusted and monitored to arrive at an optimum level which is suited for long-term cell culture maintenance [37, 38]. The device design and flow parameters were simulated using COMSOL and the simulation results are presented in figure 2(C).
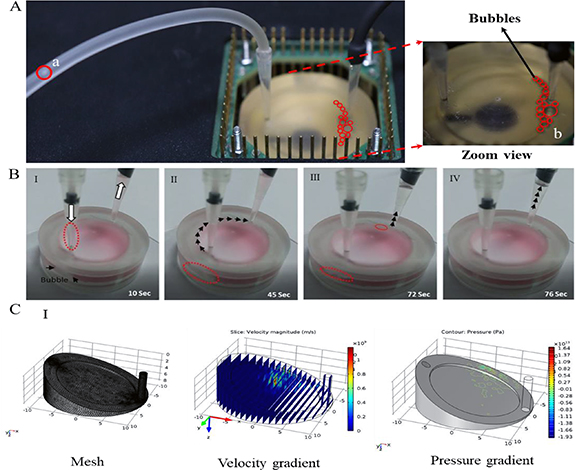
Figure 2. (A) and (B) show the bubble guidance in the 3D-FD for long-term electrophysiology recordings, along with the PDMS container encompassing the culture media and MEA substrate with cells/tissue adhered to it. The geometry enables separation of bubbles in the inlet and provides a pathway to the outlet away from the substrate, thereby preventing rapid changes in the pH and the local microenvironment around the substrates. The substrate offers a choice of any planar surface (in this case MEAs) with appropriate surface treatment. The electrode lead pins on the other side of the MEA are attached to the amplifier stage (not shown). The fluid flow was controlled using the perfusion setup as shown in figure 1(A). The MEA recording of the SHSY5Y in the 3D-FD is benchmarked against the control sample (SHSY5Y) from a standard CO2 incubator as shown in figure 3(C).
Download figure:
Standard image High-resolution image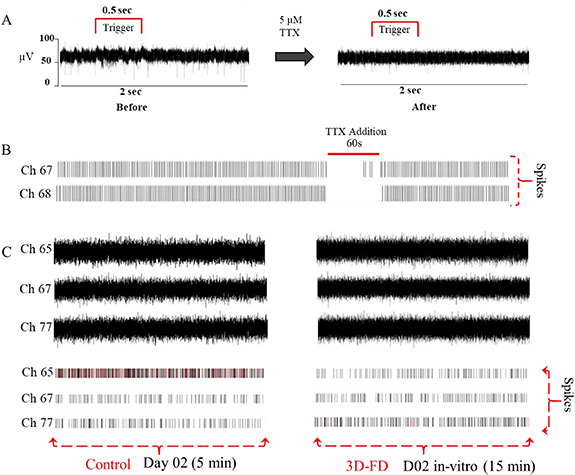
Figure 3. (A) Representative electrode showing a 2 s trace high pass filtered (99 Hz), prior and post-addition of TTX in the presence of a 500 ms green LED stimulus. (B) Raster plot of two representative electrodes for the entire 12 min recording of an E-21 mature chick retina placed ganglion cell down on an MEA with an incident 500 ms green LED pulse at a duty cycle of 10 s. The effect of 1 ml 5 µM TTX perfused into the 3D-FD at a rate of 1 ml per minute and introduced at the seventh minute of the recording resulting in the silencing of RGC spiking and the subsequent restoration of spiking activity after wash-off. (C) shows recording traces from three representative electrodes and their corresponding raster plots. The control (left) consists of an IR-Ti (200/30) MEA with a SHSY5Y culture seeded at a density of 10 000 cells per cm2 2 d ago that was relocated from the incubator and placed on the heating stage of the MCS-MEA 1060 recording amplifier. A 5 min recording was acquired as shown. A 15 min recording trace from the corresponding electrodes in the 3D-FD cultured with SHSY5Y at the same density is shown on the right.
Download figure:
Standard image High-resolution imageThe rate of proliferation and the confluency of secondary SHSY5Y cells typically observed in standard cell culture conditions [39] were reproducible within this device (figure 3(C)). The morphology of the day 3 cells cultured in the 3D-FD were found to be similar to the day 3 cells cultured via standard means (figure S3). The equivalence of the features with in vitro standard cell culture observations and the ability to control and maintain the microenvironment over a long-term is a major attribute of the 3D-FD.
2.5.2. The effect of bubble removal on electrophysiology
The embryonic chick retina is a facile source for electrophysiological signals. The relatively large size of the developing eye offers a versatile model to demonstrate the utility of the 3D-FD. An unambiguous signature of the functioning of a developed retina is the characteristic ERG waveform in the MEA recording [35, 40, 41]. The profile of the light-induced response of the 21-d developed retina consists of contributions from the different layers of the retina, which reflect in different components of the ERG (a, b, c and d waves), and is accompanied by the characteristic spiking of the RGCs. The presence of the light-induced ERG is a clear indicator of the functioning organoid in the in vitro environment and can be taken as a measure of long-term survivability of the explant in the 3D-FD.
The 3D-FD uses a syringe injection method that maintains the in vitro 37° C microenvironment [42–44]. Electrophysiological studies were carried out for retinal explants from chick embryos of stages E-14–E-21. Light-evoked responses of these tissue explants were observed starting from the late E-20 to early E-21 stages of development. The observation of a clear light-induced ERG from this device setup over long duration demonstrates the sensitivity and reliability of the recording.
Figure 4(A) shows the characteristic ERG signal of a mature post-natal day zero/E21 chick retina obtained upon photoexcitation using 532 nm pulses of 0.5 ms duration and a duty cycle of 10 s. The ERG signal feature includes the initial (40 ms post-trigger) local minima corresponding to the 'a' component. This feature is followed by local maxima (peaking at 100 ms post-trigger) signifying the onset of the 'b' wave of the ERG. Then the gradual decrease to the baseline until trigger (light) off corresponds to the 'c' component wave. The off-cycle generates the 'd' wave local maxima. These characteristic a b c d wave components of mature chick retina ERG are well documented. Further, the a b c d wave components of the ERG are accompanied by distinct spiking activity. The distribution of these spikes within the ERG is shown in figure 4(A), with the use of a high pass filter (200 Hz). It was noted that the response to the periodic light pulse is sustained over a long duration, and the continuous recording over 600 s is shown in figure 4(A) (bottom in red). The features of ERG and spike distribution in figure 4(A) (top) at the 0 to 2 s scale were present over the entire long-term range from 0 to 600 s.
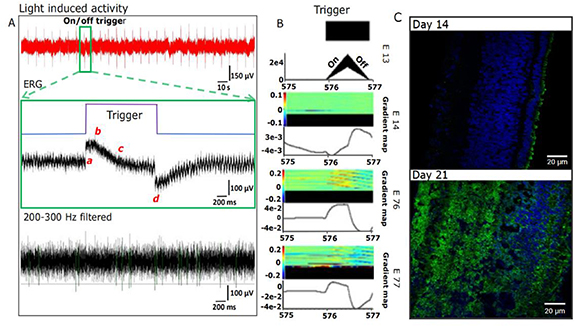
Figure 4. (A) Light response of a mature E-21 chick retina from a representative electrode response to the 500 ms, 532 nm LED pulse. The ERG recorded (0 to 2 s scale) indicates the a, b, c, d components upon filtering using a 200–3000 Hz second-order Butterworth filter. A threshold of 70 µV was used to extract the spikes. The long-term response to this periodic light pulse is shown over the 600 s scale in red. (B) Peri stimulus time histogram of three electrodes (figure S3), revealing three different responses during light stimulus, exhibiting a predominantly OFF response in one region and ON response in two regions. (C) Anti-visinin staining (green) for the cone photoreceptors, indicating staining of the outer retina for mature chick retina E-21, which is not observed for E-14. Note that the DAPI which stains the neuronal nuclei is shown in blue.
Download figure:
Standard image High-resolution imageSpike clusters were extracted from a representative electrode for a 1 s light pulse-evoked response recording of the mature chick retina, and they revealed the presence of at least three different types of responses; namely, the ON response, OFF response and a mixed ON–OFF response. Figure 4(B) represents the post-stimulus time histogram (PSTH) and the colour maps. The PSTH highlights distinct contributions from three different types of neurons (RGC) [45]. The different types of RGCs developed in the E-21 retina have been documented. A complete analysis of all the contributing electrodes should be useful in identifying the different functional types of RGCs. This demonstration also reveals the possibility of using this device to study the emergence and development of different RGC types.
The progression from a blind retina to a mature control retina is monitored by studying its light response and is also corroborated with immunohistochemistry images of the different embryonic stages of the chick retina (figure 4(C)). The absence of mature photoreceptors with developed outer segments (anti-visinin) and the scarcity of axonal innervations (anti-Tau) across the plexiform layers explain the lack of a light response in the E-14 retinas. Long-term recordings of chick embryonic explant tissues from E-14–E-18 were carried out in the 3D-FD, maintaining the ACSF perfusion at an optimum rate [46].
A typical long-term recording result is shown in figure 5(C). The flow rate during the measurement was optimised by comparing recordings of the same tissue (E-14) at different flow rates. A flow rate of 1 ml min−1 was observed to be ideal for recording. Higher rates (up to 10 ml min−1) do not significantly affect the background noise levels. Figure 5(C) depicts an artefact-free recording of a blank MEA (IR-ITO, MCS) perfused with bubbled ACSF at a rate of 1 ml min−1 over a period of more than an hour. Recordings were carried out on the E14 retina in the 3D-FD after a sufficient (30 min) stabilisation period within the perfusion environment.
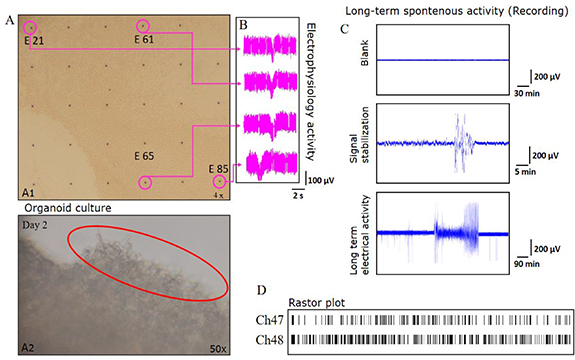
Figure 5. (A) A1, Bright-field images of the retinal tissue on the MEA indicating different electrodes (numbered) after 48 h incubation in 3D-FD of E-18 chick retina cultured in DMEM-based growth medium taken with a 10X objective attached to microscope. A2. Image shows the retinal tissue growth (marked in red circle) kept in the 3D-FD in room temperature (28 °C). (B) Two-second traces of four representative electrodes exhibiting the persistence of retinal waves a day after the explant E-18 was placed in the 3D-FD and maintained at 37 °C. (C) Long-term recording of a E-14 tissue over different timescales. Control recording with just ACSF being perfused is also shown for the same electrode before placement of the retinal explant. (D) 45 min raster plot showing two representative electrodes of a continuous recording of an E-14 retina in carbogen gas bubbled ACSF medium perfused at a rate of 1 ml min−1.
Download figure:
Standard image High-resolution image
The key features of the long-term recording include the burst activity that was observed as retinal waves moving across electrodes approximately every 150 s. A continuous recording from a representative electrode featuring spikes and bursts is shown at two different time scales in figures 5(B) and (C). The activity persists over the entire period of recording and is observed for most of the electrodes of the MEA. The burst activity rate and the intervals between the burst from a typical active electrode were analysed from different electrodes to extract the spatial correlation (supplementary information available).
Besides the functional aspect, the structure and the morphology of the retina can also be monitored over a long duration. The integrity of the live tissue cultured on 3D-FD was validated by the bright-field image of an organotypic culture of an E-18 retina cultured over a duration of 100 h, as shown in figure 5(A). The image captures some neurite growth at the edges of the tissue (figure 5(A2)). It should be noted that the spontaneous electrical activity persisted beyond this 100 h mark. The recording shown in figure 5(B) reveals the spontaneous electrical activity which is exhibited by the propagating signal across four different electrodes. The key features of these observations were reproducible for a variety of explants. Studies involving photoexcitation revealed similar trends and strongly indicated the viability of this approach.
The long-term studies of the 3D-FD are further emphasised by studies involving a concoction of primary cells derived from E-16 chick retina, which include retinal ganglion cells, bipolar cells, amacrine cells, horizontal cells and other components. These cells were seeded on ornithine-laminin-coated MEA and observed over 100 h using an inverted microscopy setup configured for time-lapse imaging and electrophysiological experiments, and the results are provided in figures S4 and S5 and video M2.
3. Discussion
The induction of air/bubbles or the formation of bubbles during perfusion of the medium into the chamber is severely detrimental for cells. The importance of molecular oxygen for the growth and proliferation of cells in culture is well known. Hence, bubbling of O2 and CO2 has been a key factor in deciding the viability of cultures and survivability of explants. Thus, maintaining the concentration of dissolved O2 in the medium and enabling its diffusion to the cells in culture is imperative. A key problem faced in recording and culturing platforms that needs to be addressed is the retention of bubbles in these chambers that affect dissolved O2 concentrations and lead to the accumulation of reactive oxygen species that result in oxidative stress leading to cell death. The 3D-FD provides an elegant solution to this problem with a helical bubble guidance path [47]. The dynamics of bubbles within the MD can be simulated using a volume of fluid method which is geometry-based and works on the principle of conservation of different fluid volumes. Ongoing efforts in this direction to arrive at a computational model for the flow and bubble guidance can be further utilised to justify and optimise the design.
The present design permits seamless switching between different reagents and media, such as that from ACSF (chick) to Ca-free ACSF. The ability to introduce reagents and analytes and capture their effects may find applications in screening and identifying molecules. In the present studies of 3D-FD, a decrease in the firing rate was observed upon introduction of toxins which act as channel blockers at a desired, controlled rate. It was also possible to observe the recovery and the corresponding increase in the signal upon subsequent washing and introduction of appropriate growth media [42, 48].
The provision for simultaneous imaging facilitates the study of the effects of different morphogens, blockers, metabolites and toxins on the growth, morphology and electrical activity of different systems. The functioning of the chick retina [49] which manifests in electrophysiological activity was monitored over 90 min. This duration of measurement should exceed a few hours and opens up the opportunity to conduct recording studies as a function of several experimental parameters on a single explant, thus avoiding studies across a large number of samples and minimising the associated statistical variances. The growth and migration of cells at the periphery of an explanted retinal tissue was also observed using the imaging platform over a period of 48 h. The effect of tetrodotoxin (TTX) on the silencing of spiking activity during an ERG and its wash-off to restore prior activity levels provides a proof of concept of its multifaceted utility to monitor morphology and electrical activity of cell and tissue cultures during development (figure S1).
The 3D-FD is also geared to study substrate effects on the growth and proliferation of different cell populations in cell culture. The possibility of simultaneously imaging provides the growth and morphology trajectory of different cell types [49, 50]; for instance, a finite growth of the tissue from the E-18 retina explant at the periphery can be observed over a 100 h period (figure 5(A2)). The effect of substrates with varying stiffness parameters on stem cell differentiation and secondary cell neuronal type culture is well known [51–53]; specifically, substrate parameters such as adhesive strength, texture and nanotopography, surface wettability and stiffness can be engineered and probed using this setup. Signalling mechanisms involved in the results of light-evoked response of a blind retina on semiconducting polymer substrates [25, 54] can be probed to ascertain the pathways involved in the transduction from systematic long-term studies. We have embarked on extending the utility of 3D-FD by incorporating compact CO2 and O2 containers and transforming it to a complete, portable, standalone assembly.
4. Conclusions
A bubble-free, leakage-proof 3D-FD for long-term measurement of electrophysiology signals of neuronal networks is demonstrated. These were achieved primarily due to the incorporation of an auto-bubble-guidance trajectory in the form of a helical pathway in a system which is integrated to a MEA. The developing retina in different stages extracted from chick embryos is studied using this setup. A clear enhancement by a factor of five in the duration of functioning retina cultured in the 3D-FD is observed. The versatile 3D-FD design may find use in a host of other biomedical applications.
Acknowledgments
We acknowledge support from Ranga Udaykumar, S.V. Diwakar, Suman Banerjee and Manvendra Singh for their helpful discussions and assistance, and Raj Kumar for fabrication support. We acknowledge funding support from the JNCASR-DBT partnership program and JC Bose Fellowship of DST.
Author contribution
AKK designed and implemented the 3D-FD, and recorded and analysed the electrophysiology data; DCS performed the chick retina measurements, confocal imaging and assisted in fluidic-based electrophysiology experiments; SP assisted in setting up the recording, and implemented noise filters, amplifiers and LED drivers; KSN designed and supervised the project, analysed and verified results, and wrote the manuscript.