
Abstract
Therapeutic drug monitoring (TDM) of medications with a narrow therapeutic window is a common clinical practice to minimize toxic effects and maximize clinical outcomes. Routine analyses rely on the quantification of systemic blood concentrations of drugs. Alternative matrices such as exhaled breath are appealing because of their inherent non-invasive nature. This is especially the case for pediatric patients. We have recently showcased the possibility of predicting systemic concentrations of valproic acid (VPA), an anti-seizure medication by real-time breath analysis in two real clinical settings. This approach, however, comes with the limitation of the patients having to physically exhale into the mass spectrometer. This restricts the possibility of sampling from patients not capable or available to exhale into the mass spectrometer located on the hospital premises. In this work, we developed an alternative method to overcome this limitation by collecting the breath samples in customized bags and subsequently analyzing them by secondary electrospray ionization coupled to high-resolution mass spectrometry (SESI-HRMS). A total of n = 40 patients (mean ± SD, 11.5 ± 3.5 y.o.) diagnosed with epilepsy and taking VPA were included in this study. The patients underwent three measurements: (i) serum concentrations of total and free VPA, (ii) real-time breath analysis and (iii) off-line analysis of exhaled breath collected in bags. The agreement between the real-time and the off-line breath analysis methods was evaluated using Lin's concordance correlation coefficient (CCC). CCC was computed for ten mass spectral predictors of VPA concentrations. Lin's CCC was >0.6 for all VPA-associated features, except for two low-signal intensity isotopic peaks. Finally, free and total serum VPA concentrations were predicted by cross validating the off-line data set. Support vector machine algorithms provided the most accurate predictions with a root mean square error of cross validation of 29.0 ± 7.4 mg l−1 and 3.9 ± 1.4 mg l−1 for total and free VPA (mean ± SD), respectively. As a secondary analysis, we explored whether exhaled metabolites previously associated with side-effects and response to medication could be rendered by the off-line analysis method. We found that five features associated with side effects showed a CCC > 0.6, whereas none of the drug response-associated peaks reached this cut-off. We conclude that the clinically relevant free fraction of VPA can be predicted by this combination of off-line breath collection with rapid SESI-HRMS analysis. This opens new possibilities for breath based TDM in clinical settings.
Export citation and abstract BibTeX RIS

Original content from this work may be used under the terms of the Creative Commons Attribution 4.0 license. Any further distribution of this work must maintain attribution to the author(s) and the title of the work, journal citation and DOI.
1. Introduction
Breath analysis holds promise as an attractive tool in a clinical context [1–12]. Therapeutic drug monitoring (TDM) is one of the applications whereby breath analysis has a large impact potential. Current TDM practice mainly relies on the analysis of blood levels of drugs with a narrow therapeutic range. Such a narrow window in addition to large inter-subject variability and analytical fluctuations makes therapeutic management challenging. Blood-based TDM assists clinicians to personalize drug dosage to avoid or minimize unwanted side effects and at the same time maximize clinical effects [13]. Alternative non-invasive matrices like breath are an appealing approach for TDM, especially for the pediatric population. Among the anti-seizure medications (ASMs) requiring TDM, valproic acid (VPA) in particular, has been extensively investigated using breath analysis [14–17].
Within the breath analysis by mass spectrometry (MS) realm, there exist two distinct approaches: Real-time [18–22] and off-line analysis [9, 10, 23–26]. Real-time on the one hand requires subjects to directly exhale into a mass spectrometer, producing as a result an immediate read-out of the abundance of exhaled analytes. Off-line on the other hand, requires subjects to exhale into a gas collection device which, and usually after pretreatment (e.g. chemical derivatization), samples are subjected to mass spectrometric analysis. One main advantage of real-time analyses is that the biochemical information carried in the sample is less likely to be altered as a result of the sample collection, manipulation and analysis process [27]. However, this approach limits the possibility to screen larger populations because some patients (e.g. young children) may simply not be capable of performing a controlled exhalation maneuver. In addition, patients being treated in clinical settings where real-time analysis is not available on site, could not benefit either from such clinical breath tests. Therefore, in this work, we propose a hybrid approach: breath specimens from patients located in a clinical setting are collected off-line by means of an easily inflatable bag, and shortly afterwards the sample is analyzed by a real-time mass spectrometric technique [28–30]. This enables prompt results (i.e. within minutes after sample collection), minimizes the risks of compromising the sample because there are no pre-treatment steps, and at the same time, provides the flexibility of remote sampling. Here, we test this concept in a targeted approach by monitoring the stability of exhaled compounds previously associated with VPA, along with the response and side effects to ASMs [31].
2. Materials and methods
2.1. Real-time and off-line mass spectrometric breath analysis
Real-time measurements were performed as previously described by Singh et al [31]. In short, real-time breath was analyzed by exhaling into a secondary electrospray ionization coupled to high-resolution mass spectrometry (SESI-HRMS). The breath interface consisted of an Exhalion (FIT, Spain) to control the exhalation maneuvers by measuring the flow rate and exhaled CO2, maximizing the reproducibility across individuals, and ensuring capturing the end-tidal fraction. The interface was connected to a SESI source (FIT, Spain) coupled to an HRMS instrument (Q-Exactive Plus, Orbitrap, Thermo Fisher, USA). Subjects provided real-time measurements by providing five-to-six replicate exhalations into the SESI-HRMS instrument. The exhalation volume generally ranged between 0.5 and 2 l per exhalation depending on the lung capacity of the patients. The time spent on the complete real-time analysis lasted typically around 15 min.
The mass spectrometer was operated by using a sheath gas flow rate of 60, auxiliary gas flow rate of 2, spray voltage at 3.5 kV in positive ion mode, the capillary temperature of 275 °C, and S-lens RF level of 55. A nano-spray was created by utilizing 0.1% formic acid in water (Sigma Aldrich), whereby the current ranged between 70 and 120 nA. SESI sampling line temperature was set at 130 °C and the ion source at 90 °C. The MS was operated in full-scan mode ranging from 100 to 400 m/z, which was later extended to 70–1000 m/z. This range was found to provide a good compromise between signal intensity and the need to standardize the mass range across ongoing parallel projects in the same machine (inter-project analysis ongoing). Maximum inject time was set at 500 ms and automatic gain control target value was 106. The mass spectral resolution was set at 140 000 at m/z 200. The mass spectrometer was calibrated weekly and a suitability test (see [32] for details) was performed before every day of measurements.
Offline breath measurements were performed as described previously [33]. In short, a custom-made Nalophan bag was inflated with approximately 2 l of breath (i.e. dead volume + end-tidal fraction) after the online measurement. The bag samples were subsequently manually deflated to produce an 'exhalation' into the mass spectrometer within 30 min of collection. The constant flow towards the ionization source was ensured by a mass flow controller integrated in the SESI source. The analysis time was typically 5 min. The mass spectrometer operated with the same settings and set-up as for the on-line measurements, except for the use of the Exhalion breath interface, which was removed for the deflation of the bags into the SESI-HRMS.
2.2. Safety precautions
Real-time measurements were performed using disposable spirometry mouthpieces incorporating bacterial and virus filter. Off-line collection of breath samples was carried out in single-use Nalophan bags.
2.3. Serum concentrations
Serum concentrations of ASMs were obtained from the clinical chemistry laboratory of University Hospital Basel. The time elapsed between breath and blood collection was 28 ± 21 (mean ± SD) minutes. Total VPA was measured using enzyme-multiplied immunoassay technique (EMIT), where the therapeutic range was 50–100 mg l−1. Free VPA was measured by gas chromatography (GC)-MS, with a therapeutic range of 5–10 mg l−1 . Free VPA required 4.7 ml of blood for analysis, whereas total VPA required 0.5–1 ml. Due to the impracticality of requiring high amounts of blood for free VPA analysis, which is especially cumbersome for younger pediatric patients, only total VPA is often measured to guide TDM. This resulted in fewer data points for free VPA concentrations (n = 16) in comparison with total VPA (n = 31).
2.4. Study participants
In total, 40 patients (mean age 11.5 years, range 4.4–19.7 years, 50% male) diagnosed with epilepsy and taking at least VPA as medication were included in the study. For the complete overview of patients, drugs intake and demographics see table S1. Participants provided both an online measurement and offline measurement, with at least one hour of no food intake, abstaining from chewing gum or brushing their teeth prior to the measurement, resulting in 40 pairs of measurement results. Measurements were taken over a course of 4.5 years, ranging from April 2018 till September 2022.
2.5. Ethical statement
The research was conducted in accordance with the principles embodied in the Declaration of Helsinki and in accordance with local statutory requirements. The Ethics Committee of North–western and Central Switzerland (ID 2017-01537 (Breath-TDM) and ID 2020-00778 (EBECA)) approved the study and written informed consent was obtained from all participants (or their parent or legal guardian in the case of children under 16) to participate in the study.
2.6. Data analysis
Data processing and statistical analysis were performed using MATLAB (version R2022a, MathWorks, USA). Raw centroid (intensity cut-off = 102 a.u.) and profile mass spectra were accessed using in-house C# console apps based on Thermo Fisher Scientific's RawFileReader (version 5.0.0.38). Centroid and profile mass spectra were recalibrated using reference peaks with formulae fulfilling the so-called 'seven golden rules' [34] as well as common laboratory contaminants [35], present in at least 50% of the samples with an initial tolerance of at least 5 ppm. The in-house post-calibration algorithm uses a shape-preserving piecewise cubic interpolation to describe the experimental error across the entire m/z range. Outliers of the reference peaks, as assessed with a moving median algorithm, were excluded from the interpolation process. Centroids and profile peaks were subsequently shifted according to this described mass error. The process was iterated three times until achieving mass accuracies below 0.5 ppm across the entire mass range for all spectra evaluated. Histograms of the recalibrated centroids were subsequently binned using a Kernel density function. The bandwidth value controlling the smoothness of the resulting probability density curve was iterated to achieve Gaussian probability density functions of ±1 ppm at full width at half maximum. The recalibrated centroids falling within this window were used to construct the final data matrix of size 40 × 3128 (samples × m/z). In this targeted study, we focused on 33 ions of interest: 10 associated with VPA, 15 with side effects, and 8 with drug response.
2.7. Zero imputation
Centroids below the intensity cut-off (i.e. 102a.u.) were imputed according to the following criteria: 13C and 18O isotopes were calculated and imputed according to their expected natural abundance; Ammonium adducts were imputed by multiplying the corresponding [M + H]+ signal intensity by the mean of all non-zero [M + NH4]+ values; zeros for the remaining features were imputed using regression on order statistics using the log method described in [36]. See table S2 for further details. Data was finally log10-transformed to approach normality.
3. Results and discussion
One main advantage of SESI-HRMS is that it allows for real-time mapping of a broad range of metabolites [32]. However, as with any other real-time technique, the patients must physically access the mass spectrometer, which limits its use. For this reason, we have recently evaluated in a systematic fashion the feasibility of collecting bedside breath samples in bags for subsequent rapid analysis [33]. This study revealed that around 55% of the ∼1200 mass spectral features detected in a typical breath fingerprint can be recovered with an acceptable degree of comparability with the counterpart real-time measurement. In this study, we use the same approach, but target a small subset of exhaled compounds relevant to ASMs.
After pre-processing the raw data, the final data matrix consisted of 80 samples (i.e. 40 pairs of real-time and offline measurements) × 3128 mass spectral features. Figure 1(a) (top) shows a heatmap of the 40 × 3128 submatrix corresponding to the real-time measurements in chronological order. Notably, it shows a consistent signal intensity during the over four years of data collection period. The only exception is the bottom-left blue patch (indicating no detected compounds) in the region 70–100 m/z. This is simply explained by the changing of the settings of the tune file, which was adapted in early 2020, to optimize signal intensity and standardize settings across all projects. Overall, this suggests that the technique and protocols used are suitable to monitor patients over extended periods of time (4.5 years in this case). Figure 1(a) (bottom) shows the equivalent data matrix for the bag-collected breath samples. Visual inspection indicates a consistent picture across the time span of over 4 years for the m/z 70–200 region. In the 200–600 m/z region, there are changes visible over the given time frame which can be attributed to the exchange of the sampling mouthpiece brand introduced in June 2019 [37]. When comparing the real-time and off-line matrices, one can observe an overall lower signal (blueish color) in the off-line matrix. This suggests that, as expected, some signals may be partially depleted during the collection and further analysis process. This is especially evident for heavier species (m/z > 200), which tend to be less volatile than lighter species, and hence more prone to losses during the collection process [38].
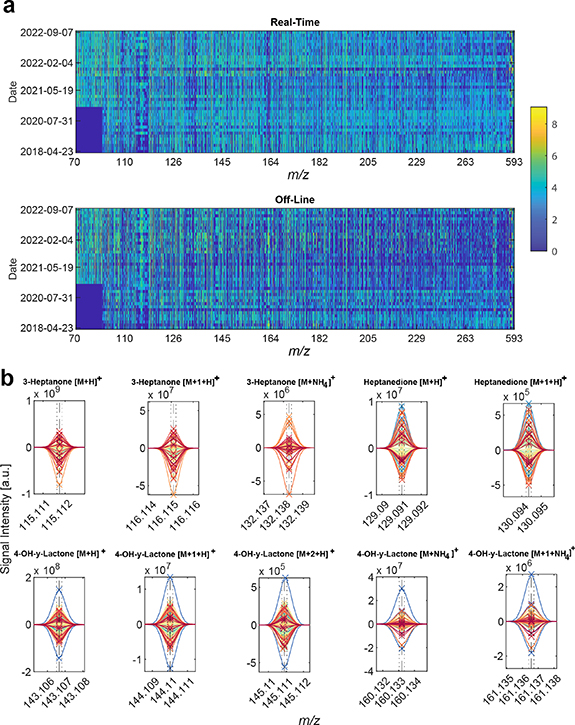
Figure 1. Breath collected in bags provides a similar metabolic signature as its counterpart by real-time analysis | (a) Signal intensities of all observed m/z ranging from April 2018 to September 2022. The color bar represents signal intensity (log 10 transformed). (b) Raw mass spectra from identified biomarkers of VPA, the upper half are real-time measurements, and the lower half are bag off-line measurements. Dotted lines represent +−1 ppm deviation. Dashed line represents theoretical mass. 'x' represents the centroid for each mass spectral feature. Each color represents a unique measurement (in pairs, real-line and off-line).
Download figure:
Standard image High-resolution image3.1. Systemic VPA prediction using breath collected in bags
We have recently shown that a combination of 11 ions detected in exhaled breath by real-time analysis of patients receiving VPA, could be used to predict with high accuracy systemic concentrations of free and total VPA [31]. The 11 mass spectral features were assigned to four unique molecules: VPA itself (detected in negative ion mode) and ten ions associated with three VPA-metabolites (i.e. 3-heptanone [16], 4-OH-γ-lactone [15] and heptanedione). For practical reasons, in this work we focused only on the ten ions detectable in positive ion mode. This clinical study has recently led to an IVD CE-marked breath test (DBI-EPIbreath®, Deep Breath Intelligence AG, Switzerland). In order to generalize the breath test, it would be crucial to be able to capture this information remotely for subsequent off-line analysis, which has been the main motivation of this work. Figure S1 zooms into the regions of interest (i.e. the ten relevant ions detected in positive ion mode) of figure 1(a). Visual inspection of the heatmap reveals a relatively good consistency between the real-time and the off-line matrices. Figure 1(b) provides a more accurate representation by showing the raw mass spectra for the ten ions of interest (after preprocessing pipeline) for all measurements in real-time (upwards spectra) and paired off-line spectra (downwards spectra). Several messages emerge from this plot. Firstly, in the m/z dimension, it shows that the mass spectra are perfectly aligned, and the calibration error is well within 1 ppm even after four years of measurements. In addition, the high resolution (well in excess of 100 000), allows to obtain clearly resolved peaks without isobaric interfering species that might ultimately misrepresent the prediction of systemic concentrations. Finally, in the signal intensity dimension, it shows that the orders of magnitude are similar for both the real-time and off-line measurements. This provides an early indication that this off-line approach may potentially be used to capture the metabolic information carried by these 10 ions. Noteworthy is the patient represented by the blue line in the 4-OH-gamma-Lactone plots (figure 2, bottom row). This specific measurement is subject 'BreathTDM_003-3' (see table S1). The subject was a clinical outlier showing fluctuating behavior in both her total- and free VPA concentrations as well as highly fluctuating 4-OH-gamma-Lactone/3-heptanone ratio in our previously reported real-time study [31]. In addition, the subject fluctuated with side effects, response to medication and EEG (see figures 2 and S11 of [31]). Furthermore, her free VPA was outside the therapeutic range while her total VPA was not in this specific measurement. Taking together all these factors might explain the outlier behavior observed in the mass spectra.
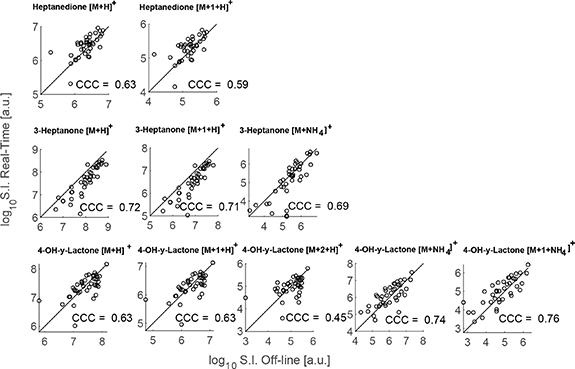
Figure 2. Off-line and the real-time analysis agree to a large extent | Pairs of measurements for all patients for each of the ions associated to VPA metabolites. CCC = concordance correlation coefficient. Identity line (i.e. 45°) added as reference line for visual inspection.
Download figure:
Standard image High-resolution imageHowever, to ensure an accurate prediction, signal intensities between real-time and off-line approaches should correlate at an individual level. The agreement between the real-time and off-line measurements was evaluated using Lin's concordance correlation coefficient (CCC) [39], which is a widely accepted metric to benchmark two methods for the same analytes. Lin's CCC ranges from −1 to +1, representing the latter one a perfect agreement between both methods (i.e. how close the measurement pairs fall to the ideal 45° line). Figure 2 illustrates this concept by representing the signal intensity for all pairs of measurements for all 10 ions and listing the computed CCC for each case. It shows that signal intensities typically expand over 2–3 orders of magnitude across all subjects. We found a CCC ∼0.6 for the two ions corresponding to protonated heptanedione. 3-Heptanone was higher with CCC ∼0.7 for its protonated molecule and its ammonium adduct. Regarding the third metabolite, i.e. 4-OH-y-lactone, the CCC for the protonated species was in the range of 0.6, whereas the agreement was found to be better (CCC ∼0.75) for the ammonium adducts. Table 1 displays a more comprehensive overview of the Lin's CCC statistics, allowing for a more in-depth interpretation. For example, the lowest agreement (CCC = 0.45) was found for the low-abundance M + 2 18O isotope of 4-OH-y-lactone, whereby the two data points with the lowest signal intensity clearly depart from the identity line. A negative location shift of ∼−0.3 was found for the protonated species of heptanedione, indicating a systematic depletion of this molecule during the collection process. In contrast, the protonated ions of 3-heptanone showed a positive location shift of ∼0.65 (i.e. data points tend to fall underneath the identity line). This suggests that, at this particular m/z region, the bags release some overlapping isomeric contaminant that adds to the signal of the VPA metabolite. This effect was less of an issue with the ammonium adduct (i.e. location shift 0.3). In contrast to the other two metabolites, 4-OH-y-lactone shows no dramatic depletion, nor adulteration by interfering species in all five ions (i.e. location shift around 0). All in all, this provides an encouraging early indication that indeed the information for these VPA metabolites could be captured and measured with acceptable fidelity using the proposed method.
Table 1. Lin's CCC statistics (alpha = 0.05) analysis of the agreement between the mass spectrometric read-out between the real-time and the proposed off-line method for all 10 ions associated with three VPA metabolites. +1 denotes 13C and +2 denotes 18O isotopes.
| Molecule | m/z | ppm error | Lins CCC | Confidence interval | Scale shift | Location shift | Bias correction | Pearson Corr. Coeff. |
|---|---|---|---|---|---|---|---|---|
| 3-Heptanone | 115.1118 | −0.0148 | 0.72 | [0.57,0.82] | 0.87 | 0.65 | 0.82 | 0.88 |
| 13C 3-Heptanone | 116.1151 | −0.0560 | 0.71 | [0.57,0.82] | 0.87 | 0.66 | 0.82 | 0.87 |
| NH4 + 3-Heptanone | 132.1383 | −0.0053 | 0.69 | [0.52,0.81] | 0.74 | 0.33 | 0.91 | 0.76 |
| Heptanedione | 129.0910 | 0.0294 | 0.63 | [0.41,0.78] | 0.97 | −0.31 | 0.95 | 0.66 |
| 13C Heptanedione | 130.0944 | −0.0077 | 0.59 | [0.36,0.75] | 0.98 | −0.34 | 0.94 | 0.63 |
| 4-OH-y-Lactone | 143.1066 | 0.0266 | 0.63 | [0.40,0.78] | 1.15 | 0.07 | 0.99 | 0.64 |
| 13C 4-OH-y-Lactone | 144.1099 | −0.0069 | 0.63 | [0.40,0.78] | 1.15 | 0.07 | 0.99 | 0.64 |
| 18O 4-OH-y-Lactone | 145.1108 | 0.0551 | 0.45 | [0.17,0.66] | 1.25 | 0.09 | 0.97 | 0.46 |
| NH4 + 4-OH-y-Lactone | 160.1332 | −0.0331 | 0.74 | [0.56,0.85] | 1.08 | −0.16 | 0.98 | 0.75 |
| 13C NH4 + 4-OH-y-Lactone | 161.1366 | −0.0006 | 0.76 | [0.61,0.86] | 1.15 | −0.25 | 0.96 | 0.79 |
However, the ultimate aim of such remote sampling development would be to enable the prediction of systemic concentrations of VPA. Total VPA and free VPA serum concentrations were predicted by first screening 6 regression models employing a holdout validation strategy. The off-line dataset was split using 20% of the subjects as a test set and the remaining 80% of the subjects as a training set. The process of leaving out a random subset of 20% of the subjects for the test set, training the model on the remaining 80% and predicting the VPA concentration on the test set was repeated 1000 times for each model. The models' performance as assessed by the root mean square error of cross validation (RMSECV) and root mean square error of calibration (RMSEC), are listed in table S3 for each of the six models. Support vector machine family of algorithms provided the best results: RMSECV total VPA = 29.0 ± 7.4 mg l−1, RMSEC total VPA = 22.1 ± 1.7 mg l−1, RMSECV free VPA = 3.9 ± 1.4 mg l−1, RMSEC free VPA = 1.0 ± 0.3 mg l−1 (mean ± SD).
3.2. Side-effects and drug response
Along with the ability to detect drug metabolites, our previous study reported that the breath mass spectral fingerprints contained information on a set of endogenous metabolites that were associated with the actual clinical outcome (i.e. side effects and drug response). Whereby several amino acid metabolic pathways were found to be upregulated in patients suffering from side effects, whereas tyrosine metabolism was found to be downregulated in non-responders. During the last phase of this analysis, we investigated to what extent these endogenous compounds were preserved using the proposed off-line method. A total of 27 ions were previously associated with side effects and 10 ions with response to medication. Inclusion criteria for this study included the detection of the mass spectral feature within +/1 ppm of the theoretical mass and the detection of the ion in at least 60% of the patients. Thus, 15 ions for side effects and 8 for drug response fulfilled these criteria and were further evaluated. Figures 3(a) and (b) show the mass spectra for three representative examples of ions associated with side effects and drug response, respectively. The spectra show again a very high mass accuracy and precision for all detected features. Similar to the ions used to predict systemic drug concentrations, the agreement between the off-line and the real-time analyses was evaluated using Lin's CCC. Figures 3(c) and (d) shows the real-time vs off-line scatter plot for the ions shown in figures 3(a) and (b), including the CCC. Profile peaks and pairwise scatter plots of the remaining are shown in figures S2 and S3, respectively. Lin's CCC statistics on all 23 ions are listed in table S4.

Figure 3. Exhaled breath of metabolites associated with drug response and side effects | Profile peaks from selected side-effect (panel (a)) and drug response (panel (b)) -associated exhaled molecules, upper half are real-time measurements and lower half are bag measurements. Dotted lines represent +− 1 ppm deviation. Dashed line represents theoretical mass. 'x' represents identified mass for each measurement. Each unique color is a unique measurement. Comparison between real-time and off-line analysis for selected side-effect (panel (c)) and drug response (panel (d)) associated features. Identity line added as reference for visual aid.
Download figure:
Standard image High-resolution image
We found a large disparity in the quality of the off-line read-out for these 23 ions. Out of 15 detected ions associated with side effects, four were found to have a CCC > 0.6, whereas none of the ions associated with drug response reached this quality threshold. While the complete compound ID of some these metabolites is ongoing [40], this data suggests that perhaps their endogenous nature and physicochemical properties make them less amenable for off-line analysis than the compounds used to predict systemic VPA. Further work will be required to determine whether this partial information will suffice to compute risk estimates for drug response and side effects.
4. Conclusion
In this work, we introduce the technique of remote sampling of exhaled breath and subsequent rapid mass spectrometric analysis of exhaled metabolites in association with the ASM VPA and its clinical effect. We conclude that the proposed method allows for the prediction of systemic concentrations of VPA based on samples collected over a period of four years in a clinical setting. However, this study entails some limitations that should be openly discussed. It must be noted that this study entails a comparison between three different analytical techniques (EMIT vs off-line and GC-MS vs off-line) with differing quantitative abilities in terms of precision, accuracy and sensitivity. Therefore, the extent of the prediction abilities −specially beyond the therapeutic window− should be interpreted with caution. The method is particularly well suited to predict the free fraction, which ultimately has higher clinical relevance. In addition, we conclude that the method allows to capture endogenous compounds previously associated with drug response and side effects just partially. Since this technology can be used bedside in a completely noninvasive manner requiring no relevant cooperation of the patient, it has the potential for a wide clinical use in the context of the personalized treatment of patients with epilepsy. By reaching a wider range of patients, including young children and intellectually impaired individuals, we envision that the proposed method has the potential to enable large-scale screening of an already IVD CE-marked breath test (DBI-EPIbreath®, Deep Breath Intelligence AG, Switzerland) for ASMs TDM.
Acknowledgments
We thank the participants who volunteered to take part in this study and the study nurses' team (Amelia Imolesi, Maya Weber, and Isabel González Novoa) for coordinating and maintaining study documents. Mélina Richard is gratefully acknowledged for her full study coordination. Professor Katharina Rentsch of University Hospital Basel is greatly acknowledged for analyzing the serum samples to determine the concentrations of ASMs. PS received funding from Fondation Botnar (Switzerland) and the Swiss National Science Foundation (PCEGP3_181300). This work is part of the Zurich Exhalomics project under the umbrella of University Medicine Zurich/Hochschulmedizin Zürich.
Data availability statement
The data cannot be made publicly available upon publication because the cost of preparing, depositing and hosting the data would be prohibitive within the terms of this research project. The data that support the findings of this study are available upon reasonable request from the authors.
Conflict of interest
PS is co-founder of Deep Breath Intelligence AG (Switzerland), which develops breath-based diagnostic tools and commercializes DBI-EPIbreath®. KS is consultant for Deep Breath Intelligence AG (Switzerland). All authors except PED are co-inventors of the European patent 20186274.5. The University Children's Hospital Basel is a shareholder of Deep Breath Intelligence AG (Switzerland).
Supplementary data (1.0 MB PDF)