

Abstract
Despite the deployment of low- or zero-emission technologies, achieving emissions reductions in the passenger transportation sector remains challenging. Demand-side mechanisms can be instrumental in reducing environmental impacts of transportation and reconfiguring transportation systems in a way that shifts users away from private car ownership. In this article we look at the Netherlands, Sweden, and the United States to quantify the environmental benefits from such shifts in passenger transportation, considering socio-technological drivers of transportation including well-being, digitalization, shared mobility, and electrification. We establish pathways for each of these countries considering their context. We frame these pathways using the avoid-shift-improve framework which shapes the scenarios that we quantify in our analysis. We use a travel demand model as an input to calculate carbon, energy, and air pollution footprints. We quantify direct emissions considering the characteristics of the private fleet and indirect using multiregional input-output analysis. The results show that target thresholds can be reached under the proposed supply and demand initiatives. For the United States, these actions are more dramatic than for the Netherlands and Sweden due to that country's stronger car dependence. A deep social transformation is needed to make these scenarios possible and enable a shift towards public, active and shared transportation in urban areas.
Export citation and abstract BibTeX RIS

Original content from this work may be used under the terms of the Creative Commons Attribution 4.0 license. Any further distribution of this work must maintain attribution to the author(s) and the title of the work, journal citation and DOI.
1. Introduction
Although moderate energy efficiency improvements have been realized in the transportation sector, global greenhouse gas emissions from this sector have increased from 4.8 to 8.5 Gt CO2eq between 1990 and 2018. Road transportation (including passenger and freight modes) accounted for 73% of these emissions (Lamb et al 2021). Rising emissions from passenger vehicles are driven by an increase in transportation activity and car dependency, and changing characteristics of the passenger vehicle fleet (increasing weight and size of cars) (Dargay et al 2007, Gucwa and Schäfer 2013, McKinnon 2016). These shifts in passenger transportation are also leading to energy depletion and decreased air quality in cities (Mazzi and Dowlatabadi 2007, Xia et al 2015). Since fuel efficiency improvements have not been enough to decrease impacts from transportation, the search for solutions to rising environmental impacts must explore demand-side mechanisms and new ways of providing transportation services.
Both high- and low-income countries around the globe are witnessing growth in car ownership. The United States, one of the countries with highest rates of car ownership in the world, increased its ownership rate by roughly 10%—from 797 to 878 cars per 1000 inhabitants—between 2014 and 2020 alone. In Sweden, this rate went from 470 to 476 cars per 1000 inhabitants in the same period, while in the Netherlands it rose from 420 to 500 (European Environmental Agency 2010, CBS 2014, Miljiobarometern 2023). Countries such as China also experience a dramatic growth in car ownership, witnessing increases of 400% between 2009 and 2021 (Statista 2023). These trends and current forecasts for car ownership mean it is urgent that we find transportation alternatives to private car ownership.
Although the electrification of the private fleet promises a decrease in environmental impacts from passenger transportation, research has found that by solely electrifying the passenger fleet environmental targets will not be reached (Helmers and Marx 2012, Marmiroli et al 2018, Ivanova et al 2020, Milovanoff et al 2020, Raugei et al 2021).
We need demand-side mechanisms to support technological progress if we are to successfully transform transportation systems and reduce environmental impacts from passenger vehicles. Such demand-side strategies require an understanding of demand patterns in specific contexts: for example, encouraging changes in lifestyles and travel behavior, transformations of housing patterns, and support for teleworking (Creutzig et al 2018, Ivanova et al 2020). In this study we propose and analyze possible pathways to decrease the environmental impacts of passenger transportation in three diverse transport contexts—the Netherlands, the United States, and Sweden (see section 2.4 for details about the selection of the cases). In designing these pathways, we have considered broader societal trends in each context with respect to shared mobility, digitalization, well-being, and electrification. These societal trends together with context characteristics can enable a shift from car dependent societies.
Previous research on reducing environmental impacts from transportation has largely focused on energy efficient technologies and has paid relatively little attention to demand-side mechanisms that can boost this potential (Milovanoff et al 2020). They have also tended to look at energy efficiency through a homogenizing lens, posing one-size-fits-all solutions for different regions of the world (Hawkins et al 2013, Girardi et al 2015, Burchart-Korol et al 2018). Some studies have focused on the potential for specific demand-side mechanisms but have not developed specific scenarios that capture the contextual factors of specific countries (Chen and Kockelman 2016, Amatuni et al 2020, Migliore et al 2020, Yoo et al 2021). This presents a gap in identifying appropriate energy efficiency and demand-side mechanisms at a national level considering contextual characteristics to developing policies that will reduce the environmental impacts of passenger transportation.
Our research addresses this gap. We present a series of analytical tools across the three countries to identify demand- and supply-side means to reduce impacts from passenger transportation considering broader societal trends. We analyze each context in terms of its specific transportation characteristics to identify possible evolutionary pathways for transportation systems over the next decade—a critical timeframe for altering global climate change trends (Hoegh-Guldberg et al 2018). We aim to provide a country-level analysis and quantification of how to reduce carbon, energy use and air pollution footprints through a combination of initiatives driven by shared mobility, digitalization, well-being, and electrification, considering the context characteristics.
2. Methods
We used a case study approach to understand the potential of shared mobility, digitalization, well-being, and electrification in changing the environmental impacts of passenger transportation, in a manner similar to previous research on reducing energy demand (Barrett et al 2022). We first explored the transportation landscape in three different countries, focusing on relevant contextual indicators and residents' travel behavior. We then used travel behavior as an input to calculate baseline travel demand and environmental impacts for the year 2019 (figure 1). Based on this understanding of each country and their possible development pathways, we built scenarios that use shared mobility to complement the transportation system in these countries. Based on these scenarios, we calculated changes in environmental impacts from passenger transportation through 2035 (figure 1).
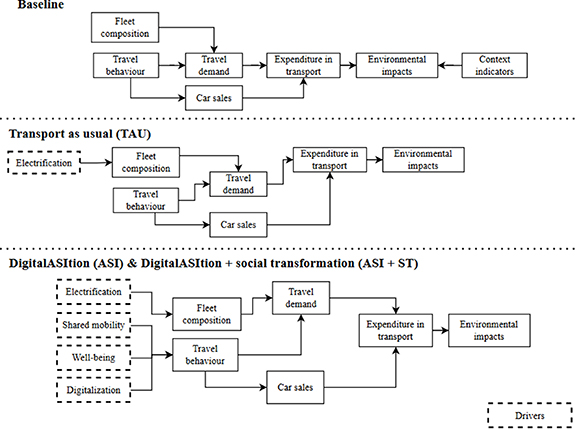
Figure 1. Assessment process for the baseline and different transportation scenarios.
Download figure:
Standard image High-resolution image2.1. Impact assessment
We used travel behavior to determine travel demand, which was then used as an input to calculate the environmental impacts of passenger transportation at the baseline timepoint and in the various scenarios. Travel demand was used as a measure that directly reflects changes in travel due to the use of shared mobility. We quantified environmental impacts using multiregional input-output analysis using EXIOBASE, version 3.8.2 (Stadler et al 2018). The environmental footprint indicators we used include carbon (GWP100), energy use, and air pollution (PM2.5) (Stadler et al 2018).
2.1.1. Travel demand
We quantified travel demand as the number of road kilometers travelled per year by each country's inhabitants, itemized by transportation mode (public transportation, private vehicles, electric bikes, pedal bikes, and walking). We calculated the total kilometers of travel (Tkm) for each country (k) by multiplying the average road distance travelled per year per inhabitant (Dpy) by the total traveling population (PT), using the equation:

Total kilometers of travel per inhabitant can be further disaggregated by transportation mode (i) for each country (k) as follows:

where  corresponds to the modal share of each specific transportation mode.
For every country, we controlled for differences in the private car fleet by distinguishing among electric, internal combustion and hybrid cars. The fuel economy of the passenger fleet together with the fuel type, (differentiating between gasoline and diesel) are also accounted for. Data sources for these calculations are specified in SI5.
2.1.2. Monetary expenditure associated with travel demand
We quantified monetary expenditure on transportation in terms of travel demand and car sales, determining the amount spent on specific products depending on total distance travelled for each of the countries (figure 1). We then used this expenditure to quantify the environmental impacts of passenger transportation with EXIOBASE, which reports environmental intensities per Euro spent. We established an expenditure per kilometer for each transportation mode based on the data available in national statistical databases and EXIOBASE so we could then calculate the total transportation expenditure for each scenario. Expenditure per kilometer are considered stable in all scenarios but vary in each of the countries. For scenarios that included car sharing as part of the transportation system, renting machinery without a driver is used as the best proxy to represent car sharing in EXIOBASE.
2.1.3. Quantification of environmental impacts
We calculated environmental impacts at baseline and in each proposed scenarios in terms of carbon, PM2.5 and energy footprints. The carbon footprint includes CO2, CH4, N2O and SF6 emissions, considering the equivalence factors used by the Intergovernmental Panel on Climate Change (GWP100) (IPCC 2014). For PM2.5 and energy footprints each indicator included PM2.5 emissions and energy carrier respectively.
Our quantification of environmental impacts included both direct impacts from driving such as tailpipe emissions (from internal combustion engine vehicles (ICEV)) and indirect impacts from transportation-related consumption such as vehicle manufacturing, fossil fuel extraction, and electricity production.
Impacts were quantified based on expenditure associated with travel demand (section 2.1.2) which is turned into a final demand by products and converted from purchaser to basic prices. This is used as an input to calculate impacts using EXIOBASE.
The target threshold for carbon footprint from passenger transportation to limit the global warming to 1.5 °C was 0.75 t CO2eq per capita for all countries (van Vuuren et al 2018, Akenji et al 2021). For the other footprints, we defined relative target thresholds compared to each country's impact levels at the baseline 2019. These targets were a 60% reduction in energy use and a 30% reduction in PM2.5 by 2035 (Grubler et al 2018, European Commission 2022) (for more detail about threshold definitions, see SI3).
To verify our results, we generated a benchmark using footprints from EXIOBASE, where the results from transportation are within ranges from previous studies (for more detail, see SI4).
2.2. Limitations
This model did not consider feedback loops between variables, such as how a reduction in car ownership and use could potentially decrease fuel demand, also leading to a drop in fuel prices. Additionally, our model excluded changes in prices both over time and due to potential taxes. Carbon taxes are one mechanism that could be used to accelerate the transition to electrical vehicles powered by clean energy. In order to model car sharing in the input and output tables we use the best proxy product that was available. This might introduce some uncertainty into the results.
2.3. Scenarios
We modeled three scenarios to calculate the environmental impacts of passenger transportation in the case countries (table 1) (for more information about the scenarios, see SI5). Similar to Barrett et al (2022) and Grubler et al (2018), we identified the drivers of the scenarios, including digitalization, shared mobility, well-being, and energy efficiency. Digitalization gives transportation users access to timely information covering all available transportation modes and also enables smart ticketing and online payments. Digitalization enables mobility-as-a-service, where public, private, and shared transportation modes are integrated into a single mobility package that can respond to customer preferences and choices (Leviäkangas 2016, Franssens et al 2021). This improved access to transportation information shapes how citizens choose to travel and this can enable a reduction in environmental impacts (Anagnostopoulou et al 2020). Shared mobility modes complement existing public transportation, enabling people to give up car ownership with the help of access to shared cars for special errands such as furniture purchases. Well-being refers to the benefits from active and public transportation as a motivator for change: e.g., improvements in health, equity, and environmental awareness. Active transportation includes walking and riding a pedal or electric bike. Energy efficiency refers to the shift from pollutant-emitting vehicles to electric ones, as well as a shift to lighter-weight vehicles.
Table 1. Description of the future transportation scenarios.
| Scenario | Description |
|---|---|
| Transportation-as-usual (TAU) | Identifies transportation needs through 2035 and considers the implementation of transportation policies or agreements that the country has enacted as of 2023. Focuses on the electrification of the passenger fleet. Travel habits are assumed to be constant, with an increasing annual travel distance and a forecast for vehicle sales that follows Rietmann et al (2020) (European Environmental Agency 2007, United States Census Bureau 2021) |
| Avoid-shift-improve (ASI) | Considers an availability of car sharing that enables people to change travel habits, reducing travel distance and car ownership rates. Focuses on a more aggressive electrification of the fleet than that the TAU scenario and also considers a shift to more fuel-efficient vehicles. Car sharing influences these changes in different ways depending on the country under study. Our assumptions are based on findings from studies that have assessed how car sharing enables the above-mentioned changes in the same or similar contexts as those we study here (Nijland and van Meerkerk 2017, Bakker et al 2021, Miljiobarometern 2022b) |
| Social transformation (ST) + ASI | Includes increased car sharing, full electrification of the passenger fleet by 2035 and a shift to more fuel-efficient passenger vehicles. In addition, it considers a social transformation consisting of a rapid change in travel habits and the passenger fleet make-up enabled by ambitious policies and societal changes that challenge status quo perceptions about passenger transportation |
Brand et al (2021) developed transportation scenarios using the avoid-shift-improve (ASI) framework that included both travel distance avoided and a shift to lower-emission transportation modes. The scenarios we propose here follow a similar logic and are summarized in table 1.
2.4. Case studies
The United States, the Netherlands, and Sweden were selected as the case countries due to their high car ownership levels and the wide variation among the three in terms of their modal breakdowns, especially in terms of personal car, public, and active transportation (table 2). The transportation landscape is different in these countries: inhabitants of the United States depend on personal cars, as is reflected in the high rate of vehicle ownership and the high annual travel distance per capita. The Netherlands and Sweden have similar rates of car ownership, but the Dutch are relatively greater users of active transportation, while Swedes are relatively greater users of public transportation. Both of these countries have achieved a decrease in car ownership in recent years (Miljiobarometern 2022a) (for more detail about the cases, see SI1).
Table 2. Key features of the personal transportation landscape in in the Netherlands, Sweden, and the United States.
| Netherlands | Sweden | United States | |
|---|---|---|---|
| Annual distance travel per capita (km) | 11 000 | 13 140 | 17 384 |
| Modal split (% of passenger—km) | |||
| Car (as driver and passenger) | 72.8% | 72.1% | 92.0% |
| Public transportation | 12.7% | 20.6% | 5.2% |
| Active transportation | 11.4% | 3.8% | 1.3% |
| Others | 3.0% | 3.5% | 1.5% |
| Average car occupancy | 1.39 | 1.41 | 1.50 |
| Cars per capita | 0.53 | 0.47 | 0.80 |
| Fleet composition by fuel type | |||
| Electric | 2% | 1% | 1% |
| Hybrid | 4% | 5% | 4% |
| Internal Combustion Engine | 94% | 94% | 95% |
a This value represents gasoline, ethanol and natural gas vehicles, with ethanol and natural gas vehicles accounting for 5% of the total.
2.5. Context indicators
We collected indicators that represent the current state of passenger transportation for each case (table 3), which we grouped into well-being, attractiveness of public transportation, digitalization and readiness for electrification of the private fleet (for a detailed description of the indicators, see SI2). Although our selection of these indicators was subjective, together they represent a reasonable assessment of the transportation system in each country and provide a complementary perspective to the environmental assessment of personal mobility at the baseline timepoint (figure 1).
Table 3. Context indicators and their targets.
| Indicator | Metric | Target | |
|---|---|---|---|
| Well-being | Traffic congestion (TOMTOM 2023) | Percentage of prolonged time in traffic | Below 15% (TOMTOM 2023) |
| Road safety for active transportation | Number of pedestrian and cyclist fatalities per million inhabitants | Zero (Trafikverket 1997) | |
| Modal share of active transportation | Active transportation's share of travel distance | ⩾11.3% (Kennisinstituut voor Mobiliteitsbeleid 2021) | |
| Attractiveness of public transportation (shared mobility and well-being) | Satisfaction with public transportation (Sustainable Development Report 2022) | Percentage of the population satisfied with public transportation | ⩾82.6% (Sustainable Development Report 2022) |
| Affordability of public transportation for average-income households | Cost of a one-month public transportation fare pass as a percentage of average household income | Below 10% (Mattioli et al 2017) | |
| Affordability of public transportation for low-income households | Cost of a one-month public transportation fare pass as a percentage of the average low-income household income | Below 10% (Mattioli et al 2017) | |
| Accessibility of public transportation for users in wheelchairs | Percentage of transportation modes that are accessible to users in wheelchairs | 100% | |
| Digitalization | Access to Internet | Percentage of the population that has access to the Internet | 100% |
| Readiness of electrification of private fleet | Electric vehicles in the private fleets | Percentage of electric vehicles in the passenger fleet | ⩾20% |
| Energy from renewables | Percentage of energy that comes from renewables | ⩾98% (Regjeringen 2016) | |
| Availability of public charging stations | Number of electric vehicles per public charging station | 2.4 |
a Each country has a different source. For detail check the SI. b Ideal goal considering the characteristics of the included countries. c Norway was used as a reference to establish the thresholds.
3. Results
3.1. Travel demand
In the TAU scenario, transportation activity continues to rise over time due to rising annual per capital travel distances (figure 2). Most of this distance is travelled by private car, followed by public transportation. The Netherlands has the highest share of active transportation, at 11.4%, while Sweden has 3.8% and the United States has 1.3%. The United States has the highest car ridership (figure 3). In the ASI scenario, total travel distance decreases due to the availability of car sharing, causing a change in the modal split, including a reduction in private car travel and an increase in active, public, and shared transportation use. The magnitude of the modal shift varies in each country, depending on their initial modal distribution (figures 2 and 3). The ASI + ST scenario shows a more drastic decrease in annual travel distance, which drops by 22%, 23%, and 35% for the Netherlands, Sweden, and the United States (figure 2). In all countries, active and public transportation become the dominant modes, taking over 30% of the modal split (figure 3).
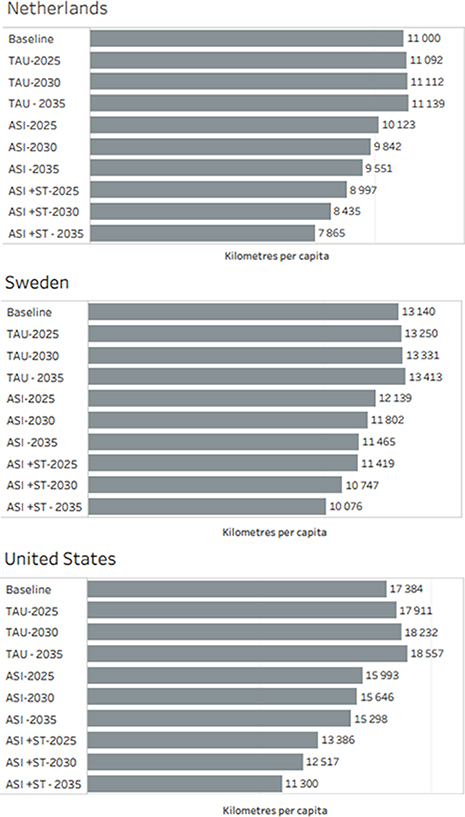
Figure 2. Average annual kilometers travel in the countries in the baseline and all scenarios.
Download figure:
Standard image High-resolution image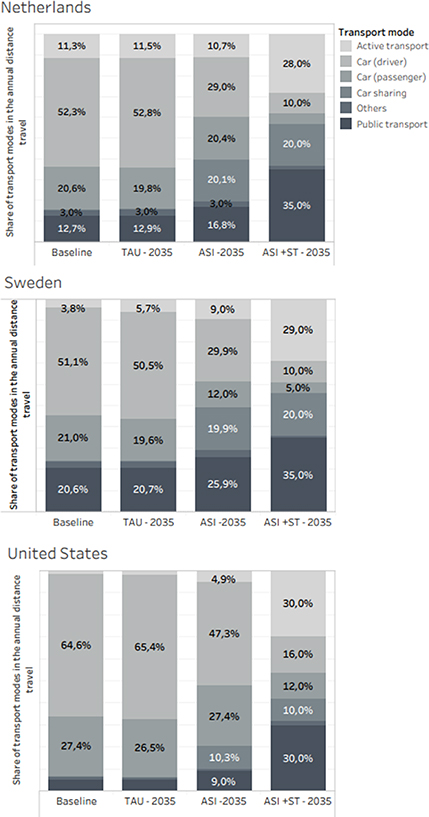
Figure 3. Distribution of kilometers per transportation mode in the countries in the baseline and all scenarios.
Download figure:
Standard image High-resolution imageIn the TAU scenario, the number of cars increases in all countries, reaching 673, 687, and 942 per 1000 inhabitants in 2035 for the Netherlands, Sweden, and the United States, respectively. In the ASI scenario there is a decrease in car ownership: fewer than 500 cars per 1000 inhabitants in the Netherlands and Sweden, and fewer than 690 cars per 1000 inhabitants in the United States. The decrease in car ownership is more radical in the ASI + ST scenario, where the combination of car sharing and lifestyle changes allow the rate to drop to less than 200 cars per 1000 inhabitants in the Netherlands and Sweden, and fewer than 470 in the United States (figure 4).
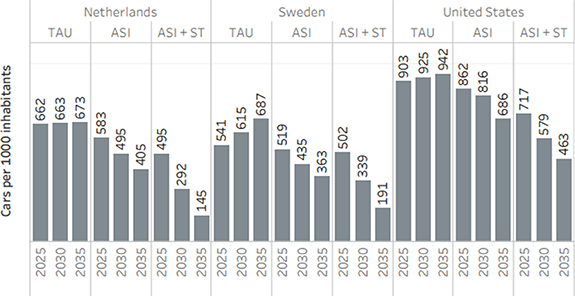
Figure 4. Cars per 1000 inhabitants for each country and scenario.
Download figure:
Standard image High-resolution image3.2. Environmental impacts
Environmental impacts from passenger transportation at the baseline are above the thresholds for all indicators in all countries. The United States generates higher environmental impacts than the other two countries due its higher modal share of private car driving and lower fuel economy of its passenger vehicle fleet. The Netherlands has a higher energy footprint than Sweden, as well as a slightly higher PM2.5 footprint, given the characteristics of its fleet (figure 5).
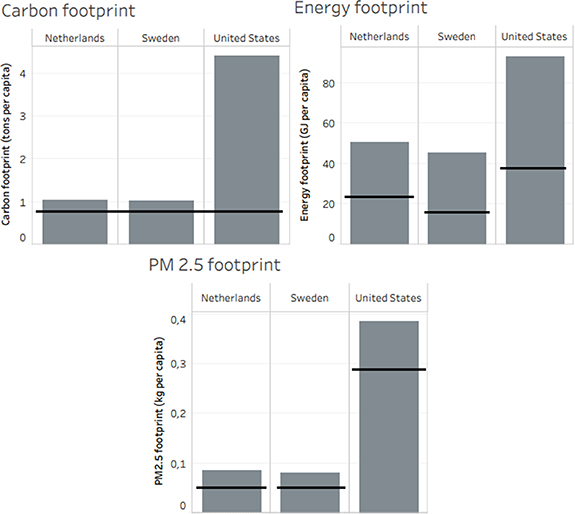
Figure 5. Environmental impacts at the baseline (2019). Thresholds are the targets for 2035. The carbon footprint thresholds correspond to 0.75 t CO2-eq. The energy footprint thresholds represent a relative reduction of 60% with respect to impact levels at the baseline in each country. The PM2.5 thresholds represent a relative reduction of 30% with respect to impacts levels at the baseline in each country.
Download figure:
Standard image High-resolution imageAlthough the TAU scenario shows a decrease over time for all environmental impacts, this decrease is not enough to meet most of the environmental target thresholds. Demand-side mechanisms enable a greater decrease in these impacts, with the potential benefits of the ASI and ASI + ST scenarios varying depending on the strength of demand-side interventions. The ASI scenario shows a moderate decrease in all impact categories due to car sharing. The ASI + ST scenario yields higher saving potentials because it results in a sharp reduction in car use and ownership and an increase in the modal share of active and public transportation, in addition to a reduction in travel distances (figure 6).

Figure 6. Footprints for carbon (a), energy (b) and PM2.5 (c) for all scenarios in all countries.
Download figure:
Standard image High-resolution image
The speed at which environmental impacts achieve the threshold targets varies by country. We found that very strong demand-side-mechanisms would be necessary to achieve target environmental thresholds in the United States. If the United States is to reach these environmental thresholds, drastic actions are needed on both the demand and the supply side. For Sweden and the Netherlands, the moderate demand-side mechanisms included in the ASI scenario were sufficient to achieve the target thresholds by 2035 for most impact categories, since these two countries have already supported substantial developments in active and public transportation and the electrification of their passenger fleets (figure 6).
3.3. Context indicators
Context indicators (introduced in table 1) are part of the support system that enables changes in travel behavior, car ownership, and car purchasing rates when people engage in shared mobility. The results from these indicators are included in table 4. Out of the three countries included in this study, the United States has the highest number of road fatalities per million people and the lowest level of satisfaction with public transportation (United States Department of Transport 2018, Sustainable Development Report 2022). In addition, it has the lowest share of electric vehicles in the fleet and the lowest number of charging stations per electrical vehicle. The United States also has the lowest modal share of active and public transportation coupled with one of the highest car ownerships levels in the world, as well as a high modal share for car ridership. These contextual indicators and travel behavior features contribute to the high environmental impacts from passenger transportation in the United States compared to Sweden and the Netherlands (figure 5). Sweden stands out for its low rate of pedestrian and cyclist fatalities and high satisfaction with public transportation, both of which encourage people to use public transit and active forms of transportation. The Netherlands, for its part, has a widespread culture of cycling.
Table 4. Context indicators from the baseline.
| Goal | Netherlands | Sweden | United States | ||
|---|---|---|---|---|---|
| Well-being | Traffic congestion | Below 15% | 19.5% | 18.2% | 17.0% |
| Road safety for active transportation | Zero | 14.8 | 4.9 | 20.8 | |
| Modal share of active mobility | ⩾11.3% | 11.3% | 2.7% | 1.3% | |
| Attractiveness of public transportation (shared mobility and well-being) | Satisfaction with public transit | ⩾82.6 | 78 | 70 | 60 |
| Affordability of public transit for average-income households | Below 10% | 9.70 | 6.5% | 6.8% | |
| Affordability of public transportation for low-income households | Below 10% | 22.8% | 22.4% | 14.8% | |
| Accessibility of public transportation for a wheelchair users | 100% | 66.7% | 100.0% | 66.7% | |
| Digitalization | Access to the internet | 100% | 97% | 96% | 95% |
| Readiness of electrification of private fleet | Electric vehicles in the private fleet | ⩾20% | 2.2% | 7.2% | 1.0% |
| Energy from renewables | ⩾98% | 6.4% | 41.2% | 12.0% | |
| Availability of public charging stations | 2.4 | 2.7 | 15.1 | 19.5 |
4. Discussion and conclusion
4.1. Feasibility of the scenarios
One of the contributions of this study is in proposing possible pathways for reducing the environmental impacts from passenger transportation through the drivers of shared mobility, digitalization, well-being, and passenger fleet electrification in three countries. The results show that relying on fleet electrification is not enough to reach and stay under carbon and energy target thresholds and improve air quality. The pathways with higher potential for benefits are those that combine the passenger fleet electrification with other supply- and demand-side mechanisms that enable changes in travel behavior and car ownership. Other studies have also found great potential for environmental benefits from combining supply- and demand-side mechanisms (van Vuuren et al 2018, Raugei et al 2021, Barrett et al 2022).
The speed and intensity at which changes in the supply and demand side need to take place to make the scenarios feasible and achieve the target thresholds in time is context dependent (Grubler et al 2018). Examples of such changes are the deployment of electric vehicle charging infrastructure, the building of robust public transportation networks and a shift to active and public transportation modes. Some countries have already started working on implementing some of the actions considered in the scenarios, such as establishing emission-free zones for example in Amsterdam with the Clean Air policy, or offering free public transit as in Luxemburg (Mobilitegratuite 2023).
Digitalization holds one of the main elements in driving change: access to information. Access to transportation information and how it is presented to users influences how they chose to travel (Anagnostopoulou et al 2020, Franssens et al 2021). Research shows that transportation users who receive information about the environmental impacts of transportation modes are likely to change their travel behavior (Franssens et al 2021). Many stakeholders (i.e., shared mobility organizations or city planners) are interested in shaping how people choose to travel, and tensions from differing interests can arise. Digitalization can allow people to have access about location of shared vehicles as well as information about changes in public transit schedule. Digitalization should unfold with the goal of reducing the environmental impacts of passenger transportation and increasing the accessibility and quality of transportation services.
For more transformative scenarios to materialize, we must challenge the structures that support and enable private car dependency (Mattioli et al 2020). These structures include the automotive industry, the built environment, and cultural and societal norms, all of which incentivize pro-car policy and culture (Mattioli et al 2020). These structures are embedded differently in each society, and thus the process of challenging and ultimately breaking them down will be specific for each country.
Differences in the perceived monetary value of car ownership and public and active transportation are barriers to the shift away from car ownership. Car ownership's perceived monetary value is higher than its real cost, because car owners value the convenience and flexibility that this transportation mode offers (Moody et al 2021). Public transportation and shared mobility modes are perceived as having a much lower value than car ownership; thus, a shift away from car ownership will require an increase in the value that people perceive in transportation modes that are alternatives to car ownership (Moody et al 2021).
Cultural perceptions about car ownership and car sharing constitute another barrier to challenging the car regime. Beyond the perceived convenience and flexibility that car owners experience, car ownership is a symbol of status and modernization (Verhoef and van Wee 2000, Gatersleben 2011). A collective abandonment of this symbol supposes a deep cultural transformation and a shift in social norms. People that today are challenging this norm and live a car-free lifestyle do so because they perceive car ownership as a burden (including the economic cost and the time used to take care of the car), are environmentally conscious, and live in a built environment that allows them to live this lifestyle (Paijmans and Pojani 2021, Iacobucci 2022).
A tension between the industries that enable the car regime and the need to transform passenger transportation is one systemic barrier that is present in all societies. Mattioli et al (2020) mentions job creation and economic growth from car manufacturing and the industries that support automotive infrastructure as a barriers to a shift away from the car regime. Regions that rely on car sales for economic growth and jobs may therefore view decreasing car reliance as negative and threatening (de Vries 2022).
Granularity in context indicators can highlight how different population groups or urban areas have specific vulnerabilities or challenges regarding passenger transportation (Martiskainen et al 2021). Such context indicators include access to public transportation stations (a part of transportation poverty), coverage, and availability of public transportation (Sustrans 2012). However, publicly available data on such context indicators is limited, which is an obstacle to truly understanding transportation landscapes at a granular level.
Transport policies that incentives compact cities, robust networks of public and share transportation as well as active transportation infrastructure can enable a decrease in car ownership and use. This in combination with policies that accelerate a transition from fossil-fuel based transportation options to electric and low emission intensity energy sources, are policies that facilitate a decrease in environmental impacts from passenger transportation. Other alternatives to further decrease these impacts are policies that establish car free areas, speed limits and moratorias (Fitzpatrick et al 2022).
Policies in the areas of housing, employment, welfare and credit are relevant to decrease forced car ownership and use (Mattioli 2017). This shows the need to consider synergies between policies that address different areas to maximize their potential and decrease the possibility of t reducing potential environmental and social gains.
Transportation policies need to be equitable and must consider special needs such as disabled users or a lack of other transportation options, such as those of isolated or rural populations. We need transportation policies that decrease car ownership and generates a shift to active, public and shared transportation in urban areas if we are to achieve target environmental thresholds. However, such policies need to be flexible and adaptable to particular cases where people's well-being is dependent on car ownership and ridership (Kett et al 2020, Remillard et al 2022).
Although we found that the target thresholds could be met in the transformative scenarios, these scenarios necessitate radical actions on both the supply and demand sides. From the demand side, changes in travel behavior and lifestyles were required, namely a dramatic decrease in private car use and ownership and increase active, public and shared transportation ridership, decreasing at the same time the annual distance travel. For the supply side, the electrification of the public transportation fleet as well as the provision of robust public transportation networks and infrastructure for active transportation. These actions should come from a variety of actors, including policymakers, industries, and consumers. Alignment and coordination among these actions is key to enabling systemic change. The precise content of change-enabling policies will differ in each country, as will the level of investment needed to implement them.
Acknowledgments
A M A V was founded by the European Research Council (ERC) under the 503 European Union's Horizon 2020 research and innovation programme (Grant Agreement No. 504 771872). D I was funded by the European Union's Horizon 2020 research and innovation program under Marie Sklodowska-Curie Grant Agreement, Grant No. 840454.
Data availability statement
The data that support the findings of this study are available upon reasonable request from the authors.
Conflict of interest
The authors declare no conflict of interest.
Supplementary data (0.6 MB PDF)