

Abstract
Permafrost dynamics can drastically affect vegetation and soil carbon dynamics in northern high latitudes. Vegetation has significant influences on the energy balance of soil surface by impacting the short-wave radiation, long-wave radiation and surface sensible heat flux, affecting soil thermal dynamics, in turn, inducing vegetation shift, affecting carbon cycling. During winter, snow can also significantly impact soil temperature due to its insulative effect. However, these processes have not been fully modeled to date. To quantify the interactions between vegetation, snow, and soil thermal dynamics and their impacts on carbon dynamics over the circumpolar region (45–90° N), we revise a sophisticated ecosystem model to improve simulations of soil temperature profile and their influences on vegetation, ecosystem carbon pools and fluxes. We find that, with warmer soil temperature in winter and cooler soil temperature in summer simulated with the revised model considering vegetation shift and snow effects, the region will release 1.54 Pg C/year to the atmosphere for present-day and 66.77–87.95 Pg C in 2022–2100. The canopy effects due to vegetation shift, however, will get more carbon sequestered into the ecosystem at 1.00 Pg C/year for present day and 36.09–44.32 Pg C/year in 2022–2100. This study highlights the importance to consider the interactions between snow, vegetation shift and soil thermal dynamics in simulating carbon dynamics in the region.
Export citation and abstract BibTeX RIS

Original content from this work may be used under the terms of the Creative Commons Attribution 4.0 license. Any further distribution of this work must maintain attribution to the author(s) and the title of the work, journal citation and DOI.
1. Introduction
The circumpolar region contains large amounts of vegetation and soil carbon, which are estimated to be 1300 Pg carbon with 800 Pg in perennially frozen soils and 500 Pg in non/seasonal permafrost areas (Hugelius et al 2014). This large carbon pool is vulnerable to soil temperature changes, increasing carbon release to the atmosphere (Hayes et al 2014, Johnson et al 2014). Thawing permafrost induces carbon loss to the atmosphere (Romanovsky et al 2015, Euskirchen et al 2017), exerting positive feedbacks to the climate system.
To date, process-based land surface models have been used to quantify the carbon budget in circumpolar regions (Harden et al 2012, Belshe et al 2013, Jiang et al 2016), but with large uncertainties (McGuire et al 2012, 2016, Schuur et al 2013). In previous modeling studies, surface air temperature is often treated as the surface soil temperature to simulate soil thermal regimes (e.g. Sitch et al 2003, Jiang et al 2016), which might have been an important source of the uncertainty.
Circumpolar regions are largely covered by snow. Studies show that there is a rapid warming due to polar amplification resulting from the snow-albedo feedback (Serreze and Francis 2006). Lawrence and Slater (2010) estimates that more than 50% of the thermal regime variations in the arctic can be explained by the snow for the late 20th century. In addition, snow can greatly influence soil thermal dynamics due to its insulative effects (Wang et al 2016, Lyu and Zhuang 2018, Oppen et al 2022), in turn, affecting soil decomposition. Thus, snow dynamics play an important role in the arctic carbon dynamics (Pongracz et al 2021).
Apart from snow, vegetation also has obvious impacts on soil temperature. Boreal forests account for more than one-third of global terrestrial carbon reservoir and cover over half areas of the permafrost region (Helbig et al 2016). Plant canopy can reflect sunshine and reduce the short-wave radiation absorbed by land (Gu et al 1999). The canopy may also influence the near-surface wind velocity and change the sensible heat flux between land and the atmosphere. The canopy can also serve as insulation between soil ground and the air. Observations show that the sub-canopy temperature is 2.1 °C lower than free atmosphere in summer across Europe (Zellweger et al 2020, Haesen et al 2021). Oppen et al (2022) also reveals the importance of the canopy in affecting the soil temperature for arctic tundra. Despite the significant impact from the canopy, this process has not been fully studied in previous soil thermal modeling studies (e.g. Zhuang et al 2001, Jiang et al 2012, 2016). These studies incorporated the canopy influence process, but the influence of dynamical canopy on energy balance has not been explicitly modeled. For instance, when the vegetation shifts, its canopy structure change shall affect the energy balance, which will affect soil surface temperature, in turn, influencing soil thermal dynamics and C cycling. While Krinner et al (2005), Lawrence et al (2011), and Druke et al (2021) incorporated this process, but did not quantify its influences on carbon dynamics. Martín Belda et al (2022) analyzed the canopy's influence on carbon dynamics, but was at site-level comparison with no regional quantification. To date, the interaction between dynamical canopy structure and permafrost as well as snow dynamics and their impacts on carbon dynamics still need to be explicitly modeled.
In this study, we revise the LPJ-STM model (LPJ model coupled with a soil thermal model) (Jiang et al 2016) and improve the performance of simulating soil surface temperature by adding the influences of snow and canopy (Oppen et al 2022). The model is then used to quantify vegetation and soil thermal dynamics and their impacts on the carbon dynamics over the circumpolar region (45° N above). In contrast, the original LPJ-STM model simply uses the surface air temperature as the soil surface temperature to drive soil thermal modeling (Jiang et al 2016). Here we conduct three sets of simulations for historical (1959–2021) period and the 21st century. We analyze the simulations with original LPJ-STM and the revised model for soil thermal dynamics, vegetation dynamics, net primary production (NPP), heterotrophic respiration (RH), net ecosystem production (NEP), soil carbon and vegetation carbon stocks in our simulation periods. We hypothesize that the interactions between vegetation, snow, and permafrost dynamics will significantly affect carbon dynamics in the region.
2. Method
2.1. Model description
The LPJ-STM model (Jiang et al 2016) is developed by incorporating a soil thermal model (STM) (Jiang et al 2012) into the standard LPJ model (Sitch et al 2003, Gerten et al 2004). It has been applied to simulate large-scale vegetation distribution, soil thermal regime and carbon cycling (Jiang et al 2012, 2016). In LPJ-STM, surface air temperature is treated as the surface soil temperature to simulate the soil thermal regime. In this study, we replace this simple scheme by considering the influences of snow and changing plant canopy due to vegetation dynamics on surface soil temperature dynamics. The model is then used to evaluate the impacts of vegetation-permafrost interactions on carbon dynamics in the region.
2.1.1. Snow scheme
Following Lyu and Zhuang (2018), we treat snow thickness and snow thermal conductivity explicitly in a snow-soil continuum. Snow thickness is estimated from precipitation and air temperature (Pongracz et al 2021). We assume that the snow bottom temperature is the same as soil surface temperature, which is calculated as the following when snow exits:
where Tair is surface air temperature, Tsoilbase is soil bottom temperature. r is calculated as:
where Ksoil is soil thermal conductivity (Wm−1K−1), Ksnow is snow thermal conductivity (Wm−1K−1), Zsnow is snow depth (m), and Zsoil is soil column depth (m). More details can be found in Lyu and Zhuang (2018).
2.1.2. Canopy energy balance scheme
Following Gu (1998) and Gu et al (1999), we treat the canopy and the soil as two different layers (figure S1). The energy balance of both canopy and soil surface is modeled as:

where Q is the energy budget, SH is the sensible heat flux between the canopy (soil) and the air, LH is the latent heat flux, SW is the short-wave radiation absorbed by the canopy (soil) and LW is the long-wave radiation of the canopy (soil). The sensible heat flux is calculated based on the temperature and the near-surface wind velocity. The latent heat flux is estimated with the temperature and the soil water content. The short-wave radiation and long wave radiation are estimated with the leaf area index (LAI). More details can be found in the supporting information.
2.2. Input data
In this study, monthly mean surface air temperature, cloudiness, precipitation, number of wet days and atmospheric CO2 concentrations are used to drive the original model. For revised model simulations, in addition to those data used for original model simulation, near-surface wind velocity and relative humidity are also used to drive the revised models. Historical climate data for the period of 1959–2021 are from ERA5 (Hersbach et al 2020). Three climate scenarios from IPCC representative concentration pathways (RCPs): RCP2.6, RCP4.5 and RCP8.5 (Jones et al 2011) are used for the simulations from 2022 to 2100. To eliminate the errors between the ERA5 dataset and RCP datasets, we modify the RCP data based on the monthly climatology from 2006 to 2021. We first calculate the monthly climatology for each grid, then the ratio between the two datasets for each variable. For the temperature, we calculate the difference. Finally, we modify the RCP datasets by multiplying this ratio, but for temperature, plus the difference.
2.3. Simulation protocols
The models are spun-up for 1000 years before 1959 with cyclic climate data from 1959 to 1988 to achieve an equilibrium state. For 1959–2100, the historical data (ERA5, 1959–2021), followed by each scenario (2022–2100), are used to drive the simulation at a spatial resolution of 0.5° × 0.5° (total 25 063 grid cells) for the circumpolar region (45–90° N). Since both snow and canopy can influence the soil surface temperature, we organize three sets of simulations: the original LPJ-STM, the modified model that only contains the scheme of the snow (LPJ-STM-S) and the modified model that contains both the schemes of snow and canopy (LPJ-STM-SC). By comparing these results between LPJ-STM-S and the original LPJ-STM, we can estimate the snow influences on vegetation, permafrost, and carbon dynamics. The differences between LPJ-STM-S and LPJ-STM-SC simulations reveal the impacts of the canopy.
2.4. Model calibration
The model is calibrated using the observed soil temperature from AmeriFlux for 20 sites. Table S1 in supporting information gives the parameters for model improvement. The calibration is conducted with Model-Independent Parameter Estimation (PEST; Doherty 2004, Doherty et al 2022) which is a software using Bayesian method to calibrate the model. It requires iterating the model simulations to find the optimal values for the parameters. Figure 1 shows the results from three selected sites. The LPJ-STM-SC simulated soil surface temperatures agree well with the observations for all the three sites (Amiro 2016, Desai 2022, Ueyama et al 2022) while the air temperatures show relatively large differences to the observations. The RMSEs between the simulated and observed soil surface temperature (RMSE_s) are all much smaller than the RMSEs between the air temperature and the observation (RMSE_a) for all the sites. The seasonal fluctuations get dampened with higher simulated temperature in winter (mainly due to the snow) and lower temperature in summer (mainly due to the canopy). LPJ-STM-SC estimates the soil surface temperature better than LPJ-STM that uses surface air temperature as upper boundary conditions for soil thermal model.

Figure 1. LPJ-STM-SC simulated soil surface temperature (red), observed soil surface temperature (blue) and surface air temperature (black) at three sites: (a) 65 N, 148 W, (b) 56 N, 98.5 W, (c) 46 N, 89.5 W. RMSE_a is the RMSE between air temperature and the observation. RMSE_s is the RMSE between simulated and observed soil surface temperature.
Download figure:
Standard image High-resolution image3. Results
3.1. Changes in soil temperature
Figure 2 shows the differences of the simulated monthly mean soil surface temperature due to snow effects (in January) and canopy effects (in July) for the period of 2001–2010 (historical) and 2091–2100 (RCP2.6, RCP4.5 and RCP8.5). For historical results, we can see that in January (winter), the soil surface temperature is generally much warmer than the air temperature due to the insulation of the snow, especially for the East Europe and Northeast Canada where the warming can be up to 10 °C. During July (summer), the simulated soil surface temperature is consistently lower than the air temperature due to the influences of the canopy, with a magnitude of 0.5 °C–4 °C. For the future, the temperature differences show similar patterns under each warming scenario. The snow's warming effect is still quite obvious except for the West Europe area under RCP8.5 since this region is relatively warmer than other areas (Minobe et al 2008) and has less snow cover.
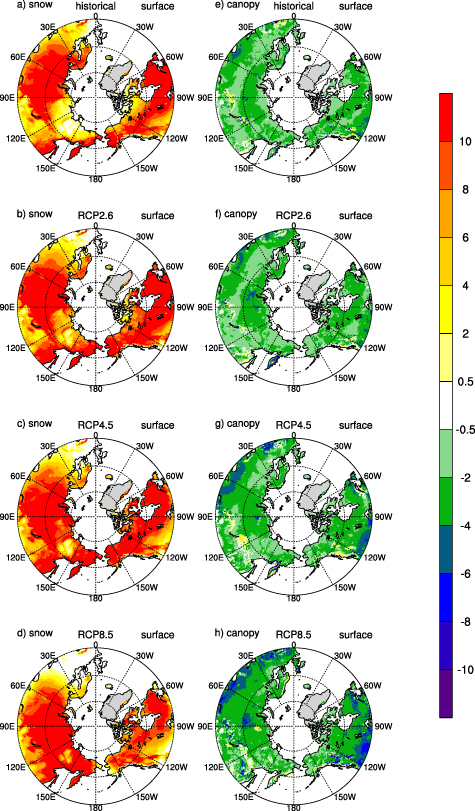
Figure 2. Differences of simulated soil surface temperature (units: K) due to snow in winter (left column) and canopy in summer (right column) during the 2000s (historical) and the 2090s (RCP2.6, RCP4.5 and RCP8.5).
Download figure:
Standard image High-resolution imageDeep soil (20 cm) temperature differences exhibit similar patterns to the soil surface (figure S2) with warming effect of the snow in winter and cooling effect of the canopy in summer for the 2000s. The magnitude of the changes is lower since the deep soil is less impacted by the air and land surface processes.
3.2. Vegetation dynamics
LPJ-STM simulates vegetation dynamics based on the growth, competition and disturbances. Hence, we can assess the influences of the soil temperature change on vegetation distribution. In this study, we examined six plant function types (PFTs) for the circumpolar region (table S1). Here, we compare the differences of three dominant PFTs. LPJ-STM-S estimates less boreal needle-leaf evergreen tree (BNE) and more boreal broad-leaf summer-green tree (BBS) and C3 grass (figures 3(a)–(c)) coverage than the original LPJ-STM. The loss of BNE coverage (5.0 × 10⁵ km2 in 2020) is first taken by the grass, then gradually by the BBS (2.3 × 10⁵ km2 in 2020), since the warmer environment due to the snow favors the growth of the deciduous broad-leaf trees. Similarly, the canopy's cooling effect can lead to more BNE (up to 2.5 × 10⁵ km2 during 1990–2000) and less BBS (1.1 × 10⁵ km2 in 2020) coverage (figures 3(d)–(f)). These results demonstrate that the soil thermal regime can directly impact the vegetation distribution, in turn, affect the carbon dynamics.
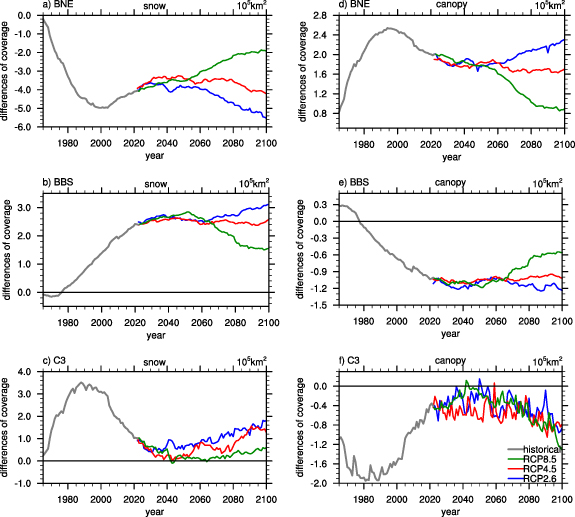
Figure 3. Differences of FPC for each PFT between LPJ-STM-S and LPJ-STM (left) and between LPJ-STM-SC and LPJ-STM-S (right). PFTs are BNE (a) and (d), BBS (b) and (e), C3 (c) and (f). Grey lines are for the historical data, blue, red and green lines are for RCP2.6, RCP4.5 and RCP8.5, respectively.
Download figure:
Standard image High-resolution image3.3. Carbon dynamics
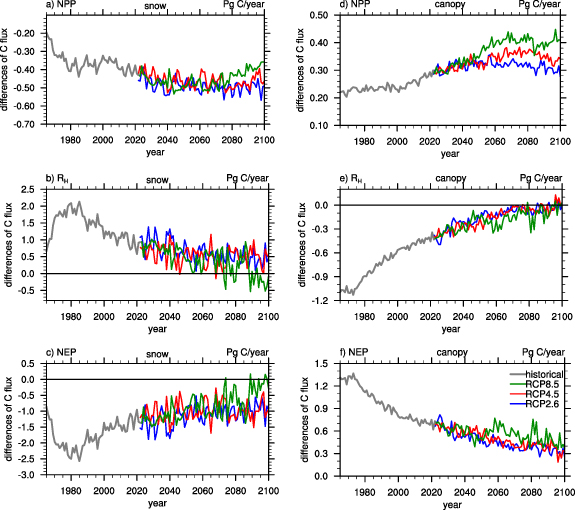
Compared with LPJ-STM, LPJ-STM-S estimates lower present-day NPP (figure 3(a)). Since the snow can significantly increase the winter soil surface temperature, the root respiration will increase when snow exits, resulting in the lower NPP (about −0.33 Pg C/year) (figure 4(a)). Also, the increased soil surface temperature leads to higher RH (figure 4(b)) (about 1.21 Pg C/year). Thus, the NEP estimated by LPJ-STM-S is less than LPJ-STM (about −1.54 Pg C/year), with more carbon released to the atmosphere due to the influences of the snow. LPJ-STM-S also estimates lower vegetation carbon (figure S3(a)) and lower soil carbon (figure S3(b)). The differences get larger with the time goes on and the largest absolute values are about 15 and 45 Pg C (2010–2020), respectively.
Figure 4. Differences of annual mean carbon fluxes between LPJ-STM-S and LPJ-STM (left) and between LPJ-STM-SC and LPJ-STM-S (right). Variables are NPP (a) and (c), RH (b) and (e), NEP (c) and (f). Grey lines are for historical data, blue, red and green lines are for RCP2.6, RCP4.5 and RCP8.5, respectively.
Download figure:
Standard image High-resolution image
Different from the snow effects, LPJ-STM-SC estimates higher NPP (figure 4(d)) than LPJ-STM-S (about 0.24 Pg C/year) since the canopy will decrease the soil surface temperature, especially in summer (figure S3). The lower soil surface temperature will lead to lower soil respiration and higher NPP. Similarly, lower estimated RH (about −0.76 Pg C/year) by LPJ-STM-SC (figure 4(e)) can be found for the period of 1959–2021. In this way, the NEP estimated by LPJ-STM-SC is higher than LPJ-STM-S (about 1.00 Pg C/year) with more carbon sequestered in the ecosystem. The estimated vegetation carbon and soil carbon pools are higher, with peak values of about 8 and 30 Pg C (2010–2020), respectively.
Under warming scenarios, LPJ-STM-S still estimates lower NPP than LPJ-STM and the differences between the two models are generally larger than that in the historical period (about −0.5 Pg C/year). Changes in RH show similar patterns to the historical period but the differences gradually decreased (from 1.0 to 0.5 Pg C/year for RCP2.6 and RCP4.5). Especially, for RCP8.5, the RH differences are around 0 at the end of the century. As the difference of NPP and RH, the NEP estimated by LPJ-STM-S is lower under all the scenarios, indicating the impact of snow will release more carbon into the atmosphere in the future. In addition, the differences between the two models show a trend of decreasing, especially under RCP8.5 where the differences of NEP are close to 0 at the end of the century. Similarly, the differences of vegetation carbon remain negative, but the difference decreases, especially under the RCP8.5 (figure S3(a)). The soil carbon shows a consistent change under scenarios with more and more carbon released from the soil (figure S3(b)).
For the future, LPJ-STM-SC also estimates higher NPP and lower RH than LPJ-STM-S, especially under the RCP8.5. Changes in RH generally becomes weak over time and oscillates around 0 at the end of the century. As a result, the NEP differences are larger than 0 for all the scenarios, suggesting more carbon is sequestered in ecosystems due to the cooling effects of the canopy. LPJ-STM-SC also estimates higher vegetation carbon (figure S3(c)) and higher soil carbon (figure S3(d)) under all the scenarios while the differences of vegetation carbon get smaller from 2020 to 2080. The differences of the soil carbon keep increasing under all the scenarios, indicating there is a constant cooling effect of the canopy.
4. Discussion
Compared with previous modeling studies that have strived to incorporate the influences of the canopy, our study explicitly models the influences of changes in canopy and snow on carbon dynamics (Krinner et al 2005, Lawrence et al 2011, Druke et al, 2021) at regional scales (Martín Belda et al 2022). The changes in the carbon budget are mainly driven by the soil temperature differences. The snow's warming effect can directly increase RH and reduce NPP by increasing the root respiration, which will release more carbon into the atmosphere. The canopy's cooling effect has the opposite impact. These two effects lead to more accurate simulation of soil temperature and carbon dynamics. LPJ-STM-SC estimates NEP of 2.55 Pg year−1 and 838.31 Pg soil carbon stock for present-day. Compare with other studies (table S4), our simulations generally estimate higher NEP and lower soil carbon stocks. These differences are due to various model assumptions.
Despite the improvement in simulations, the LPJ-STM-SC still estimates higher soil surface temperature in summer (figure 1). That means the differences between LPJ-STM-SC and LPJ-STM-S are underestimated and it is highly possible that more carbon might be sequestered in ecosystems than we estimated due to the impact of the canopy. In addition, the latent heat flux is modeled based on Gu et al (1999), which is different from the original LPJ model. This difference might also induce differences in carbon dynamics.
The snow's warming effect is associated with its physical properties such as the depth and the density. In this study, we simply treat the snow as single even layer while the snow usually shows different properties from the top to the bottom (Pongracz et al 2021) especially for the perennial snow cover. Also, to simplify the scheme, we treat the canopy as only one layer and neglect the potential impact from the deep soil, which is another uncertainty source for the simulation (Gu et al 1999). The LPJ-STM-SC estimated winter soil surface temperature also was mostly lower than the observation, which might also underestimate the warming effect of the snow. A more detailed scheme for the influences of snow and canopy is necessary in future research.
Vegetation responds differently under different warming scenarios. Generally, the vegetation coverage differences show the largest values under RCP2.6 and the responses under RCP8.5 are the weakest, especially for the trees (figure 3). Since RCP8.5 is the most extreme warming condition, the forcing from the climate might play a more dominant role in vegetation distribution (Sanchez-Salguero et al 2017) while under RCP2.6 where the warming is relatively mild, the influences of snow and canopy can induce larger uncertainties.
5. Conclusions
This study examines the importance of snow and canopy in affecting soil thermal and vegetation dynamics, in turn, on carbon budget in the circumpolar region (45–90° N). Considering the impacts of vegetation shift, the regional soil temperature is more explicitly simulated with warmer soil in winter and cooler in summer. This change can cause vegetation shift, especially for BNE and BBS. Model simulations show that the snow's warming effect will release more carbon into the atmosphere (1.54 Pg C/year for present-day, 66.77–87.95 Pg C for 2022–2100) while the canopy's cooling effect will lead to more carbon sequestered into ecosystems (1.00 Pg C/year for present-day, 36.09–44.32 Pg C for 2022–2100) under different warming scenarios. Our results highlight the importance of considering the interactions between vegetation and permafrost dynamics in modeling ecosystem carbon dynamics in the arctic.
Acknowledgments
The study was supported by a NASA Project (80NSSC21K1710) to Q. Z.
Data availability statement
The data that support the findings of this study are openly available at the following URL/DOI: https://purr.purdue.edu/publications/4153/1.
Conflict of interest
The authors declare no competing interests.
Author contributions
Q Zhuang developed the conceptual work. Y Xu conducted the analysis and led the writing of the paper.
Supplementary data (0.5 MB PDF)