

Abstract
Oceans are well-known to be directly altered by global climate forcings such as greenhouse gas changes, but how oceans are indirectly influenced by land and its response to such forcings remains less explored. Here, we assess the present-day and projected future state of a little-explored feature of the climate system—a 'land wake' in relative humidity downwind of the east coast of North America, consisting of low-humidity continental air extending roughly 1000 km over the Atlantic ocean. The wake exists throughout the year, but is supported by high continental temperatures in summer and low continental moisture in winter. The wake is well represented in an ensemble of global climate models (GCMs), qualitatively matching reanalysis data. Under increasing atmospheric CO2, the land wake intensifies in GCM simulations through two pathways: the radiative effects of CO2 on surface temperatures, and the biogeochemical effect of CO2 on terrestrial vegetation. Vegetation responses to increased CO2 alter the summer wake from Florida to Newfoundland, and both the radiative and biogeochemical effects of CO2 drive reductions in coastal cloud cover. These changes illustrate the potential of rapidly changing terrestrial climate to influence coastal regions and the ocean environment downwind of continents through both light conditions and the energy balance of the surface ocean.
Export citation and abstract BibTeX RIS

Original content from this work may be used under the terms of the Creative Commons Attribution 4.0 license. Any further distribution of this work must maintain attribution to the author(s) and the title of the work, journal citation and DOI.
1. Introduction
Differences in the surface properties of ocean and land produce large asymmetries in the interaction of these two components of the climate system with the overlying atmosphere. Oceans have a large heat capacity and slow dynamics (Cess and Goldenberg 1981, North et al 1983), which allow years-long variations in sea surface temperature to drive atmospheric circulations that influence climate in remote continental regions (Myneni et al 1966, Yang and Delsole 2012, Perry et al 2017). Land lacks sufficient heat capacity to create such persistent thermal forcings, but continents alter the atmosphere mechanically, e.g. by generating orographic stationary waves that dominate the northern hemisphere circulation in winter (Cook and Held 1992, Held et al 2002, Maroon et al 2015, White et al 2017), and by generating seasonal thermal forcings such as those that drive cross-equatorial monsoon circulations (Li and Yanai 1996, Wu et al 2012, Boos and Kuang 2013). In this study, we quantify and explore the mechanisms governing a little-explored feature of the climate system—a 'land wake' consisting of maritime air that has been perturbed by the passage of prevailing winds over a continent.
We are motivated by the fact that land and ocean influence each other by serving as sources for tracers that are carried by winds. Oceans serve as the primary source of moisture and of pristine, unpolluted air for continents (Parrish and Hahn 1992, Robertson et al 2016). Past studies have examined how continental air masses that are transported over ocean transform the aerosol content of the marine boundary layer (Fuchs et al 2017, Fu et al 2018), influencing cloud properties over ocean (Garrett and Hobbs 1995, Fuchs et al 2017). Seasonal differences in high-latitude cold air outbreaks impact the seasonality of aerosol nucleation (Nilsson et al 2001). Outbreaks of dry and dusty air from the Sahara have been shown to episodically alter the thermal structure and likelihood of tropical cyclogenesis over the Atlantic (Carlson and Prospero 1972). As polar continental air transitions to polar maritime air, its moisture content increases due to ocean evaporation, altering both the temperature and moisture content of the air mass (Burke 1945). Movement of air masses between continental and maritime regions is responsible for numerous weather phenomenon including cold air outbreaks and high-latitude cyclogenesis (Businger and Reed 1989, Pithan et al 2018). The larger diurnal temperature cycle of land drives land-sea breezes (Sonu et al 1973, Gannon 1978, Gille et al 2005).
The fact that source regions, such as continents, can imprint themselves on the thermodynamic state of air motivated Bergeron's widely used air mass classification system (Bergeron 1930) and its modifications, e.g. for the Americas (Willett 1933). Such systems generally classify air as being either continental or maritime in origin, and also polar or tropical in origin, motivated by the recognition that transient extratropical cyclones mix air meridionally (Palmén 1951). Such classification was often qualitative and subjective, but numerical objective approaches have been used (Schwartz 1991, Kalkstein et al 1996) and secular trends in air mass characteristics have been analyzed in some limited regions (Schwartz 1995). Nevertheless, the mechanisms by which land masses alter the seasonal cycle of downwind oceanic air remain poorly quantified, particularly in the midlatitudes where the jet stream is expected to routinely transport continental air eastward over the Atlantic and Pacific ocean basins.
Understanding the influence of land on the climatological mean state of oceanic air is particularly important given ongoing changes in continental states. Changes in the land surface alter the climate both locally and globally (Bathiany et al 2010, Davin et al 2010, Kooperman et al 2017, Laguë et al 2019); large changes in vegetation can drive atmospheric change over both land and ocean regions through atmospheric teleconnections and shifts in atmospheric circulation (Bonan et al 1992, Bonan 2008, Swann et al 2012, Laguë and Swann 2016). In terrestrial regions with strong land-atmosphere coupling, changes in soil moisture and vegetation drive changes in precipitation (Koster et al 2006).
The low heat capacity and relative dryness of land causes land to have a large temperature response to thermal forcings, as evidenced by both the increased variance of land temperature (e.g. seasonally) and the amplified response of land to heating from increased atmospheric CO2 (Sutton et al 2007, Fu and Feng 2014, Hartmann 2016, Chadwick et al 2019). While increased atmospheric CO2 over oceans decreases outgoing longwave radiation there, CO2 increases over land lead to circulation responses which move atmospheric energy from continental to oceanic regions (Shaw and Voigt 2016). Plant responses to CO2, changes in soil moisture, growing season timing and length changes, and changes in snow pack lead to further amplification of continental warming with increased atmospheric CO2 (Campbell et al 2005, Dong et al 2009, IPCC 2022).
Here we ask how land influences the seasonal mean state of oceanic air downwind of a continent, using the particular case of the Atlantic Ocean east of North America; this coastal region is home to numerous large population centers and regions of high marine productivity. We examine this remote influence of land in the present climate and in projections of changes resulting from the distinct impacts of CO2 on atmospheric radiation and on plant physiology.
2. Methods
2.1. The land wake
We define the 'land wake' Wx
of some variable x as the deviation from the zonal mean value of x of air over the ocean (![$[x_{ocean}]$](https://content.cld.iop.org/journals/1748-9326/17/10/104045/revision2/erlac9702ieqn1.gif) ) at a given latitude (equation (1)).
) at a given latitude (equation (1)).

Wx
can be calculated globally or for a single ocean basin, at any atmospheric level. We focus on the near-surface wake averaged from 1000–900 hPa (the precise shape of the wake varies depending on the vertical levels selected), downwind of mid-latitude North America, where ![$[x_\mathrm{ocean}]$](https://content.cld.iop.org/journals/1748-9326/17/10/104045/revision2/erlac9702ieqn2.gif) is averaged longitudinally over the Atlantic ocean, defined here to be the ocean region between 100∘ W–0∘ W and 20∘ N–70∘ N.
is averaged longitudinally over the Atlantic ocean, defined here to be the ocean region between 100∘ W–0∘ W and 20∘ N–70∘ N.  indicates x at that location is smaller than the average oceanic value of x for that latitude, while
  indicates x is larger than the average oceanic value of x for that latitude. In this study, we focus on the wakes of relative humidity (
 ), specific humidity (
 ), and temperature (
 ).
).
2.2. Climate data
We analyse the land wake using a combination of reanalysis data and climate model output. We use the ERA5 reanalysis global dataset at 0.25∘ resolution, which spans from 1979–2019 (Hersbach et al
2020). Specifically, we use the ERA5 variables for: relative humidity ( ), specific humidity (q), temperature (T), and winds (U, V).
We also evaluate the wake in Earth system models under low and high atmospheric CO2 concentrations. Increased atmospheric CO2 has both radiative and biological impacts. These effects are isolated in a pair of experiments from the Coupled Climate-Carbon Cycle Model Intercomparision Project (C4MIP Friedlingstein et al 2006, Jones et al 2016). In '1pctCO2-bgc', only the biogeochemical (bgc) components of the models experience CO2 increasing at 1% per year from pre-industrial values (280 ppm), while the atmosphere experiences constant pre-industrial CO2. In '1pctCO2-rad', only the atmospheric radiation experiences increasing CO2 (at 1% per year), while the biogeochemical components of the model experience fixed pre-industrial CO2. We also consider simulations from the '1pctCO2' experiment from the Coupled Model Intercomparison Project v. 6 (Eyring et al 2016), where both radiation and biogeochemistry experience the increase in CO2. Simulations are run for 140 years, at which point CO2 concentrations reach 4x pre-industrial levels (figure S1). We refer to the increase in CO2 experienced by the biogeochemistry as bgcCO2, the increase in CO2 experienced by the atmospheric radiation as radCO2, and use fullCO2 to refer to simulations where both biogeochemistry and radiation experience increased CO2.
Both the terrestrial and oceanic carbon cycles experience the increase in bgcCO2, but impacts on surface fluxes are only driven by the response of terrestrial vegetation to increased CO2. The bgcCO2 simulations thus provide a clear demonstration of changes in land driving changing conditions over the ocean in the land wake. At higher CO2 concentrations, plants can grow more (CO2 fertilization; Field et al 1995, Sellers et al 1996, Medlyn et al 2001, Morison 2001), altering leaf area and land albedo, in turn leading to changes in surface temperatures and evapotranspiration (Donohue et al 2013, Swann et al 2016, Zarakas et al 2020a). Atmospheric CO2 concentrations directly impact the stomatal conductance of vegetation. In global Earth system models, the equations governing stomatal conductance generate less conductance (thus less evapotranspiration, with all else held equal) with increased atmospheric CO2 concentrations (Ball et al 1987, Medlyn et al 2011), changing plants' water use efficiency (Eamus 1991, Cheng et al 2014).
The effect of the biogoechemical response to increased CO2 could be obtained by considering results from high-low CO2 values in the bgcCO2 simulations, or by subtracting the radCO2 simulation from the fullCO2 simulation. The first gives the effect of increasing bgcCO2 in a low-CO2 climate, while the latter gives the effect of increasing bgcCO2 in a high-CO2 climate; we focus on the first approach in this study, but show that the two methods give generally qualitatively similar responses of the land wake.
We use the nine models participating in C4MIP that provided temperature, specific humidity, and RH data for the 1pctCO2-bgc and 1pctCO2-rad C4MIP experiments and were available for download from the LLNL ESGF node (https://esgf-node.llnl.gov/projects/cmip6/) on 11 August 2021 (table 1). These models were BCC-CSM2-MR, CanESM5, CNRM-ESM2-1, ACCESS-ESM1-5, IPSL-CM6A-LR, MIROC-ES2L, UKESM1-0-LL, MPI-ESM1-2-LR, and CESM2. Cloud cover data was available for all models except CanESM5, so low cloud and downwelling solar radiation are evaluated for the remaining eight models only; snow cover and leaf area changes are shown for all models except CanESM5 and BCC-CESM2-MR as neither model had both variables available. Where possible, the r1i1p1f1 ensemble member was used, otherwise the r1i1p1f2 ensemble member was used; only a single ensemble member per model was considered. All output was re-gridded to a common 1∘ resolution horizontal grid. For each field considered, we took the difference of the average of years 121–140 (high CO2) and subtracted the average of years 1–20 (low CO2).
Table 1. C4MIP model simulations used in this study, with data downloaded from the LLNL ESGF node (https://esgf-node.llnl.gov/projects/cmip6/) on 11 August 2021. Variables used are: downwelling shortwave radiation (rsds), cloud fraction (cl), winds (ua, va), atmospheric temperature (ta), specific humidity (hus), relative humidity (hur), snow amount (snw), and leaf area index (tlai).
| Modeling center | Model name | 1pctCO2-bgc ensemble member | 1pctCO2-rad ensemble member | Variables assessed |
|---|---|---|---|---|
| Beijing Climate Center (BCC) | BCC-CSM2-MR | r1i1p1f1 | r1i1p1f1 | rsds, cl, ua, va, ta, hus, hur |
| Canadian Centre for Climate Modeling and Analysis (CCCma) | CanESM5 | r1i1p1f1 | r1i1p1f1 | ua, va, ta, hus, hur |
| Centre National de Reserches Météorologiques (CNRM-CERFACS) | CNRM-ESM2-1 | r1i1p1f2 | r1i1p1f2 | rsds, cl, ua, va, ta, hus, hur, snw, tlai |
| Commonwealth Scientific and Industrial Research Organization (CSIRO) | ACCESS-ESM1-5 | r1i1p1f1 | r1i1p1f1 | rsds, cl, ua, va, ta, hus, hur, snw, tlai |
| Institut Pierre Simon Laplace (IPSL) | IPSL-CM6A-LR | r1i1p1f1 | r1i1p1f1 | rsds, cl, ua, va, ta, hus, hur |
| Model for Interdisciplinary Research on Climate (MIROC) | MIROC-ES2L | r1i1p1f2 | r1i1p1f2 | rsds, cl, ua, va, ta, hus, hur, snw, tlai |
| Max Planck Institute for Meteorology (MPI-M) | MPI-ESM1-2-LR | r1i1p1f1 | r1i1p1f1 | rsds, cl, ua, va, ta, hus, hur, snw, tlai |
| Met Office Hadley Centre (MOHC) | UKESM1-0-LL | r1i1p1f2 | r1i1p1f2 | rsds, cl, ua, va, ta, hus, hur, snw, tlai |
| National Center for Atmospheric Reserach (NCAR) | CESM2 | r1i1p1f1 | r1i1p1f1 | rsds, cl, ua, va, ta, hus, hur, snw, tlai |
2.3. Wake magnitude
To compare changes in the  wake in the C4MIP simulations with increased bgcCO2 and radCO2, we define the 'magnitude' M of the wake as the area-weighted sum of the spatial footprint of the Atlantic
  wake, in this case, anywhere RH
  , multiplied by the intensity of the wake
  , where
  is how negative
  is at each location:
where φ is the latitude.  is calculated using
  in the domain 25–65∘ N and 105–25∘ W, only where
  is negative.
We take the difference of the average monthly  of years 121–140 (high bgcCO2 and radCO2) minus the average monthly
  of years 1–20 (low bgcCO2 and radCO2) for the 1pctCO2-bgc and 1pctCO2-rad simulations, respectively. We similarly calculate the change in continental
  (averaged over land areas from 1000 to 90 hPa, between 25∘–65∘ N and 125∘–55∘ W) for each month of the year, then take seasonal averages. The wake area changes slightly with increasing bgcCO2 and radCO2 (table S1), but most of the change in the wake magnitude comes from changes within the climatological wake footprint.
2.4. Wake intensity
To evaluate the individual contributions of T and q to the change in  , we define an additional metric, the change in the wake 'intensity' (equation (3)).
  is calculated in the box 25∘–65∘ N and 105∘–25∘ W, only where
  (see figure 3) for each individual model. Within that footprint, a similar approach is used as with the calculation of the magnitude
  , i.e. taking the area-weighted sum of the wake values in that region (but only where the wake changes, i.e. where
  ).
).
To separate the impact of T and q on  ,
,  , and
, and  , we calculate
  in three distinct ways. First, we calculate
  in the standard manner (equation (1)). Second, we calculate what the
  field would be in the high CO2 case if we hold q fixed to the low CO2 value, but increase T to the high CO2 value; we then calculate the wake of that new
  value that only accounts for the change in T. Third, we calculate what the
  field and
  would look like with high CO2 if only q is increased to high CO2, with T held to the low CO2 value.
  can then be calculated within the
  footprint for low CO2 (using
  at low CO2), for
  associated with low CO2
q and high CO2 T, for
associated with low CO2
q and high CO2 T, for  associated with low CO2
T and high CO2 Q, and for
associated with low CO2
T and high CO2 Q, and for  at high CO2. These terms do not add linearly as
  is not a linear function of T and q and we approximate the effect of Δ T and Δ q on
  using monthly mean T and q values. The actual change in
  is qualitatively similar but numerically differs slightly from the change in
  calculated from monthly mean T and q together (not shown).
2.5. Analysis tools and details
From equation (1), changes in the wake Wx
could occur either because of a change in the spatial pattern of x, or because of a change in the zonal mean of x averaged over the Atlantic basin. In the case of increased bgcCO2, the changes in the  wake are driven by spatial changes in
  off the North American east coast, with very little change in the zonal mean value of
  over the Atlantic ocean. This is not surprising, as bgcCO2 primarily impacts surface energy and water fluxes over the continents; this signal is then advected over the ocean and thus is strongest in the wake region, with very little change in the average Atlantic
  at each latitude (figure S2).
Increasing radCO2 has a strong impact on the atmospheric radiative budget and surface temperatures over both land and ocean regions, causing the zonal mean Atlantic values of T and q to increase, but zonally averaged RH over the ocean remains roughly the same (O'Gorman and Muller 2010). Regionally however,  and the
  wake become drier with increasing radCO2 off the North American east coast, as a result of continental warming (figure S3).
Western boundary currents, such as the Gulf Stream, cause a tongue of anomalously warm water extending into cooler waters at higher latitudes along the east coast of mid-latitude continents, releasing heat and moisture to the atmosphere above it. In the context of our definition of the wake, this would raise the overall zonally averaged  , T, and q of the ocean basin. As such, air that is near the coast but has not yet reached the eastern boundary current could look anomalously cold or dry simply because it has not yet come into contact the warmer waters. The C4MIP simulations analyzed here show that the
  , T, and q of the wake region change in response to increased bgcCO2 and radCO2—that is, even if the wake only existed as an artifact of the eastern boundary currents, our analysis still shows the sensitivity of oceanic air in this region to terrestrially-driven changes in continental air. Changes in the location and strength of the Gulf Stream, e.g. with changing climate, could alter both the shape and strength of the continental wake by modifying wind patterns and ocean-atmosphere exchange of heat and moisture. For example, a warmer gulf stream could potentially reduce the continental wake as increased ocean evaporation could more quickly make continental air resemble ocean air.
Analysis was conducted using the Python programming language, heavily leveraging the NumPy (Harris et al 2020) and xarray (Hoyer and Hamman 2017) packages.
3. Results
3.1. The present-day land wake and its causes
In reanalysis data,  downwind of mid-latitude North America is negative in both winter (December–February, DJF) and summer (June–August, JJA), becoming positive as air moves further from shore (figures 1(a) and (b)); that is, air near the continent has a lower RH than air farther from land. The shape of the wake changes with season, but its longest dimension is generally aligned parallel to the time-mean low-level wind with a peak length of at least 1000 km. In winter,
  extends from the northern coast of the Gulf of Mexico along the eastern seaboard of the USA to around 50∘ N, with an additional region of anomalously low
  around Greenland (figure 1(a)). In summer, the wake lies closer to shore along the east coast of the USA, but extends further north along the east coast of Canada and Hudson Bay, while the Greenland wake retreats towards the coast of that land mass (figure 1(b)). Eastward winds off the continent are stronger in winter, and the winter wake correspondingly extends farther from shore between 30∘–45∘ N. In contrast, the summer wake is more intense and occupies a larger fraction of the coastline of North America.
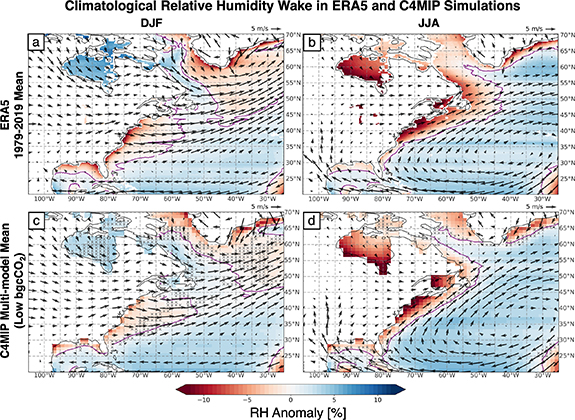
Figure 1. The climatological land wake  averaged from 1000–900 hPa, defined as the deviation from zonal-mean ocean relative humidity at each latitude, for DJF (left) and JJA (right). The wake is shown from ERA5 data averaged from 1979–2019 (top) and from the multi-model mean of the first 20 years of the 1pctCO2-bgc experiment in 9 C4MIP models (bottom). Arrows show climatological wind vectors averaged from 1000–900 hPa. Hatching on (c), (d) indicate regions where less than 7/9 models agree on the sign of the wake. The purple contour indicates the zero line, i.e. the contour of average Atlantic
  for each latitude.
Download figure:
Standard image High-resolution imageWhile the  wake is apparent in both winter and summer, it is driven by different mechanisms seasonally. In winter, cold, dry air flows from the continent over ocean, producing low temperature (T) and low specific humidity (q) offshore (figures 2(a) and (c)). However, because saturation vapor pressure decreases rapidly as temperature drops, the low temperatures in more northern regions prevent anomalously low
  downwind of the continent. The winter wakes in T and q extend along nearly the entire coastline of North America, but their interaction limits the
  wake to latitudes south of Nova Scotia (figure 1(a)). In summer, time-mean winds along eastern North America flow more parallel to the coast due to the summertime anticyclone over the Atlantic (figure 1(b)). At more southern latitudes, q is anomalously positive due to moisture transport from the low-latitude ocean, while at more northern latitudes q is anomalously negative where there is flow off the continent (figure 2(b)). Close to the continent, air is warmer than average ocean air (figure 2(d)); as in winter, the shape of
  results from the strong response of saturation vapor pressure to temperature, yielding low
  along the whole east coast of North America despite anomalously high q south of 40∘ N (figures 1(b) and 2(b)).
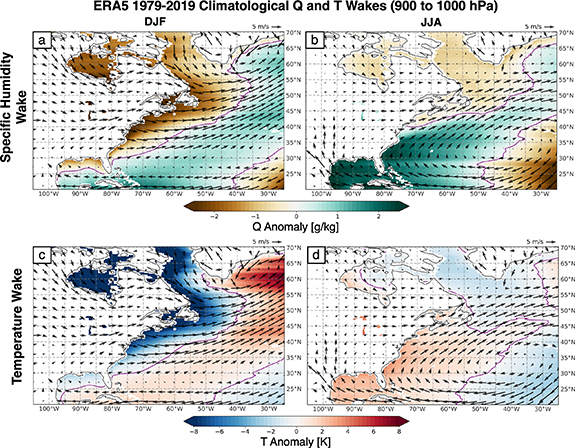
Figure 2. The climatological land wakes WQ (top) and WT (bottom), averaged from 1000–900 hPa, for DJF (left) and JJA (right), for ERA5 data averaged from 1979–2019. Arrows show climatological wind vectors averaged from 1000–900 hPa. The purple contour indicates the zero line, i.e. the contour of average Atlantic q or T for each latitude.
Download figure:
Standard image High-resolution imageMixing between continental and maritime regions produced by shorter timescale motions and vertical circulations is likely also a factor in determining the wake. For example, along the northern coast of the Gulf of Mexico, monthly mean winds are climatologically onshore, yet a distinct band of low RH air hugs the coast. The difference in seasonal drivers of  illustrate the potential for long-term changes to land, such as those caused by agriculture, fire, drought, and rising atmospheric CO2, to impact ocean regions downwind of continents through multiple mechanisms.
3.2. Intensification of the land wake by increased CO2
Temperature increases due to climate change are occurring more quickly over land than over most ocean regions (IPCC 2007), and the existence of the land wake provides a pathway for land's response to climate change to influence ocean regions. Earth System Models (ESMs) participating in C4MIP produce a qualitatively similar  to that seen in reanalysis (cf top and bottom rows of figure 1), with the ERA5 wake having a slightly larger area than the models (table S1).
Increases in bgcCO2 and radCO2 each separately strengthen the land wake (figure 3). The spatially integrated magnitude of the RH wake ( , see section 2) intensifies in response to both increased bgcCO2 and radCO2, with both driving similar magnitudes of change in
  during summer (figures 4(a) and (b)). This intensification of the wake accompanies a large reduction of
  over continental North America during spring, summer, and autumn (figure 4), although the spring and autumn changes are less pronounced in the radCO2 experiment. There is a strong correlation across models (
 ) between the change in
  over North America and the change in the
  wake magnitude associated with increased bgcCO2, and a more modest correlation (
 ) for radCO2. These results support the hypothesis that changes in continental air induced by the radiative and biogeophysical effects of CO2 drive changes in the wake.
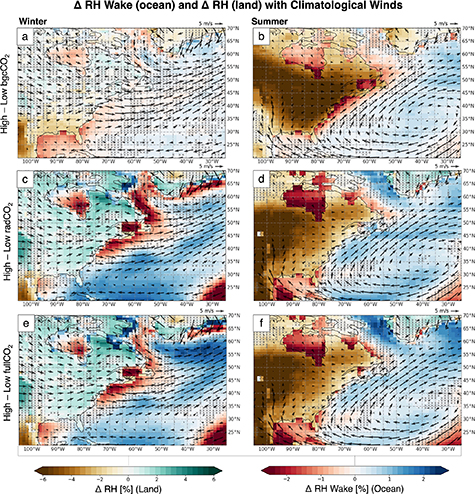
Figure 3. Change (high—low CO2) in the  land wake for the difference of the end-start of the C4MIP simulations where only the carbon cycle sees increased bgcCO2 (top), only radiation sees increased radCO2 (middle), and both bgc and radiation see increased CO2 (bottom) for winter (DJF, left) and summer (JJA, right). Negative values indicate a 'drying' (lower RH) of the wake. Hatching indicates where less than 7/9 models agree on the sign of the response. The change in
  [%] is shown over land, with change in the
  Wake [%] over the ocean. Wake values and continental
  are averaged from the surface to 900 hPa. Vectors show climatological winds averaged from 1000 to 900 hPa.
Download figure:
Standard image High-resolution image
Figure 4. The relationship between the change in continental  and the magnitude (
 footprint × intensity) of the relative humidity wake for high—low CO2 where (a) only bgc, (b) only radiation, and (c) both bgc and radiation experience the ΔCO2, where negative values mean a lower relative humidity. Continental
  is averaged from the surface to 900 hPa over land areas from 25∘ to 65∘ N and 125∘ to 55∘ W. Individual models are each identified with their own marker, while the large circles show the multi-model mean; colors indicate season. The black dashed line shows the line of best fit to all points; the slope and r2 value for all points and the points in each season are noted below each panel. Note the axis ranges differ across panels.
Download figure:
Standard image High-resolution imageWhen radiative and biogeochemical effects of CO2 are both considered (using the fullCO2 simulations), the radCO2 effects are seen to dominate the spatial pattern of change in the wake found in the fullCO2 simulation (figure 3). However, the effects of bgcCO2 contribute substantial changes to the wake magnitude (figure 4(c)). We would not expect the wake changes in the bgcCO2 and radCO2 simulations to sum perfectly linearly to the fullCO2 wake change because the results of the ΔbgcCO2 simulations show the effect of bgcCO2 in a low-CO2 background climate, while the difference between the fullCO2 and radCO2 simulations show the effect of bgcCO2 in a high-CO2 background climate. However, the full−rad wake response is qualitatively similar to the bgcCO2 wake response in most regions, except in the Hudson Bay and Davis Straight areas (figures S4–S6). These differences are not the focus of our study, but we suspect they result from large differences in base-state Arctic climate with low vs. high CO2.
3.3. Biogeophysical effects of CO2 intensify wake through stomatal closure
We now focus on how the response of terrestrial evapotranspiration to increased bgcCO2 impacts the wake. The summer response across the C4MIP simulations to increased bgcCO2 is a widespread reduction in terrestrial evapotranspiration (figure S7). The terrestrial biogeophysical effects of increased CO2 produce a wake that is drier (i.e.  is anomalously low) over the coastal ocean in both summer and winter with increased bgcCO2 (figures 3(a) and (b)). Note that though the RH wake becomes drier, specific humidity in the summer wake actually increases because of circulation changes, discussed below. While the horizontal extent of this change in the wake is smaller in summer, the peak intensity (defined by equation (3)) of this change is larger during that season. Although the definition of W (equation (1)) encompasses the whole Atlantic, the change in
  is primarily the result of changes near North America, with little influence from the zonal-mean change (figures S2, S7; see section 2 for further discussion).
In summer, continental  decreases as a result of reduced continental evapotranspiration driven by the stomatal response to increased bgcCO2, but the influence of these continental changes on the
  wake is more complex than a simple downwind transport of low-
 air. The reduced continental evapotranspiration causes lower continental q as well as higher continental T due to reduced latent cooling of land (see land regions in figures 3(b) and S7((b), (d)). Downwind transport of high-T air over the wake region drives an intensification of the
  wake, but this is partially opposed by an increase in q over much of the western Atlantic (figures S7(b) and (d)). Because continental q decreases with increased bgcCO2, the downwind transport of lower q continental air cannot explain the summer increase in q in the wake region. Summer ocean evaporation also does not change substantially in the wake region (figure S8). Instead, the increase in summer q over the western Atlantic is due to a change in atmospheric circulation. The continental warming resulting from reduced evapotranspiration induces an anomalous low-level cyclone centered over the eastern edge of the continent, bringing warm, moist air from the Gulf of Mexico and Caribbean northward along the coast of North America (figure S9). The transport of moisture into the wake region by this anomalous circulation damps the temperature-induced intensification of the RH wake. The combination of the opposing effects of the T and q changes on RH produces a slight intensification of the RH wake with increased bgcCO2 across all models (figure 5).
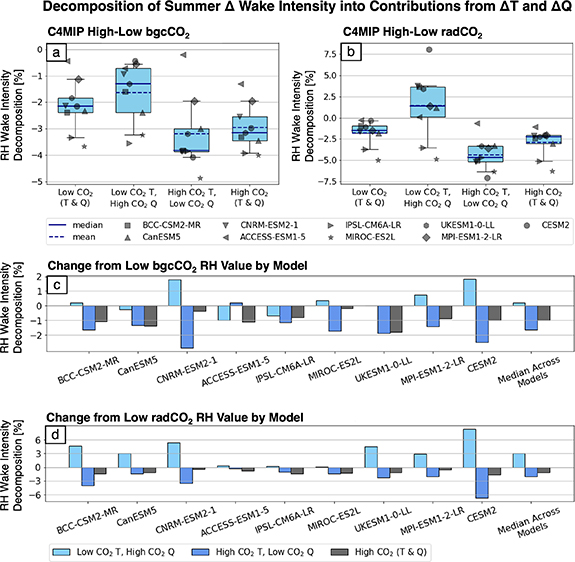
Figure 5. Summer  wake intensity change decomposed into contributions from changes in T and changes in q in the region of the
  wake intensification with increased (a) bgcCO2 and (b) radCO2, where positive values correspond to higher (moister) RH and negative values correspond to lower (dryer) RH. Panels (c) and (d) show the change in the
  wake from the low CO2 wake value in for each model, for bgcCO2 and radCO2 respectively.
Download figure:
Standard image High-resolution imageThe drivers of winter  change are different than those in summer. In winter, there is little change in continental
  , but
, but  still intensifies (figure 3). Rather than being driven directly by downwind transport of anomalous continental
  , the reduction in winter
  is due to increased continental temperatures, which are caused by a darker land surface resulting from reduced snow cover and increased winter leaf area (figures S7 and S10). The darkened land surface absorbs more shortwave energy, leading to warming of the surface and overlying atmosphere in the winter.
3.4. Radiative effects of CO2 intensify wake through continental warming
The radiative effects of enhanced CO2 intensify  in both winter and summer, but with spatial patterns and magnitudes that differ greatly from those caused by the biogeophysical effects of CO2 (figure 3). The intensification of
  with increased radCO2 results from the radiatively driven increase in land surface temperatures (figure S11). In contrast to increased bgcCO2, which has the largest impact on temperatures over land, increased radCO2 drives widespread warming over both land and ocean, with stronger warming than bgcCO2; the hotter atmosphere has a greater evaporative demand and causes increased terrestrial evapotranspiration in many regions (figure S11). This response of evapotranspiration is not large enough to fill the enhanced vapor pressure deficit that drives it, so the large increase in land temperatures produces a decrease in summer continental
  and an intensification of
  . As in the bgcCO2 case, q increases in the region where
  intensifies as a result of anomalous poleward winds over the western Atlantic, but for radCO2 this poleward flow is part of an anomalous anticyclone centered over Florida and the Gulf of Mexico (figure S9). On its own, this increase in q would lead to a weaker
  , while the increase in T would lead to a strong intensification of
  (figure 5). The final result is a modest intensification of the wake as a result of increased radCO2.
While the peak magnitude of the wintertime  change is more than twice as large for radCO2 than for bgcCO2, the wake change induced by bgcCO2 occupies a larger spatial area (cf figures 3(a) and (c)). In summer, the radCO2 wake changes are largest in Hudson Bay and the Gulf of Mexico, while for bgcCO2 the changes occur largely along the eastern seaboard of Canada and the USA, suggesting that future plant changes driven by the biogeophysical effects of CO2 will dominate changes in the wake from Florida to Newfoundland.
3.5. Implications for coastal clouds and radiation
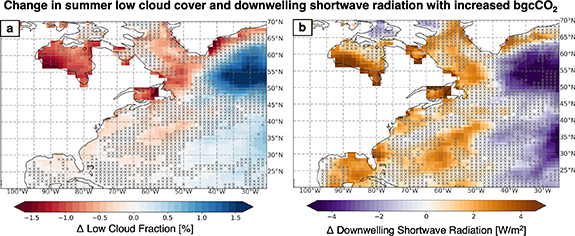
Increased CO2 drives changes not only in coastal  , but in coastal cloud cover and radiation. With increased bgcCO2, summer low cloud cover decreases along the full length of North America's east coast, from the Gulf of Mexico to Hudson Bay (figure 6(a)). The reduced cloud fraction occurs year-round, with some seasonal changes in structure; cloud loss in the Gulf of Mexico is largest in winter (not shown), while cloud loss in Hudson Bay is largest in summer. Co-located with the reduction in low cloud cover is an increase of roughly 3 W m−2 in downwelling shortwave radiation (figure 6(b)). Coastal low cloud cover is also reduced as a result of increased radCO2, though for that forcing the total change in downwelling shortwave radiation at the surface is complicated by the response of clouds and other absorbers to the radiative effects of CO2 (not shown).
Figure 6. Change in summer low cloud fraction (left, %) and downwelling shortwave radiation at the surface (right, W m−2) with increased bgcCO2. Hatching indicates where less than 6/8 models agree on the sign of the response. 'Low clouds' are considered to be clouds from the surface to 700 hPa for models that report cloud fraction on pressure coordinates, and from the surface to 3000 m for models that report cloud fraction on height coordinates.
Download figure:
Standard image High-resolution image
4. Discussion
The reduction in coastal cloud cover with increased bgcCO2 is notable as the North American east coast is host to large human population centers and important marine ecosystems, in an area already prone to episodic clear-sky coastal events (figure S12). The changes in clouds directly alter the amount of sunlight reaching the ocean surface in these high-productivity coastal areas; while these regions are largely nutrient limited, they also experience seasonal light limitation (Arteaga et al 2014) and have high chlorophyll concentrations (Gregg et al 2005). Thus, the response of the terrestrial carbon cycle to increased bgcCO2 could, by altering downwelling shortwave radiation in the land wake region, impact ocean biogeochemistry.
Independent of its effects on ocean biology, increased ocean surface shortwave radiation also has implications for sea surface temperatures. While these changes in coastal cloud fraction and downwelling shortwave radiation are modest in magnitude, they represent an as-yet unidentified mechanism through which terrestrial processes—i.e. the plant response to bgcCO2—can alter ocean processes by causing atmospheric change.
The biogeochemically induced changes in the land wake presented here represent a new mechanism of regional climate change. The radiative effects of increased atmospheric CO2 on atmospheric water vapor and cloud cover have been widely examined, yet continue to be a large source of uncertainty for future climate projections (Held and Soden 2000, Stephens 2005, Lohmann 2006, Sherwood et al 2010, Wood 2012, Ceppi et al 2017, Kärcher 2017). The land wake represents a non-local climate response driven by the advection of air carrying a continental signature over ocean regions. This is distinct from changes in terrestrial climate driven by plant responses to CO2 (e.g. Swann et al 2016, Zarakas et al 2020b) or vegetation change (e.g. Kleidon et al 2000), and distinct from large scale circulation-inducing ecoclimate teleconnections (e.g. Swann et al 2012, Garcia et al 2016, Laguë 2016).
The remote influence of continental biogeophysical and biogeochemical changes on oceanic air likely involve a related set of complex processes, with the changes in coastal temperatures and humidities coupled to the Plank, water vapor, and lapse rate feedbacks (Soden and Held 2006, Laguë et al 2021). These processes merit further exploration, in the context of both forced long-term climate change and ongoing interannual variability.
Future study could also explore how extreme continental drought, heat waves, irrigation, and agriculture impact the land wake downwind of North America and other continents, and how terrestrially-driven atmospheric changes over ocean regions downwind of the continents impact ocean processes and productivity. The sensitivity of the wake to land-atmosphere coupling has yet to be explored. We might expect changes in terrestrial processes in regions with weak land-atmosphere coupling (e.g. as defined in Koster et al 2006) to have less impact on the continental wake than changes in terrestrial regions with strong land-atmosphere coupling. Further study should focus on which continental regions have the strongest control on the continental wake.
While this study focused on the Atlantic wake east of North America, similar mid-latitude wakes exist off the east coasts of Asia and South America (not shown). Asymmetries in RH also occur at lower latitudes, co-located with the subtropical cloud decks; further study is required to determine the relative contributions of ocean upwelling, atmospheric subsidence, clouds, and continental advection in these climatically important regions. Reanalysis data could be leveraged to explore the interannual variability of the wake and determine its sensitivity to large-scale climate modes of variability.
Acknowledgments
This research used resources of the National Energy Research Scientific Computing Center (NERSC), a U.S. Department of Energy Office of Science User Facility located at Lawrence Berkeley National Laboratory, operated under Contract No. DE-AC02-05CH11231. We acknowledge high-performance computing support from Cheyenne (10.5065/D6RX99HX) provided by NCAR's Computational and Information Systems Laboratory, sponsored by the National Science Foundation, and the data access and computing support provided by the NCAR CMIP Analysis Platform (10.5065/D60R9MSP). We acknowledge the World Climate Research Programme, which, through its Working Group on Coupled Modelling, coordinated and promoted CMIP6. We thank the climate modeling groups for producing and making available their model output, the Earth System Grid Federation (ESGF) for archiving the data and providing access, and the multiple funding agencies who support CMIP6 and ESGF. We acknowledge the use of imagery from the NASA Worldview application (https://worldview.earthdata.nasa.gov/), part of the NASA Earth Observing System Data and Information System (EOSDIS). M M L acknowledges funding support from the James S. McDonnell Foundation Postdoctoral Fellowship in Dynamic and Multiscale Systems. W R B acknowledges support by the U.S. Department of Energy, Office of Science, Office of Biological and Environmental Research, Climate and Environmental Sciences Division, Regional and Global Model Analysis Program, under Award DE-SC0019367.
Data availability statement
ERA5 and C4MIP data are publicly available from https://cds.climate.copernicus.eu/#!/search?text = ERA5 = dataset and https://esgf-node.llnl.gov/projects/cmip6/, respectively. Scripts used in the analysis, including the python environment used for analysis, are available on Zenodo at https://doi.org/10.5281/zenodo.7153500. No new data were created or analysed in this study.
Author contributions statement
M M L came up with the initial project idea, performed model simulations, and conducted the analysis. All authors discussed the analysis, suggested ideas for exploration, and contributed to the manuscript.
Supplementary data (6.6 MB PDF)