

Abstract
The lack of seasonally sustained floral resources (i.e. pollen and nectar) is considered a primary global threat to pollinator health. However, the ability to predict the abundance of flowering resources for pollinators based upon climate, weather, and land cover is difficult due to insufficient monitoring over adequate spatial and temporal scales. Here we use spatiotemporally distributed honey bee hive scales that continuously measure hive weights as a standardized method to assess nectar intake. We analyze late summer colony weight gain as the response variable in a random forest regression model to determine the importance of climate, weather, and land cover on honey bee colony productivity. Our random forest model predicted resource acquisition by honey bee colonies with 71% accuracy, highlighting the detrimental effects of warm, wet regions in the Northcentral United States on nectar intake, as well as the detrimental effect of years with high growing degree day accumulation. Our model also predicted that grassy–herbaceous natural land had a positive effect on the summer nectar flow and that large areas of natural grassy–herbaceous land around apiaries can moderate the detrimental effects of warm, wet climates. These patterns characterize multi-scale ecological processes that constrain the quantity and quality of pollinator nutritional resources. That is, broad climate conditions constrain regional floral communities, while land use and weather act to further modify the quantity and quality of pollinator nutritional resources. Observing such broad-scale trends demonstrates the potential for utilizing hive scales to monitor the effects of climate change on landscape-level floral resources for pollinators. The interaction of climate and land use also present an opportunity to manage for climate-resilient landscapes that support pollinators through abundant floral resources under climate change.
Export citation and abstract BibTeX RIS
1. Introduction
The pollination services provided by bees and other insects are essential for agricultural productivity and ecosystem health, and serve as the base of terrestrial food webs [1, 2], but, populations of some managed and wild pollinator species have experienced significant declines across the world [3–5]. A leading causes of these declines is the loss of abundance and species richness of flowering plants that bees and other pollinators depend on for food [6]. The distribution of flowering plants, and thus the available quantity and quality of nectar and pollen for pollinators, is influenced by land cover [7], weather [8], and climate [9, 10]. However, due to difficulty collecting and analyzing data on flowering resource availability and quality over sufficient spatial and temporal scales, it is challenging to adequately characterize the effects of these factors, and thus to understand how environmental conditions affect bee health. As a perennial insect species that forages throughout the growing season over several kilometers [11], the honey bee (Apis mellifera, L.) is an outstanding model system to explore the effects of flowering resource availability for pollinators across time and space. Because of the social structure and communal living of honey bees, colony-level measurements of hive performance can be made through the use of automated hive scales which provide a standard method to monitor changes in honey bee colony weight within and across days and seasons [7, 12].
The community of flowering plants available to bees varies greatly relative to land cover [13], and recent land use changes can result in reduced availability of habitat that supports abundant and diverse forb communities [14, 15]. Generally, grassy–herbaceous fields [16], spring-blooming deciduous forests [17], and wetlands [18] provide abundant flowering resources for pollinators, while agricultural and urban expansion threaten pollinator communities by reducing the area of diverse habitat and the floral resources contained therein [6, 15]. The effect of different land covers on flowering plant resource availability, however, is highly context specific. The attractiveness and benefit of any land cover type to pollinators is relative to the other alternative food sources within the landscape [19]. This relative benefit may explain why a land cover that is described as pollinator-supportive in one region is not necessarily found to be pollinator-supportive in another region. For example, while intensive row crop monocultures are considered to be detrimental to pollinators in some contexts [6, 15], mass-blooming monocultural crops can provide short-term flowering pulses [20, 21], and thus the effect on pollinator populations depends upon overall landscape composition [22]. Likewise, agricultural management approaches that integrate flowering plants into the crop rows or field margins either by planting or by allowing volunteer plants to grow, can increase the pollinator attractiveness of farms [23]. This context-specific nature of land cover makes it challenging to make inference beyond the specific locations used in individual landscape-scale studies. Therefore, broad-scale studies with high replication are needed to determine the full effects of land use on flower availability and honey bee colony productivity.
Despite the importance of land use and land cover in structuring plant communities and the availability of flowering resources, studies assessing the influence of land cover, weather, and climate on bee health found a greater impact of weather and climate [24–26]. For example, in the eastern United States (U.S.), Calovi et al showed that weather was the primary driver of colony survival among honey bee colonies that were managed appropriately for parasites [26]. Likewise, Van Esch et al illustrated that weather variables were more explanatory in Belgian honey bee colony winter mortality than land cover variables [24] and Kom et al found that climate and weather variables in the Netherlands were of high importance in bee survival, even within a two-year study [25]. Each of these studies, however, did not examine flowering resource availability. Rather, they examined cumulative effects of weather and landscapes on downstream outcomes, such as survival, that are also influenced by multiple other variables [6, 27]. Other studies have assessed the direct effects of weather and climate on forage plant characteristics [9, 10, 28, 29], and beekeepers report weather and climate as one of the major stressors to their colonies [4], but no studies have monitored colonies over sufficient spatial and temporal ranges to determine how climate and weather interact with landscape quality to affect honey bee nectar acquisition in North America.
Given the multitude of factors affecting flowering resources across spatiotemporal scales, a standard low-effort method for surveying the effects of resource intake is needed. Because honey bee colonies collect and store foraged pollen and nectar resources to produce and support large populations through continuous brood rearing over the growing season, changes in colony weight are closely tied to changes in flowering resource availability over time [12, 30, 31]. Through generalist foraging and rapid recruitment, honey bee colonies are effective at discovering and exploiting rewarding resources in the landscape [32] over large distances [11]. Therefore, honey bee colony weight data may be a proxy for estimating landscape-level flowering resources [12].
This study combined hive scale data from several honey bee studies spanning five years and seven states across the Northcentral U.S. To estimate the relative importance of climate, weather, and land cover on landscape flowering plant resources, we inferred resource (i.e. primarily nectar) acquisition through honey bee colony weight changes. We focused on the period of late summer nectar flow (July–August) for which we had the most data. This is also a critical time when colonies need to collect sufficient resources to survive over winter [20]. We explore effects of climate, weather, and land cover across broader gradients than those found in the individual studies. Specifically, our objectives were (a) to determine the relative importance of climate, weather, and land cover to colony weight changes, (b) to predict nectar availability and honey bee productivity based on these variables, and (c) to understand how these variables interact to affect honey bee colony productivity.
2. Materials and methods
2.1. Hive weight data
Data spanned 5 years (2015–2019), 7 states (Michigan, Minnesota, North Dakota, Ohio, Pennsylvania, South Dakota, and Wisconsin), 162 apiary locations, 644 colonies, and approximately 2.9 million logged colony weights. Co-authors deployed either Solutionbee™ (Raleigh, NC) or Broodminder™ (Stoughton, WI) scales that continuously logged colony weights hourly or every 15 min. Colonies were under a variety of management conditions (table S.1 available online at stacks.iop.org/ERL/17/064036/mmedia).
All data cleaning and analyses were completed in R version 3.6.3 [33], following methods modified from Sponsler et al [12]. Data were first filtered to the highest available temporal resolution and range among the various studies. A single nighttime (00:00–02:00) weight was obtained from each colony's scale on each day to quantify daily weight when all bees were inside their colonies. Most scales were in the field throughout the summer (July–August) and only a few studies had year-long data. The daily weight data were approximately normally distributed around 27 July, so we chose to trim the data to 1 July–31 August, a two month period with the greatest overlap among the available data. Nineteen colonies had fewer than 10 d of data within this period and were excluded due to insufficient sample size. The cumulative sum of weight change over this time was calculated for each hive scale (starting at 0 kg on 1 July). To remove artifactual spikes and drops that could have occurred as a result of colony disturbance, daily weight changes outside of 3 kg d−1 were changed to 0 kg for colonies outside the Great Plains (i.e. WI, MI, OH, PA). Colonies in the Great Plains (i.e. ND, SD, MN), where honey production rates are typically higher [34], were allowed to gain up to 5 kg d−1 and lose up to 3 kg d−1 before weight changes were converted to 0. This resulted in a continuous, smooth weight time series. Three scales showed no change in weight, indicating a broken or malfunctioning scale, which left 622 colonies for analysis. The maximum cumulative weight obtained by each colony was then determined, representing the total weight gain of each colony during July and August.
2.2. Land cover
The total areas of various land covers within a 2 km radius of each apiary were quantified using the Cropland Data Layer (CDL) for each year [35] using the sp, rgdal, raster, and sf packages [36–39]. During summer 2 km is the average foraging distance over which honey bees travel [11] and was therefore considered an appropriate buffer distance. Shannon diversity of CDL land use within each 2 km foraging range was calculated using the vegan package [40]. Land covers were then binned into five broad categories: grass crops, woody–herbaceous crops, grassy–herbaceous natural land, woody natural land, and developed land (table S.2).
2.3. Climate and weather effects
Temperature and precipitation data for each apiary were obtained from the PRISM Climate Database [41] using the prism package [42]. Henceforth we refer to climate as the 30 year normal temperature and precipitation data, while weather is described as temperature and precipitation for each year. Monthly climate (30 year normal) rasters were downloaded at 800 m resolution and monthly weather rasters were downloaded at 4 km resolution. Each PRISM raster was clipped and averaged within the 2 km buffer around each apiary. Due to known lag effects of weather on the following season's flowering resources [43], September–December weather data from the preceding year (Yt−1) were used to model hive weight data the following year (Yt). Climate and weather metrics (precipitation and temperature) were then binned seasonally by averaging across months: spring (March, April, May), summer (June, July, August), autumn (September, October, November), and winter (December, January, February). Growing degree day accumulation was calculated using the averaging method with a base temperature of 10 °C, from April 1 to August 1 of each year [44].
2.4. Statistical analysis
We used random forest regression to model the maximum weight gain (peak in cumulative weight over the two month period) of colonies across our region using the ranger package [45]. Random forests can be used to analyze large datasets, particularly those that do not meet the assumptions of traditional linear regression models [46]. Our dataset had several such limitations including multicollinearity among predictor variables (figure S.1) and spatial autocorrelation (table S.3). Maximum weight gain was regressed with the following variables: land use Shannon diversity, grassy crops, woody–herbaceous crops, grassy–herbaceous natural land, woody natural land, and developed land, as well as seasonal (autumn (Yt−1), winter (Yt−1), spring (Yt), and summer (Yt)) mean temperature and precipitation, 30 year normal seasonal mean temperature and precipitation, and growing degree days. We tuned the model using 10-fold cross validation on ten random seeds, following methods outlined in Calovi et al. We tested the number of trees between 2000 and 5000 in 500-tree steps and the number of variables to split at each tree node between 3 and 8 predictors in 1-node steps. The parameters that minimized out of bag (OOB) error were chosen for the final model [26]. Our model was tuned to 3500 trees and a maximum of three predictors per tree node. Using these tuned parameters, we performed 10-fold cross validation across 500 random seeds. Permutation variable importance (PVI), the additional accuracy that each variable provides to the model, relative to the overall model error, was calculated for each model [45]. We averaged model predictions, OOB error, and PVI and calculated 95% confidence intervals for PVI across all 500 random forest runs. Relationships between predictor variables and colony outcomes identified as important by our random forest models were visualized using partial dependence plots with the pdp package [47].
3. Results
On average, colonies gained 19.83 kg (±0.82 kg S.E.) from 1 July to 31 August. The random forest model OOB predictions explained 71% of the variance in our data, with a 120.90 error rate. This OOB error describes the rate of error as the random forest uses bootstrapping to fit and validate the model, averaged across all 500 cross validation runs [48]. The predictive fit of the model to the data was 0.72 (r = 0.85, p < 0.01, R2 = 0.72) (figure S.2). The model predicted colonies in the Great Plains (North Dakota, South Dakota, and Minnesota) to have greater rates of colony weight gain in July than the other states in our study (figure 1(a)). These predictions were accurate as shown by low error rates across our study region (figure 1(b)). The magnitude of error was slightly higher in the Dakotas, but there was no clear directionality to the errors (figure 1(b)).
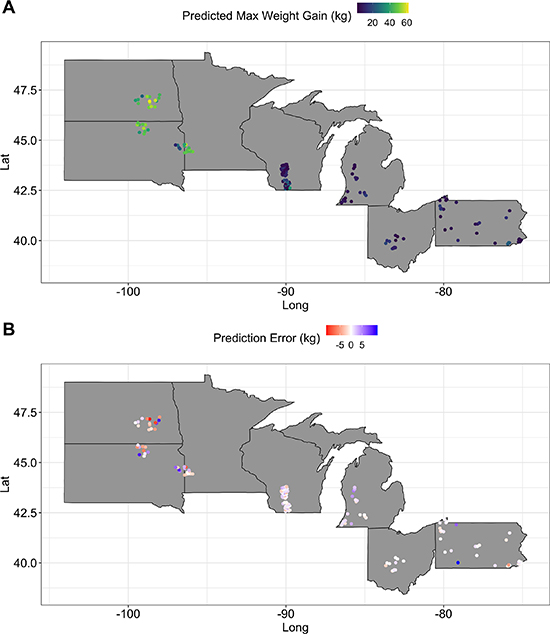
Figure 1. Random forest predicted rates of honey bee colony maximum weight gain (kg) in July and August (A) and the prediction error (predicted minus actual maximum colony weight gain) (B) plotted across sites in the Northcentral U.S. In panel (A) lighter colors represent greater weight gain. In panel (B) lighter colors represent lower error, with red representing under-prediction (actual weight exceeded model-predicted weight) and blue representing over-prediction (model-predicted weight exceeded actual weight). Predictions are averaged across all 500 runs of 10-fold cross-validation, colonies, and years for each apiary point location.
Download figure:
Standard image High-resolution imageClimate variables, including the 30 year normal winter temperature (Yt−1) (PVI = 91.65, 95% confidence interval (CI) = 91.26–92.04), winter precipitation (Yt−1) (PVI = 90.95, 95% CI = 90.57–91.33), autumn precipitation (Yt−1) (PVI = 89.60, 95% CI = 89.22–89.98), and spring precipitation (Yt) (PVI = 88.32, 95% CI = 87.95–88.68) were the most important predictors in the model. This was followed by the area of grassy–herbaceous natural land (PVI = 58.63, 95% CI = 58.29–58.98), which along with woody natural land (PVI = 36.90, 95% CI = 36.69–37.11) were the most important land use variables. Growing Degree Day accumulation (PVI = 43.53, 95% CI = 43.30–43.75) was the most important weather variable followed by autumn temperature (PVI = 42.31, 95% CI = 42.07–42.54) and precipitation (PVI = 41.14, 95% CI = 40.89–41.39) and spring precipitation (PVI = 39.28, 95% CI = 38.98–39.59) (figure 2).
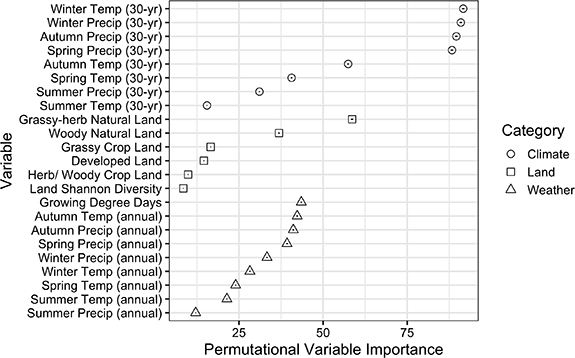
Figure 2. Predictor importance for maximum honey bee colony weight gain from July to August in the Northcentral U.S. based on random forest regression. Higher permutational variable importance values indicate that the predictor variable is of greater importance to the model. Input variables are organized in descending order of importance within category: 30 year normal seasonal climate data (circle), land use within 2 km of the apiary (square), and annual seasonal weather (triangle). Within each shape is a bar indicating the 95% confidence interval for each importance score based on 500 runs of 10-fold cross-validation. Autumn and winter climate and weather variables were taken from the previous calendar year (Yt−1) to the colony weight data (Yt), while spring and summer climate and weather and growing degree day data are from the same calendar year (Yt).
Download figure:
Standard image High-resolution imageThese trends show that colonies in wet and warm climates (i.e. Wisconsin, Michigan, Ohio, and Pennsylvania) (figure S.3) had the lowest weight gain in July and August (figure 3) compared to colonies in cool, dry climates (i.e. the Dakotas and Minnesota). Based on the partial dependency plots, colonies in wet and warm climates were predicted to gain 3–5 kg less than those in cool, dry climates (figure 3). Similarly, at an annual level, years and/or locations in which summer advanced more quickly (higher growing degree day accumulation by August 1) had colonies with lower weight gain (2–3 kg) in July and August. In years with warmer preceding autumns, colonies gained 3–4 kg less weight the following summer than in years with cooler preceding autumns, while variation in annual autumn precipitation had a comparably smaller effect based on assessment of the partial dependency plots (figure 4).
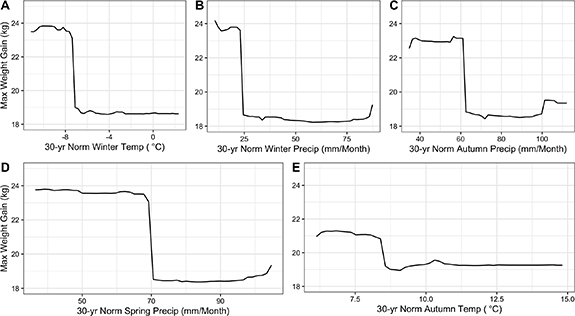
Figure 3. Partial dependency plots to visualize the predicted relationship between the maximum weight gained by honey bee colonies in the Northcentral U.S. in July and August and 30 year normal winter temperature (Yt−1) (A), winter precipitation (Yt−1) (B), autumn precipitation (Yt−1) (C), spring precipitation (Yt) (D) and autumn temperature (Yt−1) (E) within 2 km of each apiary location. These five climate predictor variables were the most important predictors of maximum colony weight gain based on random forest regression. Autumn and winter climate variables were taken from the calendar year previous (Yt−1) to the colony weight data (Yt). Predictions are based on a single random forest regression run.
Download figure:
Standard image High-resolution image
Figure 4. Partial dependency plot of the relationship of the annual growing degree day accumulation from 1 April to 1 August (Yt) (A), annual autumn temperature (Yt−1) (B), and annual autumn precipitation (Yt) (C), with maximum honey bee colony weight gain in July and August (Yt). Random forest regression predictions (based on a single run) are plotted in black. These three annual weather variables were identified as the most important weather variables in the random forest model.
Download figure:
Standard image High-resolution imageThe proportion of grassy–herbaceous natural land around the colonies was positively correlated with greater rates of colony weight gain, while woody natural land was negatively correlated with rates of colony weight gain (figure 5). Visualizing the partial dependency plot model predictions indicated that grassy–herbaceous land can enhance colony weight gain by up to 3.5 kg across climates. For colonies in warm and wet climates to gain weight comparable to the worst-performing colonies in cool and dry climates, grassy–herbaceous land must be abundant in the surrounding landscape (>25% of land area within 2 km of the apiary). The presence of grassy–herbaceous land is also predicted to enhance weight gain in cool, dry climates beyond what is possible for colonies in warm, wet climates (figure 6).
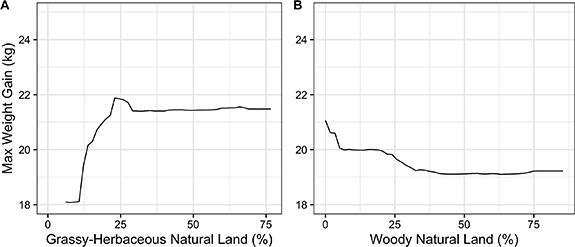
Figure 5. Partial dependency plot for the proportion of grassy–herbaceous land (A) and woody natural land (B) within 2 km of each honey bee apiary compared to the maximum weight gain of each honey bee colony from July to August in the Northcentral U.S. Random forest regression model predictions based on a single model run are shown with the black line. These two land use variables were the most important land use variables identified by the random forest model.
Download figure:
Standard image High-resolution image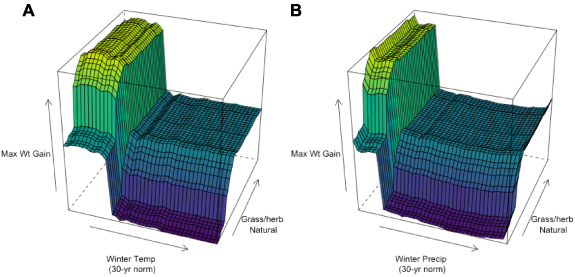
Figure 6. Partial dependency plot showing the predicted interactive effect of 30 year normal winter temperature (Yt−1) (A) and precipitation (Yt−1) (B) with grassy–herbaceous land area on honey bee colony maximum weight gain (kg) from July to August (Yt) in the Northcentral U.S. Higher values (lighter colors) represent higher maximum colony weight gain. Thirty-year normal winter precipitation and grassy–herbaceous natural land area were each calculated within 2 km of each apiary and were each the most important predictor variables of their category (climate and land use, respectively) based on our random forest regression model.
Download figure:
Standard image High-resolution image
4. Discussion
We found that climate was primarily responsible for predicting honey bee colony summer weight gain in the Northcentral U.S., and that land use and weather also played key roles. We show that colonies in warm, wet regions gained less weight in July and August. We also found that colonies surrounded by more abundant grassy–herbaceous natural land gained more weight than those surrounded by more woody vegetation. While our model predicts that grassy–herbaceous natural land can moderate the detrimental effects of warm and wet climates, it must be present in very high abundance to compensate for regional climate effects. Our results also revealed that growing degree day accumulation as well as temperature and precipitation in previous seasons are important to predicting colony weight gain the following summer. These patterns would have been difficult to detect without a temporally and spatially expansive dataset that used a standardized data collection approach.
Our model predictions highlight strong regional effects, with colonies in the Great Plains achieving greater weight gain than colonies in other states, which is consistent with beekeeper reports of honey production [34]. These regional effects stem from differences in climate, the most important predictor in our model. Our analyses indicate that warm, wet climates as well as years with high growing degree day accumulation and high autumn temperatures were associated with the lowest colony weight gain in July and August. While honey production was only measured in the summers, our findings suggest that climate effects at other times of the year can influence flowering plants. Báez et al similarly found a lagged effect of climate and found that colonies in drier climates and years produced more honey [49]. However, given that sufficient precipitation is essential to plant growth and nectar production [50], higher rates of weight gain via nectar acquisition in dry climates is somewhat unexpected. We hypothesize that the cool, dry climate in the Great Plains supports flowering plant communities that are more nectar-rich than those in warmer, wetter regions of our study (i.e. Wisconsin, Ohio, Michigan, and Pennsylvania). The sharp drop in predicted honey production among climate variables could reflect the biological range of these nectar-rich plants, or it may be an artifact of the surveyed states. Our large-scale analysis assumes that land cover types, such as grassy-herbaceous land, provide similar value to honey bees across regions. It is unclear how the quality of specific land covers changes across ecoregions. For example, many of the grasslands in the Midwest contain abundant alfalfa (Medicago sativa) and sweetclover (Melilotus spp.), which are valuable nectar producing plants [13]. However, many of the grasslands further east can often be dominated by grasses without abundant forbs. This variation in forage quality within land covers, across regions, may explain some of differences we observed. Additional monitoring across different climactic zones could help reveal the underlying mechanism behind our model predictions.
Continued long-term monitoring across different climactic zones using hive scales could offer a wealth of information on which climates support the most productive floral communities for bees and how the ranges of these communities may shift as climate continues to change. Hive scales are a low-effort, standardized method for monitoring changes in honey production and changes in the floral resource community [7]. Hive scale monitoring can provide information not only on absolute weight of foraged resources (as used in this study), but also on the timing of resource flows related to bloom phenology at the landscape-scale [51, 52]. In this way, hive scales could contribute to long-term monitoring for climate-change-associated pollinator stressors such as phenological mismatch between plants and their pollinators [53], habitat range shifts [54], and floral resource degradation [9].
Unexpectedly, summer climactic conditions and weather were among the least important variables in our model. Weather can have direct impacts on bees' ability to forage and can degrade flowering plants' pollen, nectar, and the flowers themselves [8]. However, our findings highlight the importance of climate and weather in previous seasons leading up to summer, likely through indirect effects on plant communities rather than on the honey bee colonies themselves. This is further supported by the fact that most of the colonies used in our study did not directly experience the conditions in the previous autumn and winter because they were initiated in the spring months of the study years (beginning in June). This lagged effect of climate and weather presents an opportunity for beekeepers and scientists to forecast productive summer apiaries in which to place colonies to recover from pollination contracts and to produce honey [49].
While climate and weather filter the types of floral communities that are able to grow in the different regions, land use further moderates the ability of landscapes to provide resources for bees. Grassy–herbaceous natural land, which is typically considered high-quality habitat for pollinators [15], was positively associated with colony weight gain in July and August. Moreover, model predictions demonstrate these habitats can buffer the detrimental effects of poor climates (warm and wet parts of the Northcentral). At its highest abundance in our study (approximately 75% of the surrounding land area) grassy–herbaceous natural land was barely able to bridge the gap between the best and worst climate conditions represented in our study. That is, colonies in poor climate regions with abundant grassy–herbaceous land were predicted to put on approximately the same amount of weight as colonies in more productive climates with small amounts of grassy–herbaceous land. Grassy–herbaceous natural areas often support native flowering species that can provide forage under a variety of precipitation conditions [55]. These climate-resilient plant communities may be underlying the patterns we observed. Land managers could work to preserve grassy–herbaceous land as bee forage habitats, capable of providing productive floral resources under a variety of climactic conditions.
Woody natural areas, which typically do not to support abundant flowering resources in late summer [17, 56], were negatively associated with colony weight gain in July and August. Other types of land use (agriculture and developed land) were not identified by our model as highly important. Previous studies describe cases where both agricultural and developed land nutritionally support honey bees [12, 57, 58]. However, these land covers can be highly variable in their forage quality and could be important at other times of the year [59], perhaps explaining why these land covers were not identified as important by our pooled analysis of several hundred colonies.
Habitats with climate-resilient plants may be even more important to unmanaged bee species. Beekeepers can provide supplemental food to honey bee colonies during times of nectar dearth and move colonies to areas with better climate, weather, and foraging habitat. But wild bees cannot escape environmental effects. Because wild bees often have shorter foraging ranges, narrower diet breadths, and work independently to collect resources, they may be more sensitive to local floral resource quality [60]. Our findings based on honey bees may therefore be a coarse lens through which to investigate environmental drivers of landscape suitability for pollinators, and the magnitude of effect on wild bees may be much greater.
While random forest regression is a powerful technique, there are tradeoffs with any modeling approach and random forests are not immune to the limitations of statistical analysis. For example, random forest regression has been shown to be relatively robust to correlated predictor variables [46], but there is still a risk of accepting a spurious relationship. Both the permutational importance and effect of these variables should be interpreted with caution when predictor variables are highly correlated [46], which was the case for our study, particularly among the climate variables (figure S.1). Please see the supplement for additional discussion of permutational importance of correlated variables. While we used a highly supported set of predictor variables, by no means, does the importance of variables imply causality. Rather, the important variables are only the most important of the candidate set within the scope of our study, highlighting the need for future monitoring. To minimize stochastic effects associated with splitting the data into training and testing data and growing decision trees random forests, we ran our analysis across 500 random seeds. The top two variables (30 year normal winter temperature and precipitation) had overlapping 95% confidence intervals (figure 2), indicating similar importance. None of the other 95% confidence intervals overlapped, providing confidence in the ranks we present, but closely ranked variables can change order run-to-run and should be interpreted as having similar importance. We would not expect removing the highly correlated variables to lead to an appreciable drop in performance, since we would expect other correlated variables would compensate [48]. Given that many of the most important variables are correlated, important variables (e.g. climate) should be interpreted cautiously (supplement 1). Random forests are also limited by interpretability of their results. Random forests do not test for statistical significance or provide linear effect estimates [46, 61]. Instead, the complex, non-linear relationships can be interpreted through visualization [47]. Though these data are observational and random forest regression is an exploratory analysis technique, our results align with previous studies [15, 49] and provide a framework for future studies.
Using honey bee hive scales as a standardized method for collecting detailed, long-term, broad-scale data, we were able to demonstrate the effects of climate, weather, and land cover on honey bee nectar intake, which is likely related to broader pollinator forage availability. Future studies could continue to use hive scales to monitor floral resource dynamics across a range of climate, weather, and land use conditions to further distill these effects on pollinator forage in a variety of contexts. Based on our findings, better models could be developed using climate and weather data to predict outcomes for honey bee colonies ahead of the growing season to help support beekeeper decision making. Land managers could also improve floral resources for managed and unmanaged bees by preserving grassy–herbaceous land covers and planting climate-resilient floral communities across the Northcentral United States.
Acknowledgments
We thank all our collaborating beekeepers and research technicians who supported the various projects from which these data are sourced. We acknowledge Darin J McNeil for contributions and feedback on early drafts of this manuscript. We thank Melanie Kammerer and Sarah Goslee (USDA-ARS) for helpful discussions. We thank the two anonymous reviewers for their helpful feedback. Funding was provided by USDA-NIFA-AFRI (#2018-67013-27538) and the Foundation for Food and Agricultural Research (#549032) awarded to C M G; Wisconsin MSN207057, DATCP #17-04 SCBG funding to C G and H G D; USDA Farm Service Agency through Inter-agency Agreement 16IAMRECRPHBTA1, and USDA-Natural Resources Conservation Service (Interagency Agreement Number 673A7514178) awarded to C R V O; NSF-GRFP (#DGE-1848739) and the Roger and Barbara Hoopingarner Endowed Graduate Fellowship in Entomology through MSU awarded to G M Q; USDA-NIFA post-doctoral fellowship (#2017-07141) awarded to D S; USDA-NIFA-AFRI (#2019-67013-29297) awarded to R M J; and support from the North American Pollinator Protection Campaign Honey Bee Health Improvement Grant Program. Any use of trade, firm, or product names is for descriptive purposes only and does not imply endorsement by the US Government.
Data availability statement
All data that support the findings of this study are included within the article (and any supplementary files).
Conflit of interest
None to declare.
Author contributions
G M Q designed and conducted the analysis and wrote the paper with edits and contributions from all authors; D S and C M G conceived this project and organized the colony weight monitoring workshop that initiated this paper; G M Q, D S, H G D, H M S, C R V O, A H S, T C, and C M G contributed ideas during the workshop; DS, CRVO, and AHS contributed code for extracting weight data; CMG contributed to paper formatting; G M Q, D S, H G D, C G, H M S, C R V O, A H S, R I, R J, M O M, and C M G designed the experiments, and collected the data that were used in this pooled analysis.