

Abstract
Day-to-day (DTD) temperature variation reflects a rapid weather variability, which significantly affects human health and ecosystems. However, while a few of studies have addressed certain regional variations, no global pattern of rapid temperature variability has yet been investigated. Here, using global daily temperature observation data, we present a study of the worldwide spatial heterogeneity of rapid temperature variability and its long-term trends over the past 60 years. We found a significant decline in northern mid and high latitudes in boreal winter but a significant increase in the Arctic coast, South China and Australia in boreal summer during the study period. Using observational data and Coupled Model Intercomparison Project Phase 5 (CMIP5) multi-model ensemble simulations, we further demonstrate that the human-caused increase in greenhouse gases (GHGs) concentration leads to a significant change in meridional temperature gradient, which in turn results in the observed decline of rapid temperature variability in the mid and high latitudes and the increase in rapid temperature variability in Arctic Coast in summer. In contrast, human-induced increase in GHGs and aerosol accounts for approximately one third and two third of the decline of rapid temperature variability in North China in boreal summer, respectively. However, the increase in summer rapid temperature variability in southern China appears to be primarily associated with the long-term internal climate variability. It is further shown that, based on the CMIP5 multi-model ensemble simulations, the projected rapid temperature variability shows a significant decrease in the high latitudes in winter but a slight increase in tropical zones by the end of this century. These findings clearly reveal an important role of human activities on the historical and future rapid temperature variability.
Export citation and abstract BibTeX RIS

Original content from this work may be used under the terms of the Creative Commons Attribution 4.0 license. Any further distribution of this work must maintain attribution to the author(s) and the title of the work, journal citation and DOI.
1. Introduction
The human society is very sensitive to weather and climate variability and extreme events (Katz and Brown 1992, Schär et al 2004). Both observational data and climate model simulations have revealed significant decreases in sub-seasonal temperature variability over the northern mid to high latitudes in the cold season due to the Arctic amplification induced by increased greenhouse gases (GHGs) (Screen 2014, Schneider and Bischoff 2015). Climate model projections have indicated that monthly and interannual temperature variability decreases in mid latitudes in winter, but increases over most land areas in summer (Fischer and Schär 2009, Fischer et al 2012, Holmes et al 2016). Marine and terrestrial temperature proxies have shown a decrease in the variance of temperature globally by a factor of four from the Last Glacial Maximum to the Holocene epoch (Rehfeld et al 2018). Note that most of these earlier studies focused on changes in low-frequency temperature variabilities. The global patterns of rapid temperature variability, measured by the absolute difference of temperature between two adjacent days, have been the focus of less attention, with a few exceptions (Karl et al 1995). This is due to the limitations of long-term global observational data.
It is known that high-frequency temperature variability can affect both human health and natural ecosystems. For example, enhanced high-frequency variability could affect the transmission of malaria and epidemic influenza (Paaijmans et al 2010, Liu et al 2020), increasing the risk of human mortality (Guo et al 2011, Zhan et al 2017). It could also cause damage to crop growth in terrestrial ecosystems, but reduce the risks of coral bleaching in marine ecosystems (Wilks and Riha 1996, Safaie et al 2018).
Previous studies found a less significant decrease in the variance of daily temperature and in the mid-high latitudes (e.g. Shen et al 2011, Donat and Alexander 2012, Lewis and King 2017). The decrease in temperature variance contributes 20% reduction of cold air outbreaks in North America (Gao et al 2015). Note that the variance of daily temperature contains the variabilities at various time scales. To isolate the rapid temperature variation from the slow temperature variation, Karl et al (1995) introduced a day-to-day (DTD) temperature variability, which is defined by the absolute difference of the surface air temperature between two adjacent days. Their results suggested that, in association with global warming, the area-averaged DTD temperature variability has gradually decreased in the United States, China and much of the Northern Hemisphere. However, a recent study based on station data in China has suggested that DTD temperature variability shows clear spatial heterogeneity, characterized by a significant increase in DTD maximum temperature variability in South China and a clear decrease in North China during the summer (Wu et al 2017). A significant increase in DTD temperature variability was also observed in the Canadian Arctic (Przybylak and Vizi 2005). Simply computing the area-averaged temperature variability over certain countries may therefore lead to cancellation between positive and negative changes. Moreover, most previous studies focused on DTD temperature variability at specific stations or in limited regions (Moberg et al 2000, Rebetez 2001, Gough 2008, Gough and Hu 2016) rather than considering global patterns. In this paper, we review changes in rapid temperature variability with a special focus on spatial patterns by using an up-to-date global observational dataset and Coupled Model Intercomparison Project Phase 5 (CMIP5) multi-model simulations.
2. Data and methods
2.1. Observational data
We used the gridded global daily near-surface maximum and minimum temperatures (HadGHCND) over the period from 1960 to 2013 (Caesar et al 2006). The HadGHCND dataset was created using quality-controlled daily station observations from the U.S. National Climatic Data Center (NCDC) Global Historical Climatology Network-Daily (GHCND) database, which consists of data from more than 27 000 stations. An angular-distance weighting approach was used to interpolate the stations' data on a 2.5° latitude by 3.75° longitude grid (Caesar et al 2006). The data were designed primarily for the study of climate extremes and climate model evaluation. The data coverage was less than 40% in 1946, but increased to more than 50% after 1960 (Caesar et al 2006). Therefore, we used the data after 1960 in this study to take more land area into account. Given the coarse resolution of the GHCND data, our study mainly focused on the large-scale spatial pattern of rapid temperature variability. In the current study, we used the gridded observational data to facilitate the comparison with CMIP5 simulations as both gridded data appear in the similar spatial resolution. The gridded daily minimum and maximum temperature and precipitation in China were also used to investigate rapid temperature variability at the finer spatial scale of 0.5° × 0.5°. The gridded temperature (precipitation) data was constructed using gauge observations at 751 stations (2200) in China (East Asia) (Xie et al 2007, Xu et al 2009).
2.2. Model simulations
To determine the contribution of anthropogenic forcing to the historical changes in rapid temperature variability, we used the daily maximum and minimum surface air temperature data derived from CMIP5. The CMIP5 experiments used were four types of historical experiments (HIST, historicalGHG, AA and historicalNat) and two RCP experiments (RCP4.5 and RCP8.5) (Taylor et al 2012). The HIST experiment was forced by observed natural forcing (volcanoes and solar variability) and anthropogenic forcing (time-evolving GHGs, anthropogenic aerosols (AAs) and land cover in some of the models). The historicalGHG, AA and historicalNat experiments were driven by, respectively, only historical GHG forcing, only AA forcing, and only natural forcing. The comparison of four types of historical simulations helps to identify the contribution of natural forcing and various types of anthropogenic forcing to the changes in rapid temperature variability. The CMIP5 models analyzed in this study are CCSM4, CNRM-CM5, CSIRO-Mk3-6-0, CanESM2, GFDL-CM3, GFDL-ESM2M, IPSL-CM5A-LR, MIROC-ESM, MRI-CGCM3. Each type of historical experiment (1960–2005) includes simulations derived from five to nine models (supplementary table 1 which is available online at https://stacks.iop.org/ERL/15/124073/mmedia). We use the coupled simulations from CMIP5 under the RCP4.5 and RCP8.5 scenarios to project the changes of rapid temperature during the period of 2071–2100 relative to the historical period of 1971–2000. All model outputs were regraded to a common resolution of 2.5° × 2.5°.
2.3. Definition of rapid temperature variability
Following Karl et al (1995), we defined the DTD temperature variability index by the absolute difference of the surface air temperature between two adjacent days to measure the rapid temperature variability. Gough (2008) compared the DTD temperature variability to the commonly used standard deviation of daily temperature. He concluded that the DTD variability is more representative than the standard deviation to characterize the orderly and oscillatory climates (Gough 2008, Gough and Shi 2020). For example, assuming we have an orderly (e.g. 25, 25, 25, 25, 15, 15, 15, 15) and an oscillatory (e.g. 25, 15, 25, 15, 25, 15, 25, 15) temperature scenarios with the same standard deviations of 5.27. Under the orderly temperature scenario, one can only experience significant temperature change once but 7 times under the oscillatory temperature scenario. Thus, the DTD temperature difference is a more practical index to measure the rapid temperature variability than the standard deviation as the climate records usually exhibited a degree of orderly behavior. In addition, unlike the standard deviation of daily temperature that includes variabilities at various time scales, DTD temperature difference can separate the rapid temperature variability from other temporal scales.
We examined the significance of the trend of rapid temperature variability by using a two-tailed t-test, which takes serial correlation into account (Zwiers and von Storch 1995). A bootstrap resampling method was used to test the significance of the difference in rapid temperature variability between 2071–2010 and 1971–2000. We resampled 30 samples with replacement from the historical and future period and calculated the means at each grid cell. Repeating such a resample 1000 times, we obtained the distribution of difference in mean values. The 95% confidence interval is defined by the interval between the 2.5th and 97.5th percentiles of the distribution.
3. Results
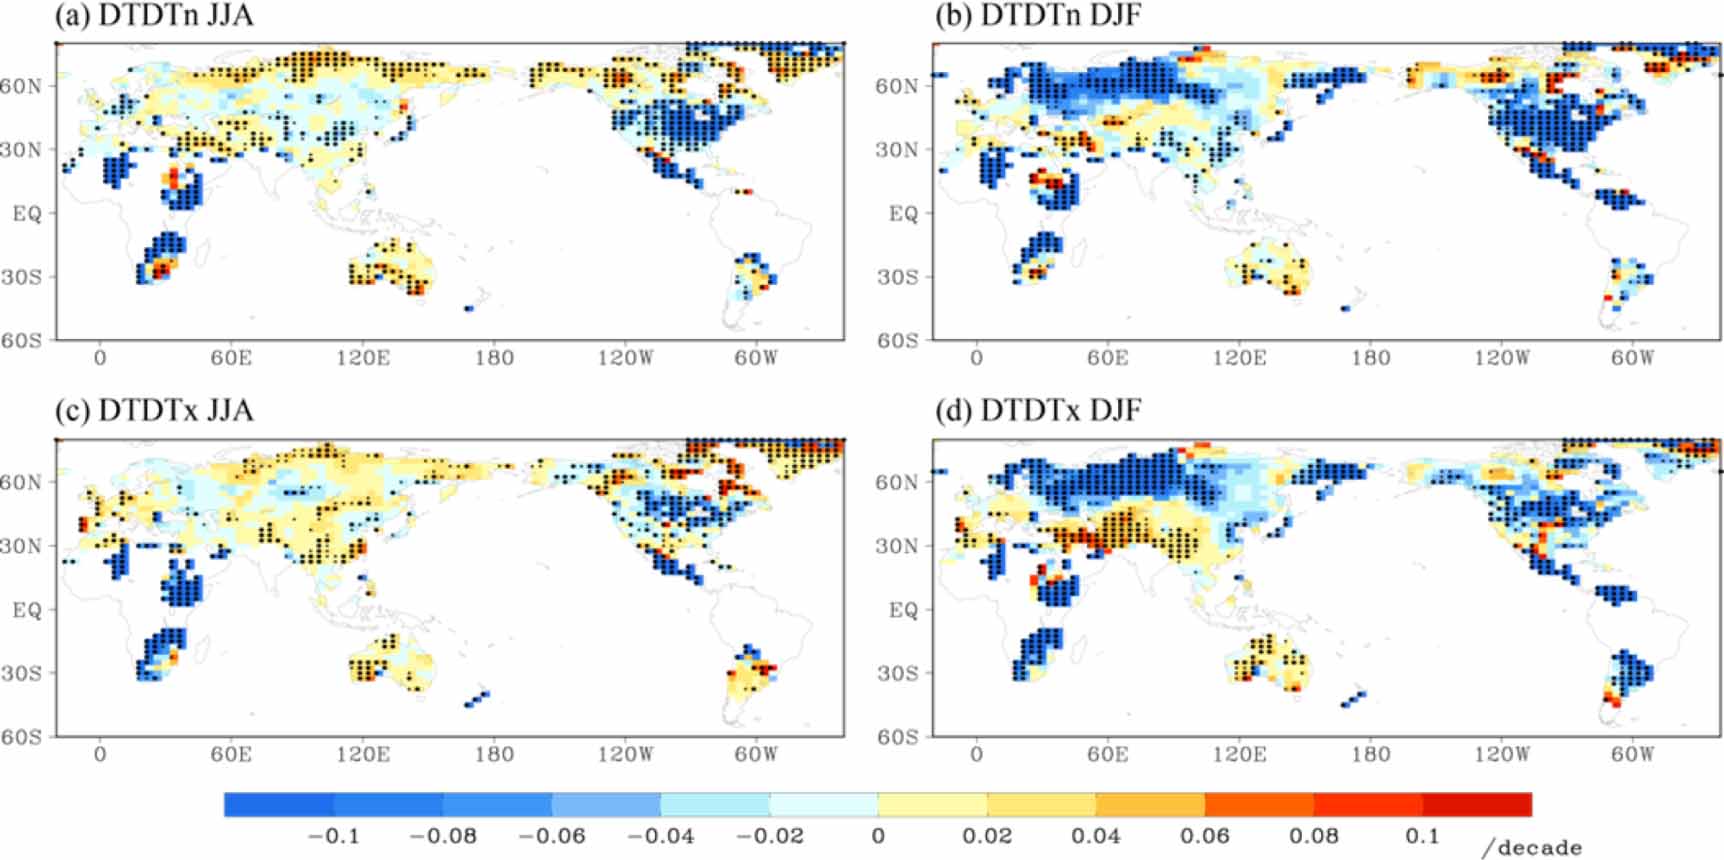
DTD temperatures generally show greater variability in mid and high latitudes in boreal winter, and weaker variability in the tropical zone in boreal summer. For example, in the northern Euro-Asian continent and North America, the climatological mean rapid temperature variability is 3 °C–4 °C d–1 in boreal winter but less than 1 °C d–1 in the tropical zones in boreal summer (supplementary figure 1). Over the past half-century (supplementary figure 2), the global mean rapid temperature variability has experienced a significant decline at a rate of 0.05 °C–0.06 °C per decade in both boreal summer and winter. However, the changes in rapid temperature variability show a clear spatial heterogeneity. The most significant decline in DTD minimum temperature (DTDTn) variability of 0.11 °C per decade occurs in North America in boreal winter (figure 1, supplementary figure 2(d)). A similar decrease in DTDTn is also observed in spring and autumn (supplementary figure 3). In contrast, over the past half-century, DTDTn variability increased significantly in the Arctic coast regions, western Asia and southern Australia in boreal summer. The long-term trend of DTD maximum temperature (DTDTx) shows a very similar spatial pattern as that of DTDTn. However, DTDTx increases significantly in South and Southwest China in boreal spring and summer (figure 1(c), supplementary figure 3(c)), which is consistent with observations revealed by Chinese weather station data (Wu et al 2017). In addition, significant increases in DTDTx are also observed in West Asia and Australia in boreal winter (figure 1(d)). As the global patterns of the changes in rapid temperature variability in spring and autumn are similar to those in winter, in the following analysis we focus on changes in winter and summer.

Figure 1. Linear trends of rapid temperature variability in boreal summer and winter during the period from 1960 to 2013. The upper and lower panels show the DTD minimum (DTDTn) and DTD maximum (DTDTx) variabilities, respectively. The big (small) dot indicates that the linear trend reaches the significance level of 0.05 (0.1) (using a two-tailed t-test). For comparison, the linear trend of rapid temperature variability in spring and autumn are shown in supplementary figure 3. JJA is June–July–August; DJF is December–January–February.
Download figure:
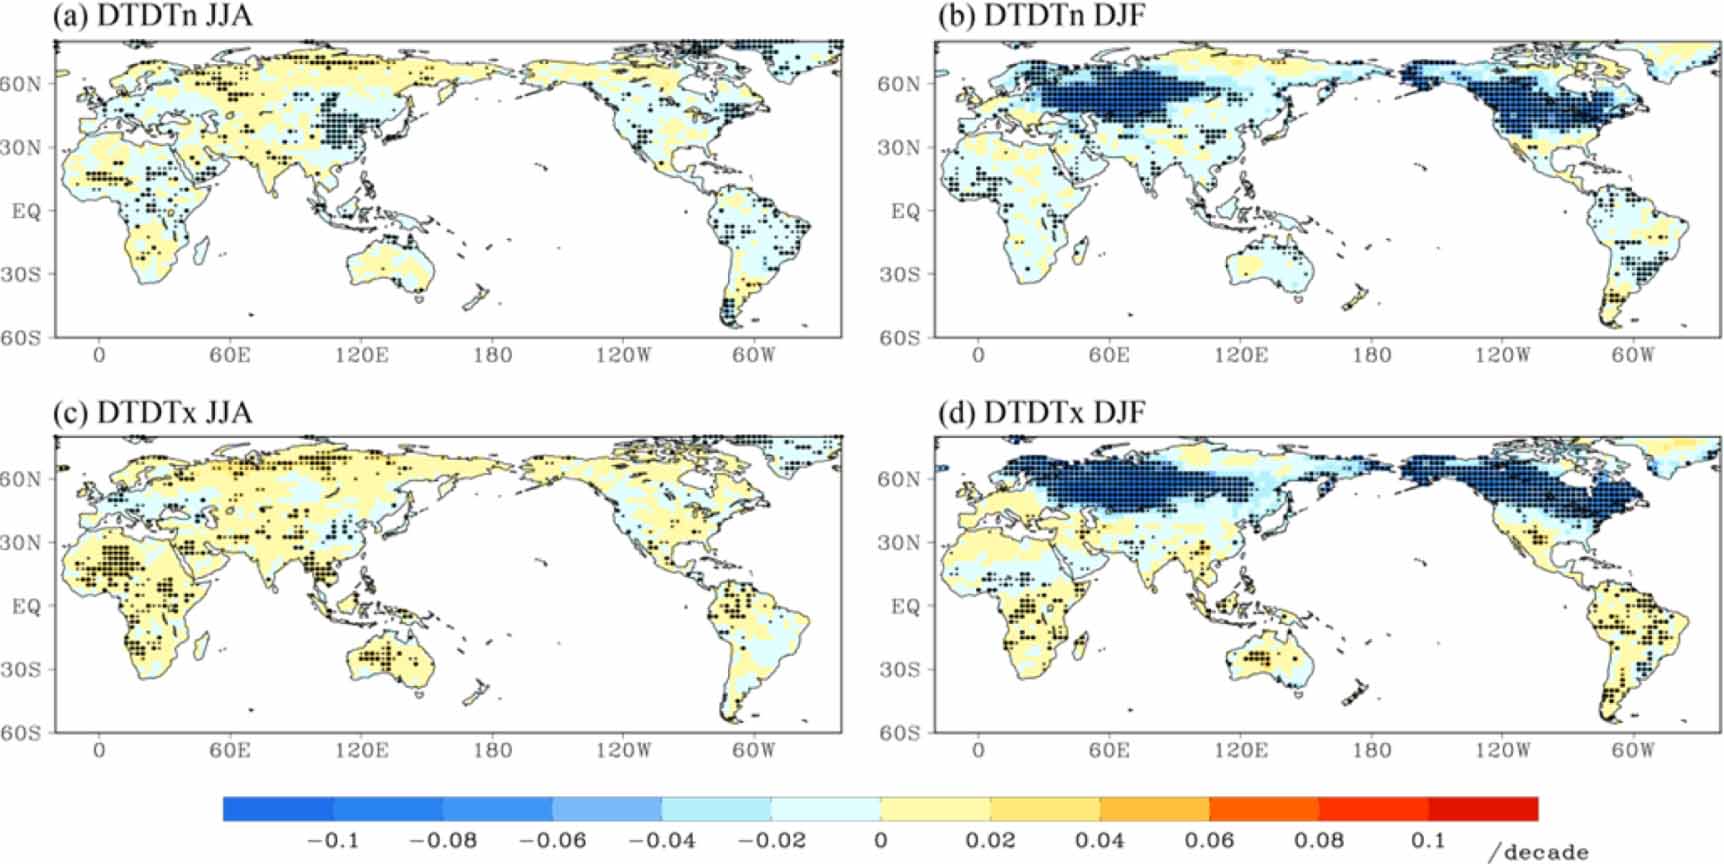
Standard image High-resolution imageTo investigate the causes of the changes in rapid temperature variability, we used four types of historical simulations generated by CMIP5 models: one using all forcing (HIST); the second using only GHG forcing (historicalGHG); the third using only natural forcing (historicalNat); and the fourth using only forcing by AA. The ensemble mean of the HIST experiment shows very similar spatial patterns of rapid temperature variability as those revealed by observational data, especially the decline in rapid temperature variability in mid to high latitudes in boreal winter and North China in boreal summer (figures 1 and 2). The HIST experiment also captures the increase in rapid temperature variability in the Arctic coast regions in boreal summer, although the modelled changes are less significant than the observed ones. The ensemble mean of the historicalGHG experiment generates similar spatial patterns of rapid temperature variability as both the HIST experiment and observational data (figures 1 and 2, supplementary figure 4). In contrast, the observed spatial patterns of rapid temperature variability are not found in the historicalNat experiment (supplementary figure 5). Thus, we can conclude that human-induced forcing accounts for most of the changes in the global pattern of rapid temperature variability, especially its decline in the mid to high latitudes in boreal winter and in North China in boreal summer.

Figure 2. Same as in figure 1 except derived from the multi-model mean of CMIP5 historical run over the period from 1960 to 2005. The areas with big (small) dots indicate that the linear trend reaches the significance level of 0.05 (0.1) (using a two-tailed t-test). For comparison, the linear trends of rapid temperature variability derived from the historicalGHG, historicalNat and AA experiments are shown in supplementary figures 4–6.
Download figure:
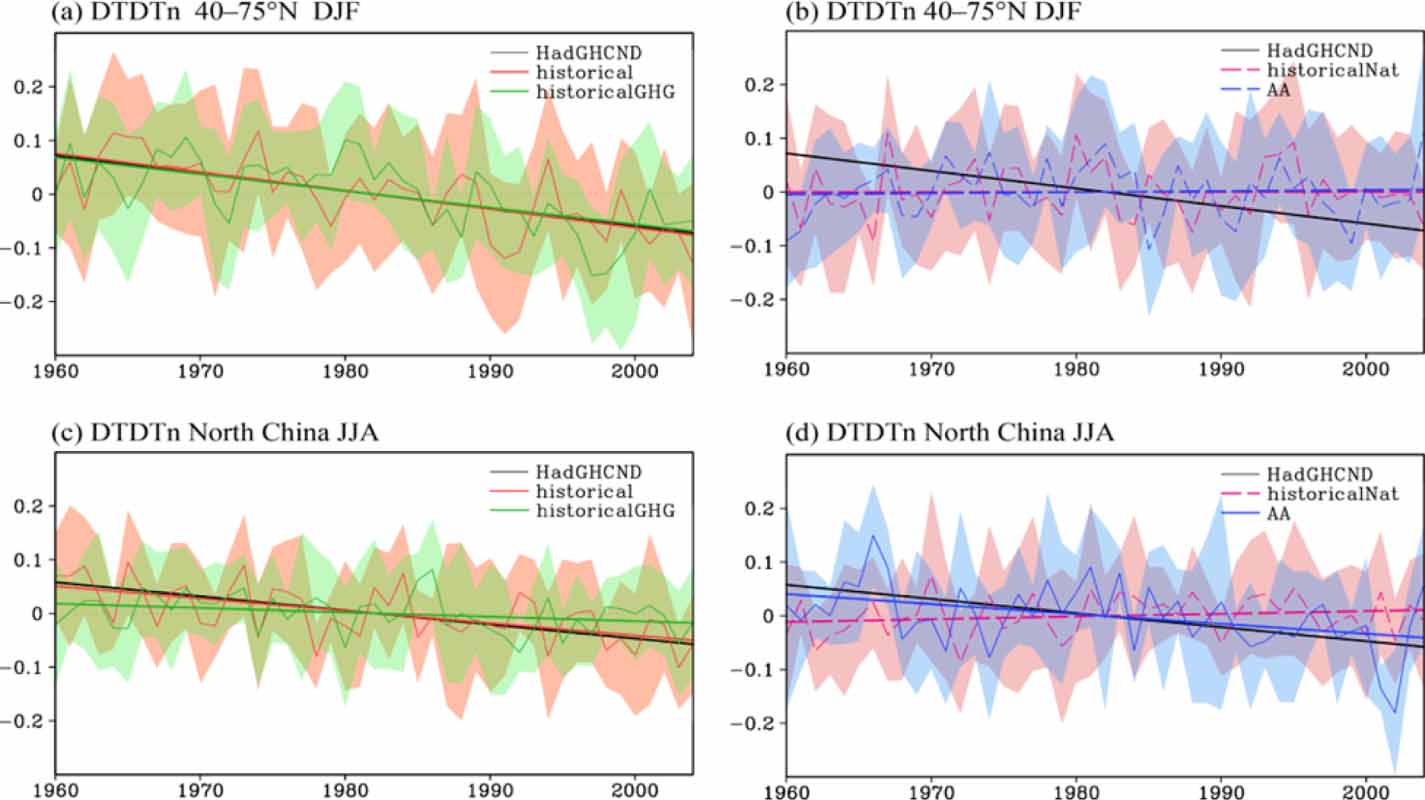
Standard image High-resolution imageThe HIST and historicalGHG experiments generate almost the same linear trend of DTDTn in the northern mid and high latitudes in boreal winter (figure 3(a)). In contrast, DTDTn shows no trend in the historicalNat and AA experiments (figure 3(b)). Thus, the increased GHG concentrations account for the decline of DTDTn in the northern mid and high latitudes over the period from 1960 to 2005. In North China, the observational data shows a significant decline in DTDTn in boreal summer, which is captured also by the ensemble mean of the HIST, historicalGHG and AA experiments (figures 3(c) and (d), supplementary figures 4 and 6). The increase in AAs leads to a decline of 0.018 °C per decade in DTDTn, while the increase in GHGs causes a decline of 0.009 °C per decade in DTDTn. In contrast, DTDTn shows no significant trend in the historicalNat experiment (figure 3(d)). Thus, the AAs account for about two-thirds of the decline of summertime DTDTn in North China over the period 1960–2005, and the increased GHGs account for the other one-third (figures 3(c) and (d)).

Figure 3. Area-weighted average rapid temperature variability and its trends for the northern mid and high latitudes (40–70° N, 0–360° E) in boreal winter and North China (30–42°N, 105–120°E) in boreal summer. The Solid line represents the trend significance at a significance level of 0.01 (using a two-tailed t-test). The shaded area indicates the standard deviation across all ensemble runs of each experiment.
Download figure:
Standard image High-resolution imageTo investigate how increased GHGs affect rapid temperature variability, we calculated the meridional gradient of the surface air temperature using observational data and the four types of CMIP5 historical experiments. The results indicate that the long-term trend of the observational rapid temperature variability shows similar spatial patterns as the trend of meridional temperature gradient derived from observation and both the HIST and historicalGHG experiments, especially in the boreal winter (figure 1, supplementary figures 7 and 8). This indicates that the changes in rapid temperature variability are likely to be linked to the GHG-induced change in horizontal temperature gradient. As it is known that the high latitudes are warming faster than the tropics due to increased GHG concentrations, this leads to a significant decrease in meridional temperature gradient, especially in the mid and high latitudes in winter (Screen 2014, Tamarin-Brodsky et al 2019, 2020). The decrease in meridional temperature gradient further leads to reduced warm and cold temperature advections, which in turn causes reduced rapid temperature variability in the mid and high latitudes in boreal winter (figures 1(b) and (d), supplementary figures 7(b) and (d)).
In addition, rapid temperature variability shows a significant increase in the Arctic coast region in boreal summer, which is consistent with the finding in Przybylak and Vizi (2005). The enhanced rapid temperature variability also appears to be related to the GHG-induced change in meridional temperature gradient. In summer, the northern Euro-Asian and North American continents are warmer than the Arctic Ocean. The faster warming of these continents, in association with increased GHG concentrations, leads to an enhanced meridional temperature gradient between them and the Arctic Ocean. This gradient causes a significant increase in rapid temperature variability in the Arctic coast in boreal summer. The observed pattern of the changes in meridional temperature gradient is successfully reproduced by the ensemble mean of HIST experiments (supplementary figures 7 and 8). In addition, the changes in rapid temperature variability in Canadian Arctic may also modulated by the changes in radiative balance due to the changes in sea ice over past decades (Laidler et al 2009).
Note that the HIST experiment does not capture the enhanced DTDTx in South China in summer (figures 1(c) and 2(c)). This indicates that the DTDTx change may be primarily related to internal climate variability. We therefore examined the DTDTx and DTD precipitation variability (DTDPr) in China, using daily observational data. The results show that both temperature and precipitation had enhanced DTD variability in South China (20–35° N, 110–120° E) and reduced variability in North China (35–42° N, 110–120° E). The number of rainfall days also shows an increase in South China and a decrease in North China (supplementary figure 9). The correlation coefficient between DTDTx and DTDPr ranges from 0.35 to 0.5 in South China in the summer season, reaching the significance level of 0.01. The enhanced rapid temperature variability appears to result from the changes in precipitation variability. It has been demonstrated that the East Asian summer monsoon has experienced a significant weakening over the past 60 years, which has led to significantly decreased precipitation in North China and increased precipitation in South China (Ding et al 2008). Previous studies have suggested that the changes in the East Asian summer monsoon rainfall is closely related to the Pacific Decadal Oscillation (PDO) during recent decades (Ma 2007, Zhou et al 2009, Yu et al 2015). In the late 1970s, precipitation decreases in North China and increases in South China in associated with the shift of PDO from cold phase to warm phase. On wet days, increased cloud cover leads to a significant decrease in incoming solar radiation. Moreover, the wet land surface favours evaporation. As a result, daily maximum temperatures tend to decrease. Conversely, on dry days more incoming solar radiation and a drier land surface result in higher daily maximum temperatures. Thus, an increase in DTD precipitation variability tends to enhance the DTDTx variability in South China. Such a mechanism can also explain the difference in DTD temperature variability between the cities with relative drier and wetter background climates (Gough 2008, Gough and Shi 2020). In addition to this internal climate variability, AA forcing could also contribute to the weakening of the East Asian summer monsoon, especially for the drying of North China, through modulating the formation of clouds and the strength of contrast in land–sea heating (Song et al 2014, Li et al 2019). The decrease in precipitation frequency therefore contributes to the decrease in rapid temperature variability in North China (supplementary figure 9). Moreover, the significant urbanization in North China and South China may also contribute to the changes in rapid temperature variability. DTDTx is generally greater (smaller) than DTDTn in urban (rural) sites due to the difference in radiative partitioning between urban and rural areas (Tam et al 2015). Consequently, urbanization tends to generate a decline in DTDTn and increase in DTDTx.
In addition to the linear trend, rapid temperature variability may also vary on interannual to interdecadal time scales. Therefore, we carried out an empirical orthogonal function (EOF) analysis in terms of rapid temperature variability in boreal summer and winter (supplementary figures 10 and 11). All of the time series of the first leading EOF modes show a very clear linear trend. Moreover, the spatial pattern of the first mode of EOF analysis is very similar to the long-term linear trend of rapid temperature variability (figure 1, supplementary figure 10). The first leading modes for DTDTx and DTDTn can explain 19%–27% of total variance (figure 2, supplementary figure 10). As we elucidated before, the linear trends of DTD rapid variability mainly result from anthropogenic forcing. We therefore can conclude that the human-induced changes in the global pattern of rapid temperature variability are the dominant signal compared with the changes induced by internal climate variability.
To measure the changes in various strengths of DTD temperature events, we divide the DTD temperature events into four categories: weak (less than 3), mild (3–6), moderate (6–9) and strong (greater than 9 °Cd−1). The CMIP5 multi-models under the RCP8.5 scenario projected a significant decrease in the mild, medium and strong DTDTx and DTDTn events of three to six days per season in the high latitudes in winter. In contrast, the weak DTD temperature events showed a remarkable increase of more than eight days per season in the high latitudes of the Northern Hemisphere in winter (figures 4(a) and (b)). In the tropical regions, the CMIP5 models project a significant increase in the mild, medium and strong DTDTx events and a significant decrease in weak DTDTx events particularly in boreal summer. However, the changes in tropical DTDTx events are on average less than 1 day per season. According to the CMIP5 models' ensemble mean, under the RCP8.5 scenario the projected 5 year recurrence interval of extreme DTDTx and DTDTn events in the historical period could increase to around ten years in the mid and high latitudes of the Northern Hemisphere and Antarctic continent in boreal winter. In austral winter, the 5 year recurrence interval tends to decrease to 3 or 4 years in southern Australia, South Africa and southern Brazil (supplementary figure 12). The extreme rapid temperature variability shows a similar spatial pattern under the RCP4.5 scenario, except with relatively weak amplitude (supplementary figure 13). The projected changes in rapid temperature variability are generally consistent with the changes in temperature variance characterized by reduced variability in the mid-high latitudes and enhanced variability in the tropical regions (Chen et al 2019).

Figure 4. Projected changes in various DTD temperature events. The concentric rings represent various strengths of DTD temperature events: weak (less than 3), mild (3–6), moderate (6–9) and strong (greater than 9 °C d−1). The change of DTD temperature events is defined by the difference of occurrence days between 2071–2100 and 1971–2000. The figure shows only the changes in DTD temperature events reaching the significance level of 0.01 (using a bootstrap method for significance test).
Download figure:
Standard image High-resolution image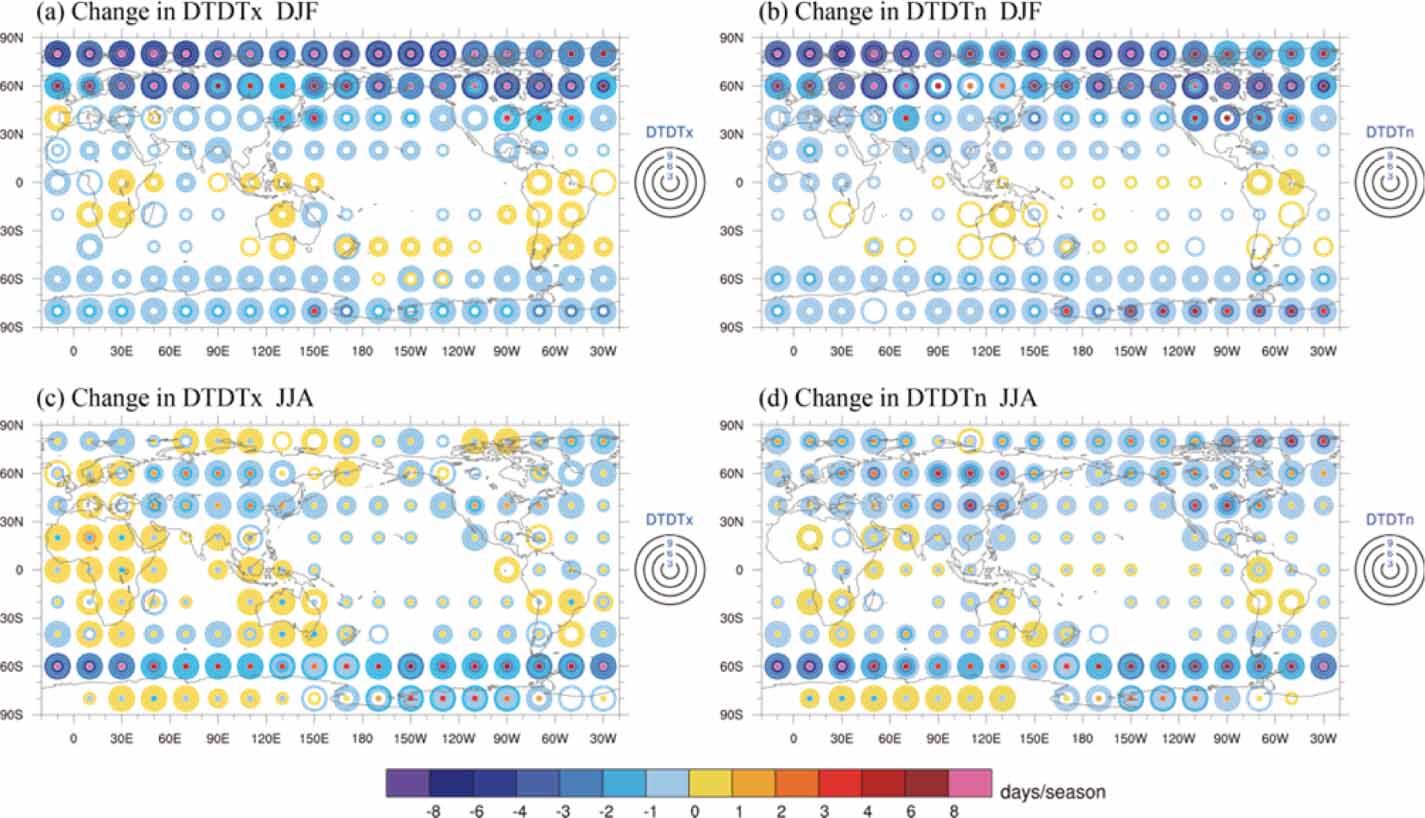
4. Discussion and conclusions
Our results suggest that rapid temperature variability experiences a significant decrease in the mid and high latitudes in boreal winter, which is generally the same as the findings reported in previous studies (e.g. Karl et al 1995, Gough 2008). However, our study further demonstrates a clear heterogeneity in the spatial pattern of long-term trend of rapid temperature variability. For example, we found a significant increase in the rapid temperature variability in the Arctic coast, South China and Australia in boreal summer during the study period in addition to the significant decrease in mid and high latitudes.
Our result suggests that changes in meridional temperature gradient associated with the increase in GHGs account for the decline of rapid temperature variability in mid and high latitudes. This is generally consistence with previous studies that demonstrated that the change in temperature lead to significant changes in monthly and daily temperature variability (Holmes et al 2016). Our study further demonstrates that the AA also plays an important role in modulating the rapid temperature variability. For example, the human-induced increase in GHGs and aerosol accounts for approximately one third and two third of the decline of rapid temperature variability in North China in boreal summer, respectively. Overall, our study demonstrates a dominant role of human activities in modulating the changes in historical rapid temperature variability and will continue to do so in the future. CMIP5 multi-model ensemble projects a significant decrease in the rapid temperature variability in the high latitudes in boreal winter but a slight increase in tropical zones by the end of this century.
Future changes remain uncertain due to the uncertainties in climate scenarios, internal climate variability and model uncertainties. In addition to GHGs and aerosols, human-induced changes in land use and land cover may also significantly affect rapid temperature variability. For example, rapid temperature variability can be very different over rural and urban areas even under the same climate background. Previous studies suggested that urbanization can strongly affect the DTD temperature variability through modulating the radiative budget (e.g. Tam and Gough 2012; Tam et al 2015, Gough and Hu 2016, Anderson et al 2018, Gough 2020). However, the effect of land use and land cover change, especially urbanization, is not well resolved or considered by coarse-resolution gridded observational data and general circulation models. Thus, the observational data may overlook the changes in rapid temperature variability in cities to a large extent. The reliable projections of changes in rapid temperature variability also remain a challenge especially at local scale. In addition, our results may also suffer from observational bias. For example, the daily maximum and minimum temperatures are affected by the absence of hourly observations and the difference in climatological observing windows (Zaknic-Catovic and Gough 2018). These issues warrant for further study. We hope that our results will draw attention in the climate change community and stimulate new insights.
Acknowledgments
We acknowledge the World Climate Research Programme's Working Group on Coupled Modelling, which is responsible for CMIP, and we thank the climate modeling groups (listed in supplementary table 1) for producing and making available their model output. The HadGHCND data was obtained from the Met Office at their website (www.metoffice.gov.uk/hadobs/hadghcnd/). The study was supported jointly by The National Key Research and Development Program of China (Grant Nos. 2016YFA0600403) and the National Science Foundation of China Grant (Grant No. 41675080). This work was also supported by the Jiangsu Collaborative Innovation Center for Climate Change.
Data availability statement
The CMIP5 data used in this study are available from the Earth System Grid Federation server (https://esgf-node.llnl.gov/search/cmip5). The HadGHCND data can be downloaded from the Met Office (www.metoffice.gov.uk/hadobs/hadghcnd/).
The data that support the findings of this study are openly available at the following URL/DOI: www.metoffice.gov.uk/hadobs/hadghcnd/.