

Abstract
Restrictions as a result of the COVID-19 pandemic have led to fewer vehicles on UK roads. Since fuel combustion is responsible for a large fraction of UK emissions it is expected that surface NO2 concentrations would reduce as a result. However, over parts of the UK, surface NO2 concentrations have increased following the implementation of travel restrictions. NO2 measurements from 142 Automatic Urban and Rural Network sites are combined with meteorological data from the Met Office high-resolution weather prediction model to build site specific models. These models predict NO2 concentrations given no change in emissions. It is found that both meteorological and emission changes contribute to the observed changes in NO2 concentrations. Given no change in emissions, changes in meteorology between pre- and post-lockdown periods would have led to a mean increase in NO2 concentrations of +6%. Conversely, changes in emissions would have led to a mean reduction in NO2 concentrations of -18%, resulting in the observed total change in NO2 concentrations of −12%. However at some sites the reduction in emissions is smaller than the increase in NO2 concentrations due to meteorology. The largest increases associated with changes in the meteorology are seen at rural sites (+20%) where NO2 measurements are representative of large areas and thus dominated by the regional advection of secondary NO2 from Europe. Conversely, the largest decreases associated with reduced emissions are found at urban traffic and urban background sites (−27% and −14% respectively) where NO2 concentrations are representative of local areas and thus dominated by local reduction in emissions from vehicles. As lockdown measures are relaxed, NO2 concentrations are likely to return to pre-COVID levels, but these results demonstrate that changes in our behaviour can result in positive impacts on air quality and illustrate the effectiveness of travel-reducing strategies in urban areas.
Export citation and abstract BibTeX RIS

Original content from this work may be used under the terms of the Creative Commons Attribution 4.0 license. Any further distribution of this work must maintain attribution to the author(s) and the title of the work, journal citation and DOI.
1. Introduction
The coronavirus disease 2019 (COVID-19) outbreak began in late 2019 and by March 2020 the virus had been declared a global pandemic by the World Health Organization (WHO 2020). COVID-19 is a respiratory disease which may lead to pneumonia with symptoms such as fever, cough and shortness of breath. Countries all over the world have implemented lockdown restrictions to slow down its infection and mitigate its effects. These restrictions have caused an unprecedented reduction in global economic activity and travel (Nicola et al 2020).
One of the pollutants that is important for air quality is nitrogen dioxide (NO2) which is emitted by fuel combustion (Carslaw and Beevers 2005, Carslaw et al 2011). Exposure to high concentrations of NO2 can aggravate respiratory diseases leading to increased hospital admissions (Mann et al 2002). In the UK, road transport is the largest source of NO2 emissions. NO2 is also formed in the atmosphere in a chemical reaction between nitric oxide (NO) and ozone (O3). Because this NO2 is not released straight into the atmosphere, but is formed there by a chemical reaction, it is known as secondary NO2. Both primary emissions and secondary formation influence NO2 concentrations. In addition, NO2 can be converted into nitric acid and nitrate aerosol, which are removed from the atmosphere by dry and wet deposition processes, or it can undergo photolysis leading to the destruction of NO2. Meteorology can also have a significant influence on NO2 concentrations. Strong wind conditions lead to the dispersion of NO2 away from sources, while calm conditions lead to its accumulation. Meteorology also modifies atmospheric chemistry processes such as photolysis and wet deposition. The combination of these processes can make it difficult to identify the contribution from individual components on NO2 concentrations.
Analysis of satellite and ground-based measurement data has shown that NO2 concentrations in some countries has reduced by between 10 and 50% during the COVID-19 lockdown (Muhammad et al 2020, Berman and Ebisu 2020, Sharma et al 2020, Bauwens et al 2020). For example, Venter et al (2020) found declines in ground level NO2 in 27 countries of −29 ± 15%. Thus there is a large amount of spatial variability in the estimated NO2 concentration reductions. This variability is driven partly by the varying lockdown restrictions and partly because ground-level measurements of NO2 concentration are determined by a number of factors. These include (i) the magnitude and proximity of primary NO2 emissions to the measurement site, (ii) the chemistry leading to subsequent formation and destruction of NO2 and (iii) the dispersion and transport of NO2. The aim of this study is to quantify the differences in NO2 concentrations that result from changes in emissions and changes in the meteorology.
The UK is positioned at the western edge of the European continent. The prevailing wind direction is westerly leading to the advection of relatively clean air over the UK from the North Atlantic. However, during high pressure conditions in western Europe, anticyclonic circulation can result in easterly advection of relatively polluted air from the European continent over the UK (Pope et al 2014). Under certain synoptic conditions, changes in meteorology can mask any changes in NO2 resulting from changes in emissions. This study investigates the spatial variability of NO2 concentration changes over the UK prior to and after the COVID-19 travel restriction were implemented on the 16 March 2020.
The total change in NO2 concentrations is partitioned into components associated with the varying meteorology and changing emissions. In order to investigate the spatial variability in surface NO2 concentrations it is necessary to build accurate site specific models using long timeseries of high spatial and temporal resolution meteorological and air quality information. This study uses over 5-years of air quality data from the Automatic Urban and Rural Network (AURN) in the UK (section 2). The air quality data is combined with over 5-years of high spatial resolution (1.5 km) meteorological data from the Met Office variable resolution model (UKV) (section 3). Site specific models are built to predict surface NO2 concentrations for 142 AURN stations (section 4). The impact of changing meteorology and emissions and the spatial variability in surface NO2 concentration changes described in section 5. Finally, the conclusions are found in section 6.
2. Data
2.1. Air quality data
The hourly air quality data used in this study comes from the Automatic Urban and Rural Network (AURN). The AURN includes automatic air quality monitoring stations measuring a range of atmospheric pollutants which undergo routine quality control. These sites provide hourly information which is communicated to the public via the Department for Environment, Food and Rural Affairs (DEFRA) website (DEFRA 2020). In this study we use hourly NO2 concentrations which are measured using chemiluminescence detectors. Currently there are 142 AURN sites measuring NO2 with the majority of sites classified as urban traffic (70), urban background (65) or rural background (21) (figure 1). Urban sites are located in built-up areas containing buildings with at least 2 floors. As a result, urban sites typically measure air quality which is representative of only a few km2. Rural sites are located more than 5 km from built-up areas, industrial installations or major roads. The air sampled by rural sites is therefore representative of air quality in a surrounding area of 1000 km2 (AURN 2020). The pollution levels measured at traffic sites are determined predominantly by the emissions from nearby traffic (Carslaw and Beevers 2004) whereas the pollution levels measured at background sites are not influenced significantly by any single source or street, but rather by the integrated contribution from all sources upwind of the station (Donnelly et al 2015).

Figure 1. Location of AURN sites measuring NO2. The sites are classified as rural background (red), suburban background (green), urban background (yellow) and urban traffic (blue).
Download figure:
Standard image High-resolution image2.2. Meteorological data
The hourly meteorological data used to build the statistical models in this study comes from the UK Met Office UKV model for the period 01/01/15 - 30/04/20. The UKV is a variable resolution UK model which has a high resolution inner domain (1.5 km grid boxes) over the area of forecast interest, separated from a coarser grid (4 km) near the boundaries by a variable resolution transition zone (Tang et al 2013). There are 70 vertical levels on a terrain-following hybrid-height vertical co-ordinate with Charney-Philips staggering. Sub-grid scale processes such as, boundary layer turbulence, radiation, cloud, microphysics and orographic drag are represented by parameterizations. The UKV has an advantage in that it contains a better representation of orography and other land surface parameters than coarser resolution models. Hourly 4D-Var assimilation allows the model to be initialised every hour to produce state-of-the-art weather forecasts for the UK (Ballard et al 2016). Meteorological data for the 5-year period (01/01/15 - 31/12/19) is extracted from the UKV and interpolated to the location of the AURN sites to build the statistical models described in section 4.
2.3. AQUM
The UK Met Office's Air Quality model (AQUM) is used in this study to simulate the regional transport of NO2. AQUM is the operational air quality forecast model for the UK (Savage et al 2013). The model has a 12 km horizontal grid spacing covering much of Western Europe. There are 70 vertical levels up to a model top height of 40 km. The model's meterological fields are intialised with data from the Met Office global model. The chemistry fields are initialised with data based on the 24-hour forecast from the previous day (Davis et al 2014). Boundary conditions for meteorology and chemistry come from the Met Office global model forecast and Copernicus Atmosphere Monitoring Service global forecasts respectively (CAMS 2020). Emissions of NO2 within the AQUM domain are generated by merging two data sets: the 2017 National Atmospheric Emissions Inventory (NAEI) (1 × 1 km) for the UK and 2017 European Monitoring and Evaluation Programme (EMEP) (0.1 × 0.1 degrees) for the rest of the model domain.
A quantitative evaluation of the ability of AQUM to capture the regional spatial distribution of NO2 when sampled under the Lamb weather types, was performed by Pope et al (2015). Lamb weather types are an objective classification of midday UK circulation patterns (Lamb 1972). Pope et al (2015) found that AQUM could reproduce the large-scale accumulation of tropospheric column NO2 over the UK under anticyclonic conditions and that transport is an important factor in governing the variability of UK air quality on synoptic timescales. AQUM is used in this study to qualitatively visualise the regional transport of NO2, therefore emissions have not be altered to reflect post-lockdown emissions changes.
3. Synoptic overview of the pre- and post-lockdown periods
To gain an understanding of the meteorological situation this section provides a brief overview of the changes in the synoptic situation between the pre-lockdown period (01/02/20 - 16/03/20) and the post-lockdown period (17/03/20 - 30/04/20). Figure 2(a) shows the change in mean sea level pressure between the post- and pre-lockdown periods. The post-lockdown period was dominated by several persistent high pressure periods resulting in an increase in mean sea level pressure of 10-15 hPa over the whole of the UK. As a result of reduced horizontal pressure gradient the mean wind speed reduced by 1–2 ms−1 during the post-lockdown period over the whole of the UK (figure 2(b)). Reduced wind speeds typically reduce dispersion which can cause NO2 to accumulate close to its source (Bower et al 1994). During the pre-lockdown period the wind direction was dominated by south-westerlies and the advection of clean north Atlantic air over the UK (figure 2(c)). During the post-lockdown period there was an increase in the frequencies of easterlies (figure 2(d)), which typically results in the advection of polluted air from Europe over the UK containing high concentrations of secondary NO2.

Figure 2. (a) Change in mean pressure between post- and pre-lockdown period. (b) Change in mean wind speed between post- and pre-lockdown period. (c) Mean wind speed and direction during pre-lockdown period. (d) Mean wind speed and direction during post-lockdown period.
Download figure:
Standard image High-resolution image4. Method
4.1. Multiple linear regression modelling
In order to predict hourly NO2 concentrations during the ongoing COVID-19 travel restrictions multiple linear regression models are built using up to 5-years of AURN and UKV data (2015–2019) similar to the method of Shi and Harrison (1997). The models predict the hourly NO2 concentrations we would expect, during the COVID-19 period, given no change in NO2 emissions. Several meteorological and temporal explanatory variables are used to predict NO2 concentrations at each AURN station.
The Akaike Information Criterion (AIC) is used to determine which explanatory variables to include in our model. The model with the lowest AIC score is expected to have the best balance between its ability to fit the data set and its ability to avoid over-fitting the data set. The explanatory variables used in this study are shown in table 1. Some explanatory variables are cyclic not linear, such as wind direction (i.e. 0 and 360 degrees have the same direction). To account for this, wind direction is partitioned into its northerly and easterly components. Similarly, several of the temporal variables are cyclic. For day of year, day of week and hour of day a cyclic relationship is assumed with fixed periods of 365 days, 7 days and 24 hours respectively.
Table 1. Summary of explanatory variables used to predict NO2. * indicates cyclic variables.
| Meteorological data | Temporal data |
|---|---|
| Temperature (K) | Date |
| Pressure (Pa) | Day of year* |
| Wind speed (ms−1) | Day of week* |
| Wind direction* | Hour of day* |
| Surface Heat Flux (Wm−2) |
4.2. Partitioning of NO2 concentration changes
Changes in NO2 concentrations between the pre- and post-lockdown period may be due to changes in the primary emission of NO2, changes in the concentration of chemical precursors which can transform to produce secondary NO2 (i.e. NO and O3), changes in the meteorology which affects the transport and mixing of NO2 and its precursors, or a combination of all three. Differentiating changes in primary from secondary NO2 is not possible using multiple linear regression modelling. Instead we focus on partitioning the differences attributed to changes in emissions (Δ NO2 Emissions) from changes in the meteorology (Δ NO2 Meteorology).
The statistical models described in section 4 are used to predict hourly NO2 concentrations for the period 01/02/20–30/04/20. The model predictions assume no change in the emission of primary NO2 or the emission of chemical precursors which transform to produce secondary NO2. We partition the contribution to change in NO2 between the post- and pre-lockdown period as follows:
- (a)Δ NO2 Total: The difference between mean measured post-lockdown NO2 concentrations (
 ) and mean measured pre-lockdown concentrations () are compared to the 5-year averaged NO2 concentrations for the period 1 February - 30 April () at each AURN site.
 - (b)Δ NO2 Meteorology: The difference between mean predicted post-lockdown NO2 concentrations () and mean measured pre-lockdown concentrations are compared to 5-year averaged NO2 concentrations. The percentage change is attributed to changes in the meteorology.
- (c)Δ NO2 Emissions: The difference between mean predicted post-lockdown NO2 concentrations and mean measured post-lockdown NO2 concentrations are compared to the 5-year averaged NO2 concentrations. The percentage change is attributed to the changes in the emission of primary NO2 or the emission of chemical precursors which transform to produce secondary NO2.


5. Results
5.1. Percentage change in total NO2 concentrations (Δ NO2 Total)
The mean NO2 concentrations at 142 AURN sites are analysed for the pre-lockdown (01/02/20 - 16/03/20, figure 3(a)) and post-lockdown (17/03/20 - 30/04/20, figure 3(b)) periods. It is clear that since lockdown, NO2 concentrations have reduced over much of the UK. Figure 3(c) shows the percentage change between the post- and pre-lockdown periods (Δ NO2 Total). In the north of England NO2 concentrations have reduced by an average of 20%, but in the south of England and parts of Wales, several AURN sites show an increase in NO2 concentrations after lockdown of over 20%.
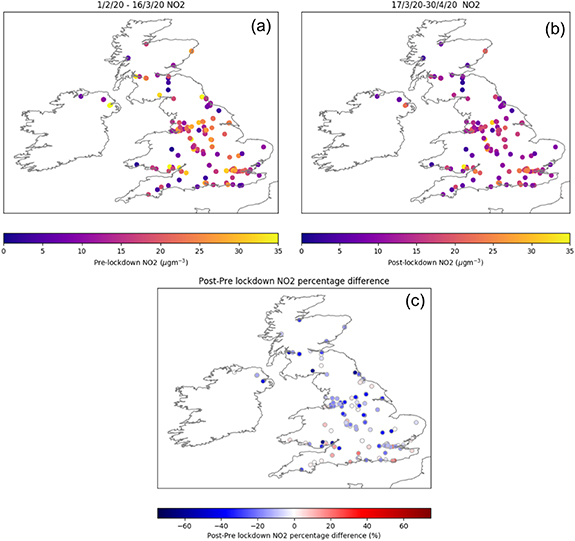
Figure 3. Data from 142 AURN measurement sites. (a) Mean NO2 from 01/02/20 - 16/3/20 (pre-lockdown), (b) mean NO2 from 17/03/20 - 30/04/20 (post-lockdown), (c) total percentage difference between post- and pre-lockdown periods.
Download figure:
Standard image High-resolution imageFigure 4 shows the time series of measured NO2 concentrations at 6 sites in the UK. At all sites the NO2 concentrations are below the 5-year average for much of the period studied. Figures 4(a) and (b) are for the London Marylebone Road and Glasgow Kerbside urban traffic AURN sites respectively. At London Marylebone Road the change in NO2 concentrations before and after lockdown was -36 and at Glasgow Kerbside NO2 concentrations changed by −20
 . This corresponds to a percentage change relative to the 5-year average of -42% and -30% respectively. Thus the anticipated decrease in NO2 concentrations due to reduced emissions from traffic is clear at these AURN sites. However, at Birmingham Adcocks Green (figure 4(c)) and Exeter Roadside (figure 4(d)) there is no change in NO2 concentrations after lockdown. Furthermore, at Chilbolton Observatory (figure 4(e)) and Eastbourne (figure 4(f)) there has been an increase in NO2 concentrations after lockdown, corresponding to Δ NO2 Total of +36% and +46% respectively.
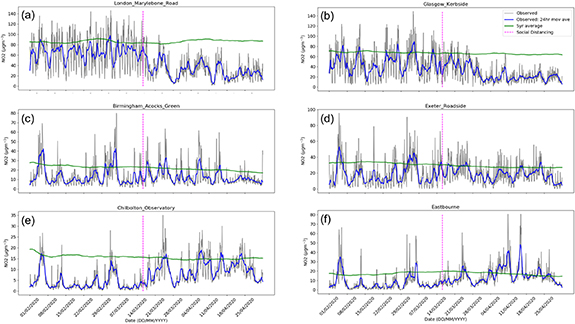
Figure 4. Measured NO2 concentrations between 01/02/20 - 30/04/20. Hourly NO2 concentrations (grey), daily averaged NO2 concentrations (blue) and 2015-2019 averaged NO2 concentrations (green) at (a) London Marylebone Road, (b) Glasgow Kerbside, (c) Birmingham Adcocks Green, (d) Exeter Roadside, (e) Chilbolton Observatory and (f) Eastbourne. Implementation of lockdown restrictions on 16/03/20 (magenta dashed).
Download figure:
Standard image High-resolution image5.2. NO2 concentration changes at individual AURN sites
Figure 5 shows the measured NO2 concentrations, with a 24-hour moving average applied (blue) and model predictions for the same period (red) for 4 AURN sites. At all sites the models capture the NO2 variability in the pre-lockdown period well (R2 > 0.5). In the post-lockdown period, the measured NO2 concentrations are generally lower than the model predictions. Since the model predicts the NO2 concentrations expected given no change in NO2 emissions, this suggests that emissions of NO2 have reduced at all 4 sites. This is particularly evident at London Marylebone Road (figure 5(a)) and Glasgow Kerbside (figure 5(b)) where NO2 emissions reduce by 34% and 49% respectively. At Birmingham Adcocks Green (figure 5(c)) the mean concentration did not change significantly from the pre- and post-lockdown period ( ). However, given no change in emissions, changes in the meteorology would have resulted in a change to NO2 concentrations of +18%. Changes in the emissions caused a change in NO2 concentration of −20%, therefore resulting in a negligible total change. Thus, despite the fact that there was little change in total NO2 concentrations, emissions of primary NO2 and secondary NO2 precursors were still found to reduce as a result of the COVID-19 restrictions. Similarly, at Exeter Roadside (figure 5(d)) there is no change in the mean concentration between the pre-lockdown period and the post-lockdown period. However, changes in the meteorology would have resulted in an increase in NO2 concentrations of +33%. This was offset by a reduction in emissions of −33%, resulting in no total change in NO2 concentrations. Performing similar analysis at all 142 AURN sites in England shows that, given no change in emissions, the changes in meteorology between the pre- and post-lockdown period would have led to a mean increase in NO2 concentrations of +6% (table 2). Conversely, changes in emissions would have led to a mean reduction in NO2 concentrations of −18%, resulting in a mean total change of −12% (table 2).
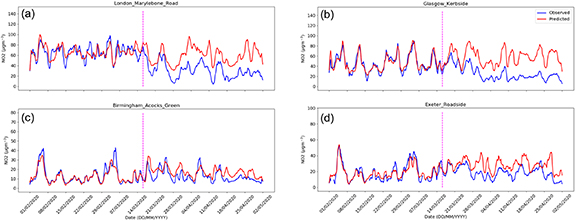
Figure 5. NO2 concentrations between 01/02/20 - 30/04/20. Daily averaged NO2 concentrations (blue) and predicted daily averaged NO2 concentrations (red) at (a) London Marylebone Road, (b) Glasgow Kerbside, (c) Birmingham Adcocks Green, and (d) Exeter Roadside. Implementation of lockdown restrictions on 16/03/20 (magenta dashed).
Download figure:
Standard image High-resolution imageTable 2. Changes in NO2 at individual AURN stations and averaged across sites with the same type. AURN site types are classified as Traffic (T) or background (BG) sites. Δ NO2 Total (µgm−3) is the total change in NO2 concentrations between the post-lockdown (17/03/20 - 30/04/20) and pre-lockdown (01/02/20 - 16/03/20) period. Δ NO2 Total (%) is the change relative to a 5-year climatology. Δ NO2 Met is the percentage change attributed to changes in the meteorology. Δ NO2 Emission is the percentage change attributed to changes in emissions. ± value is the standard error of the mean. R2 is the coefficient of determination for each model for the 5-year training period (01/01/15 - 31/12/19).
| Location | Site | Δ NO2 | Δ NO2 | Δ NO2 | Δ NO2 | Correlation |
|---|---|---|---|---|---|---|
| Type | Total | Total | Met | Emission | (R2) | |
| (µgm−3) | (%) | (%) | (%) | |||
| London Marylebone | Urban T | −36 | −42 | −8 | −34 | 0.52 |
| Glasgow Kerbside | Urban T | −20 | −30 | 19 | −49 | 0.54 |
| Belfast Centre | Urban BG | −20 | −71 | −53 | −19 | 0.42 |
| Halford-yr-yrns | Urban T | −19 | −26 | 8 | −34 | 0.54 |
| Birmingham Adcocks Green | Urban BG | 0 | −2 | 18 | −20 | 0.55 |
| Exeter Roadside | Urban T | 0 | 0 | 33 | −33 | 0.59 |
| Reading New Town | Urban BG | 2 | 6 | 40 | −34 | 0.54 |
| Chilbolton Observatory | Rural BG | 6 | 36 | 23 | 13 | 0.60 |
| Eastbourne | Urban BG | 8 | 46 | 22 | 24 | 0.55 |
| 59 AURN sites | Urban T | −7±1 | −19±2 | 8±3 | −27±2 | 0.53 |
| 53 AURN sites | Urban BG | −4±1 | −14±3 | 0±3 | −14±2 | 0.48 |
| 13 AURN sites | Rural BG | 1±1 | 20±6 | 20±9 | 0±7 | 0.41 |
| 142 AURN sites | All | −5±1 | −12±2 | 6±2 | −18±1 | 0.49 |
5.3. Spatial variability in NO2 concentrations changes
In this section the spatial variability in the total NO2 concentration changes shown in figure 3(c) is discussed. Firstly, the north/south pattern in total NO2 concentration changes is investigated. Changes in the meteorology are found to be responsible for larger increases in NO2 concentrations in the south of England and Wales than in central and northern parts of the UK (figure 6(a)). Changes in emissions are however more uniform over the UK (figure 6(b)). The meridional gradient in meteorological attributed changes in NO2 is likely to be due to the advection of secondary NO2 over the south of the UK by the predominantly south-easterly winds. This secondary NO2 is produced over the English Channel and BeNeLux regions and transported towards the UK during periods dominated by high-pressure and easterly winds. Two examples of anticyclonic NO2 transport during the post-lockdown period are shown in figures 7(a) and (b) with plumes of NO2 being transported over the UK, particularly the south and east coast of England. According to Lamb weather type, between 17/03/20 and 30/04/20, 48% of the days were classed as anticyclonic, resulting in frequent regional transport of NO2 from Europe to the UK in the post-lockdown period.

Figure 6. Change in post- and pre-lockdown NO2 concentrations attributable to (a) changes in meteorology and (b) changes in emissions.
Download figure:
Standard image High-resolution image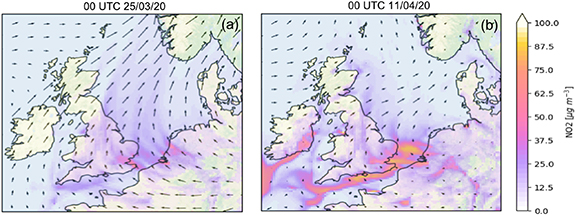
Figure 7. Surface NO2 concentrations from the UK Met Office AQUM forecast system overlaid with 500 m wind vectors. Plumes of NO2 are transported over the UK from the BeNeLux region and the English Channel at (a) 00UTC on 25/03/20 and (b) 00UTC on 11/04/20.
Download figure:
Standard image High-resolution image
Secondly, within the north/south pattern in total NO2 concentration changes there is some spatial variability. The largest increases associated with changes in the meteorology are seen at rural sites (20 ± 2%, table 2) at which the NO2 measurements are more representative of large areas (1000 km2) and thus NO2 concentrations are dominated by the regional advection of secondary NO2 (Harrison and McCartney 1980). Conversely, mean changes in NO2 concentrations at urban traffic and urban background sites (−27% and −14% respectively, table 2) are representative of more local areas (few km2) and are more influenced by local reductions in emissions of primary NO2 and secondary NO2 precursors (i.e. NO). The largest reduction in emissions are seen at urban traffic sites such as Bristol Temple Way (−59%), Oxford Centre (−45%) and Dumbarton (−43%). A few of the sites ( ) have small increases in NO2 emissions, however these are largely background sites where the absolute change in NO2 concentrations is small (
 ).
).
6. Conclusions
The aim of this work is to investigate the spatial distribution of changes in NO2 concentration in the UK between the 6-weeks prior to COVID-19 travel restrictions (01/02/20 – 16/03/20, referred to as 'pre-lockdown') and the 6-weeks after travel restrictions were imposed (17/03/20 – 30/04/20, referred to as 'post-lockdown'). The change of NO2 concentrations between the pre- and post-lockdown periods show an interesting north-south gradient. AURN stations in the north and middle of England measure a decrease in NO2 concentrations in the post-lockdown period whereas stations in the south of England measure an increase in NO2 concentrations. The measured change in NO2 concentrations is separated into contributions due to changes in meteorology and emissions using statistical regression. The results show that, given no change in emissions, an increased frequency of easterlies during the post-lockdown period would have caused an increase in NO2 concentrations, particularly in the south of England and parts of Wales. Conversely, a reduction in NO2 emissions caused a decrease in NO2 concentrations at most urban traffic and urban background AURN sites. In the north and middle of England the decrease in NO2 concentrations due to reduced emissions is greater than the increase due to change in the meteorology resulting in an observed decrease in NO2 concentrations. In the south of England, the reverse is true resulting in an observed increase in NO2 concentrations. Thus, NO2 emissions have reduced over the majority of the UK but the analysis shows that it is important to consider both meteorological and emissions changes in order to explain the observed NO2 concentration changes.
The restrictions put in place during lockdown provide a unique experiment in which the response of air quality to implemented strategies can be determined. Short-term clean air mitigation strategies have been studied previously, such as those in place for the 2008 Beijing Olympics or the result of economic recession (Castellanos and Boersma 2012). Since current lockdown measures are not sustainable, it is predicted that NO2 concentrations will return to pre-COVID levels unless we use lessons learnt from the lockdown to make changes (El Zowalaty and Järhult 2020). Any positive environmental effects are likely mostly temporary, but may serve as an example that changes in our way of life can have prompt positive effects for the environment and demonstrate the usefulness of travel-reducing measures such as those proposed by Carslaw and Beevers (2002).
Acknowledgment
We would like to thank Kaja Milczewska (University of Reading), Paul Agnew (Met Office) and Matthew Hort (Met Office) for useful discussions on this work.
Data availability
The air quality data that support the findings of this study are openly available at the following URL: uk-air.defra.gov.uk/networks/network-info?view = aurn.