

Abstract
Biomass-burning emissions (BBE) profoundly affect climate and air quality. BBE have been estimated using various methods, including satellite-based fire radiative power (FRP). However, BBE estimates show very large variability and the accuracy of emissions estimation is poorly understood due to the lack of good reference data. We evaluated fire emissions estimated using FRP from the Advanced Baseline Imager (ABI) on GOES-R (Geostationary Operational Environmental Satellites-R) by comparing with the Sentinel 5 Precursor TROPOspheric Monitoring Instrument (TROPOMI) Carbon Monoxide (CO) over 41 wildfires across the United States during July 2018—October 2019. All the ABI FRP-based CO and TROPOMI CO emissions were significantly correlated and showed a very good agreement with a coefficient of determination of 0.94 and an accuracy of 13–18%. We further reported a CO emission coefficient of 29.92 ± 2.39 g MJ−1 based on ABI FRP and TROPOMI CO, which can be used to directly estimate BBE from FRP observed from satellites. Based on the CO emission coefficient and ABI FRP, we finally estimated a monthly mean CO of 596 Gg across the Conterminous United States for June—September 2018.
Export citation and abstract BibTeX RIS

Original content from this work may be used under the terms of the Creative Commons Attribution 4.0 license. Any further distribution of this work must maintain attribution to the author(s) and the title of the work, journal citation and DOI.
1. Introduction
Global fires emit a very large amount of trace gases and aerosols that significantly influence climate (Tosca et al 2013) and degrade air quality (Johnston et al 2012). Biomass-Burning Emissions (BBE) have been estimated conventionally using knowledge of burned area, fuel loads, combustion coefficient, and emission factors since the 1980s (Seiler and Crutzen 1980, van der Werf et al 2017). Yet large uncertainties in these parameters limit the accuracy of emissions estimation (Randerson et al 2012). For instance, burned area from MODIS (Moderate Resolution Imaging Spectroradiometer), which has been widely used in conventional emission inventories, is underestimated by up to 80% in Africa compared with the Landsat-8 and Sentinel-2 based burned area (Roteta et al 2019, Roy et al 2019). BBE have also been estimated using inverse modeling by constraining chemical transport models (CTMs) with satellite observations of certain emissions species [e.g. carbon monoxide (CO) from Measurements Of Pollution In The Troposphere (MOPITT)] (Heald et al 2004, Shindell et al 2006, Duncan et al 2007, Jones et al 2009, Kopacz et al 2010, Jiang et al 2017). The inverse modeling and CTMs involve the configuration of many physical, chemical, and meteorological variables and generally make assumptions of biases and uncertainties in these variables (Shindell et al 2006, Duncan et al 2007). Because different assumptions could lead to significant systematic errors of inverse models (Heald et al 2004, Shindell et al 2006), the accuracy of BBE estimation could be influenced by >20% globally (Jiang et al 2011, 2013) and >80% regionally (Jiang et al 2013).
Fire radiative power (FRP), the instantaneous radiative energy emitted from fire, has been shown to be a reliable method to estimate BBE. Lab and small-scale field experiments have demonstrated that FRP can be empirically related to biomass combustion rate via combustion factor (Wooster et al 2005, Freeborn et al 2008) and smoke emissions rate via emission coefficient (Ichoku and Kaufman 2005, Freeborn et al 2008, Ichoku et al 2008), which has been further confirmed in landscape wildfires (Kremens et al 2012, Li et al 2018, Mota and Wooster 2018, Lu et al 2019). These empirical relationships enable direct calculation of the amount of consumed biomass or emitted emissions during a fire event using temporally integrated FRP (termed fire radiative energy or FRE) observed from satellites. Although satellite-based FRP has been increasingly used to estimate regional-to-global fire emissions in the past decade (Vermote et al 2009, Kaiser et al 2012, Zhang et al 2012, Ichoku and Ellison 2014, Darmenov and da Silva 2015, Roberts et al 2015, Mota and Wooster 2018, Li et al 2019), the parameters that convert FRP to BBE differ significantly among different studies and the widely used FRP observations from polar-orbiting sensors (e.g. MODIS) are not able to characterize the diurnal variation of fires that is a crucial element of computing BBE. As a result, BBE estimates in different products vary by a factor of up to 10 (Zhang et al 2014a, Li et al 2019, Carter et al 2020). The accuracy of BBE is usually assessed by applying BBE to predict aerosol optical depth (AOD) using CTMs and then comparing the model predicted AOD with independent observations such as ground-based sunphotometer measurements or satellite-derived AOD (Zhang et al 2014a, Carter et al 2020). Similarly, BBE estimates are also evaluated using trace gases such as CO or carbon oxide (CO2) from other independent observations (Pechony et al 2013, Huijnen et al 2016, Heymann et al 2017, Dekker et al 2019). However, this evaluation approach is significantly limited by uncertainties in the model prediction of AOD (Curci et al 2015, Das et al 2017) and concentrations of trace gases (Jiang et al 2011, 2013). Therefore, full validation of the FRP-based BBE is critical but remains challenging. This is primarily due to the lack of high-quality measurements of fire emissions as a reference on a large scale.
Here we propose a new approach to evaluate the FRP-based BBE and derive smoke emission coefficient using observations at relatively fine spatiotemporal resolutions from two new satellite instruments: the Advanced Baseline Imager (ABI) on the latest GOES-R (Geostationary Operational Environmental Satellites—R Series) and the TROPOspheric Monitor Instrument (TROPOMI) on the Copernicus Sentinel 5 Precursor (Sentinel-5P). Specifically, we selected 41 wildfires with isolated fresh smoke plumes across the Conterminous United States (CONUS) during July 2018—October 2019. The FRE and BBE for each wildfire were calculated from the 2-km ABI observations every 5 min and the total mass of fire CO emissions was directly obtained from the 7-km TROPOMI CO data. Then, the ABI FRP-based BBE was evaluated using TROPOMI CO and the CO emission coefficient was further derived based on TROPOMI CO and ABI FRE. Finally, the derived CO emission coefficient and ABI FRP were used to estimate the CO emissions across the CONUS, which were compared with three satellite active fire data based BBE inventories: the Fire Inventory from NCAR (FINN), the Global Fire Assimilation System (GFAS), and the Quick Fire Emissions Dataset (QFED).
2. Data
2.1. GOES-16 ABI FRP
The GOES-R ABI detects fires at a nominal spatial resolution of 2 km (at nadir). GOES-16, the first GOES-R satellite positioned at 75.2° W, has been operationally running since December 2017. GOES-16 ABI scans the CONUS every 5 min with a pixel area increasing from 4.8–16.8 km2 as satellite view zenith angle (VZA) varies from 29–72°. GOES-16 ABI detects fires using the 3.9-μm and 11.2-μm bands and provides for each fire pixel the detection time, geolocation, fire temperature, fire area, FRP (MW per pixel), and fire mask quality flag (Schmidt et al 2013). FRP is calculated using radiances of a fire pixel and its ambient background non-fire pixels in the 3.9-μm band (Schmidt et al 2013). The fire detection performance of GOES-16 ABI has been evaluated using the 30-m Landsat-8 and 375-m VIIRS (the Visible Infrared Imaging Radiometer Suite) active fire data and ground fire records (Hall et al 2019, Li et al 2020), which shows that GOES-16 ABI is able to confidently detect fires with FRP >34.5 MW (Li et al 2020). Compared with the 750-m VIIRS FRP, GOES-16 ABI FRP is relatively larger in individual fires but generally comparable at a regional scale across the southeastern CONUS (Li et al 2020). This study obtained GOES-16 ABI active fire data during July 2018—October 2019 from NOAA Comprehensive Large Array-data Stewardship System (CLASS) (https://www.avl.class.noaa.gov/; last accessed on 3 April 2020).
2.2. Sentinel-5P TROPOMI CO and aerosol index
Sentinel-5P TROPOMI observes global CO at a nominal spatial resolution of 7 km. Sentinel-5P crosses the equator at ∼13:35. TROPOMI senses earth reflected radiances over a scan angle range of ±54° with a swath width of ∼2600 km (Veefkind et al 2012). TROPOMI CO is retrieved using radiances in the shortwave infrared bands (SWIR, 2305–2385 nm) based on the Shortwave Infrared CO Retrieval (SICOR) algorithm (Vidot et al 2012, Landgraf et al 2016). The ground pixel size of SWIR bands is generally consistent (7 km) in the along-track direction but varies from 7 km at nadir to 34 km at the scan edge in the across-track direction (Veefkind et al 2012). The 7-km TROPOMI Level 2 CO product provides for each pixel observation time, coordinates (longitude and latitude), satellite VZA, solar zenith angle, CO total column density (mol m−2), and retrieval precision. The vertical sensitivity of the CO total column density retrievals depends on the total column averaging kernels that are sensitive to clouds (Borsdorff et al 2018a). The averaging kernel of the CO total column density across the globe in clear-sky conditions has been demonstrated to be close to 1.0 at all altitudes, which suggests that the CO total column retrievals represent the true CO total columns very well (Borsdorff et al 2018a). The validation also shows that TROPOMI CO data agree with ground-based CO observations and model-simulated CO data well (Borsdorff et al 2018b, 2018c).
The TROPOMI sensor also senses aerosols using the ultraviolet bands (UV). The ground pixel size of TROPOMI UV bands is 7 km in the along-track direction and varies from 3.5 km at nadir to 15 km at the scan edge in the cross-track direction, which is ∼2 times finer than the SWIR bands (Veefkind et al 2012). The TROPOMI Level 2 aerosol index (AI) product calculates AI based on the 354/388 nm and 340/380 nm pair bands (Apituley et al 2018). A positive AI indicates the presence of absorbing aerosols (i.e. smoke from fires, and volcanic ash, and dust). Thus, this study obtained the TROPOMI Level 2 CO and AI products for the period from July 2018–October 2019 from the Copernicus Sentinel-5P pre-operations data hub (https://s5phub.copernicus.eu/; last accessed on 3 April 2020).
2.3. Terra MODIS and S-NPP VIIRS true-color imageries
The true-color (RGB) images from Terra MODIS and VIIRS onboard S-NPP (the Suomi National Polar-Orbiting Partnership) are obtained to identify visually interpretable fresh smoke plumes. The daily global true-color composites based on MODIS and VIIRS surface reflectance are available on the NASA (National Aeronautics and Space Administration) Worldview tool (https://worldview.earthdata.nasa.gov/).
2.4. Three BBE inventories
The FINN, GFAS, and QFED emissions inventories provide daily global fire emissions, including CO, based on the 1-km MODIS active fire data (Wiedinmyer et al 2011, Kaiser et al 2012, Darmenov and da Silva 2015). The FINN inventory estimates emissions at the fire pixel level using the conventional bottom-up method, with the parameters-burned area and fuel consumption calculated in each MODIS fire detection (Wiedinmyer et al 2011). The GFAS calculates emissions using MODIS FRP and the land cover specific FRE combustion factors that are derived by relating MODIS FRP to the dry matter combustion ratio from the Global Fire Emission Database (GFED3.1) (Kaiser et al 2012). The QFED estimates emissions using MODIS FRP and emission coefficients that are derived in two steps: first obtain initial factors by relating MODIS FRP to GFED emissions in four biomes, and then adjust the initial factors by comparing the model-simulated AOD with MODIS AOD (Darmenov and da Silva 2015). This study obtained the FINN v1.5 (http://bai.acom.ucar.edu/Data/fire/; last accessed on 18 May 2020), the GFAS v1.2 (https://apps.ecmwf.int/datasets/data/cams-gfas/; last accessed on 18 May 2020), and the QFED v2.5r1 (https://portal.nccs.nasa.gov/datashare/iesa/aerosol/emissions/QFED/v2.5r1/0.1/; last accessed on 18 May 2020) emissions data for the period from June to September 2018.
3. Methods
3.1. Selection of fire events with fresh smoke plumes
Fire events with fresh smoke plumes were selected based on active fire data from GOES-16 ABI and natural color imageries from both Terra MODIS and S-NPP VIIRS. Specifically, the ABI fire detections with valid FRP were first used to locate potential fire events. Then for each fire event the VIIRS natural color reflectance composite was employed to examine if the fire released any visually interpretable smoke plumes that contrast sharply with background and are not contaminated by clouds and smoke from other fire events. Meanwhile, Terra MODIS natural color reflectance was used to determine the age of smoke plumes. In this study, we define that a smoke plume is fresh if it is released within a few hours (i.e., 3 h) of TROPOMI overpass. Because Terra MODIS overpasses (10:30) the same area ∼3 h earlier than S-NPP VIIRS (13:30) and Sentinel-5P TROPOMI (13:35), a fire event is selected if the Terra MODIS reflectance composite shows no smoke plumes (or smoke with very limited size) associated with the fire but VIIRS reflectance shows very clear smoke plumes. Figures 1(a)–(f) shows the selection process of two fires in northern Colorado on 22 September 2018, where the associated two smoke plumes released after Terra MODIS overpass were observed by S-NPP VIIRS and further confirmed by ABI active fire detections and TROPOMI aerosol index data.
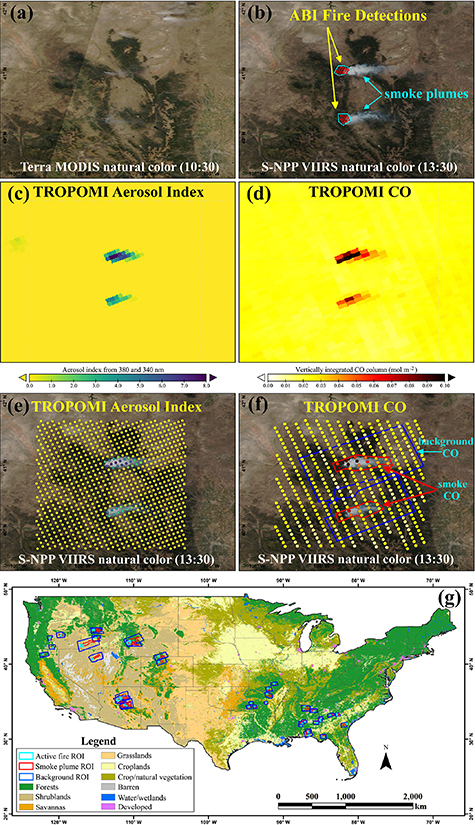
Figure 1. Selection of fire events with fresh smoke plumes. (a–d) illustrate an example of selecting two fires occurred at northern Colorado on 22 September 2018, and (g) shows the spatial distribution of the selected 41 fires across the CONUS during the period from July 2018 to October 2019. (a) Terra MODIS true-color composite observed at 10:30. (b) Two fire events confirmed by ABI active fire detections (red dots delineated by cyan polygons) overlain on S-NPP VIIRS true-color composite (observed at 13:30). (c–d) Aerosol index (based on 380/340 nm pair) and CO total column over the same region as in (a–b) observed by TROPOMI at 13:35. (e–f) Pixels of TROPOMI aerosol index and CO are represented by points at their centers for manually delineating smoke and non-smoke background pixels, which use the same legend as in (c–d), with the smoke plumes and non-smoke background delineated by red and blue polygons, respectively.
Download figure:
Standard image High-resolution imageThe selected fire events were further refined using TROPOMI CO. During data exploration, we found that the TROPOMI Level 2 CO product could fail to provide valid CO retrievals for a few smoke pixels close to fire fronts over very large and intense fires. Thus, any selected fires with invalid CO observations were excluded. As a result, a total of 41 wildfires were finally extracted and they are mainly forest fires (figure 1(g)). For each selected fire, TROPOMI AI data were used to discriminate smoke plumes from the background, and CO observations inside the boundaries of a smoke plume were extracted as smoke CO (figures 1(e) and (f)). The smoke plume boundaries were then expanded outward by a distance of at least three CO observations (∼21 km = 7 km × 3 pixels), and the CO observations located at the region between smoke plume boundaries and the expanded boundaries were extracted as the background non-smoke CO (figure 1(d)). As the background pixels were not contaminated by clouds or smoke from other fires, the CO total column retrievals in the clear-sky observation conditions are able to well represent the true CO total columns (Borsdorff et al 2018a). Because the TROPOMI Level 2 CO data measure vertically integrated CO total column above land/water surface, TROPOMI CO over either smoke or background pixels also contains CO from other sources, including oxidation from methane and biogenic volatile organic compounds (VOCs), etc.
3.2. Comparison of the ABI FRP-based CO with TROPOMI CO
The total mass of fire smoke CO emissions was calculated using TROPOMI CO observations for each of the selected 41 fires. Because smoke plumes of the selected fires were just released within a few hours of the TROPOMI observation time, we assume that oxidation of the CO emissions during such a short period is negligible because atmospheric CO has a lifetime of about two months at middle latitudes (Khalil and Rasmussen 1990). Following the method used by (Heymann et al 2017), for each selected fire we first calculated background CO density by averaging the CO total column density of all the extracted non-smoke background CO pixels to account for non-fire contributions to the observed CO. Then the total mass of the fire-released CO emissions is calculated using TROPOMI CO observations as:
where COt is the fire-released CO total mass (g) observed by TROPOMI, n is the number of TROPOMI CO pixels inside the associated smoke plume boundaries for a given fire,  is the observed CO total column density (mole m−2) of the ith TROPOMI smoke CO pixel,
  is the mean CO total column density (mole m−2) of the non-smoke background pixels,
  is pixel area (m2) of the ith smoke CO pixel, and M is CO molecular mass (28.01 g mol−1).
To examine the enhancement of CO over each fire smoke plume against the non-smoke background, we also calculated the dry-air CO total column mixing ratio (in units of parts per billion volume, abbreviated as ppbv) based on the TROPOMI CO total column density and the co-located surface pressure by following the method in Borsdorff et al (2018a). For the sake of simplicity, the CO column mixing ratio is referred to as the dry-air CO total column mixing ratio.
The total mass of the CO emissions was also calculated based on 5-min FRP retrievals from GOES-16 ABI using an FRE biomass combustion factor. (Wooster et al 2005) derived an FRE biomass combustion factor of 0.368 kg MJ−1 in a field experiment that has been commonly used to estimate regional-to-global biomass consumption and emissions (Zhang et al 2012, Roberts et al 2015). (Li et al 2018) reported an FRE combustion factor of 0.320 kg MJ−1 for the CONUS wildfires based on FRP from MODIS and GOES and the Landsat-based biomass consumption. For each selected fire, the total mass of the CO emissions was calculated using these two combustion factors separately:

where  is FRP-based CO total mass (g), FRE is the ABI FRP-based fire radiative energy (MJ), B is the FRE biomass combustion factor, and F is the CO emission factor (89 g kg−1 for temperate forests; Akagi et al 2011). By assuming that fire intensity is generally consistent within 5 min, the total radiative energy FRE is calculated using 5-min ABI FRP as:
where, given a fire with a total number of q ABI fire detections, FREk is the fire radiative energy (MJ) observed at the kth ABI fire pixel during a burning period from t1 to t2. t1 is set as the observing time of the first valid GOES-16 ABI fire observation at the kth fire pixel and t2 is the TROPOMI overpass time. FRPk(t) is ABI FRP at observing time t (t ∈ (t1, t2)).
Then, the ABI FRP-based CO total mass estimates were compared statistically with the observed TROPOMI CO total mass estimates over the selected 41 fires using the ordinary least squares (OLS) regression.
Finally, the CO emission coefficient that converts FRP to the mass of the CO emissions was also derived from ABI FRE and TROPOMI CO observations using the following formula:

where COt is the fire-released CO total mass (g) observed by TROPOMI, FRE is the ABI FRP-based fire radiative energy (MJ), and Ce is CO emissions coefficient (g MJ−1). The CO emission coefficient was statistically calculated from 41 fire events using the OLS regression.
3.3. Comparison of the ABI FRP-based CO with the FINN, GFAS, and QFED CO
The CO emissions across the CONUS were estimated using ABI FRP and the derived CO emissions coefficient (Ce) at a grid resolution of 0.25° for the four months from June to September 2018. The result was compared with the CO emissions from the FINN, GFAS, and QFED fire emissions inventories. The four months from June to September cover the typical fire season in the west CONUS where large wildfires are usually widespread (Zhang et al 2014b, Balch et al 2017). Specifically, for each ABI fire pixel, the daily FRE was first calculated by integrating the 5-min ABI FRP and then applied to calculate the daily CO emissions using the equation (4). The daily pixel-level CO emissions were further aggregated in a 0.25° grid and at an interval of one month. Finally, the ABI FRP-based monthly CO emissions were compared with the CO emissions from the FINN, GFAS, and QFED inventories.
4. Results and discussion
4.1. TROPOMI CO over smoke plumes and background
Smoke plumes show significantly higher CO concentration than the non-smoke background (figure 2). Over the selected 41 fires, the CO column mixing ratio of smoke plumes on average was 47 ppbv higher than that of the background, which represents a CO mixing ratio enhancement of 51%. The largest enhancements of 164% (135 ppbv) and 261% (190 ppbv) were seen over two fires in Idaho State. The CO enhancements were in similar ranges to the ground- and airborne-measured CO enhancement over wildfires in the western CONUS and North America boreal regions (Val Martín et al 2006, Ditas et al 2018). The mean CO mixing ratio enhancement was 79% in the western CONUS while it was 27% in the eastern CONUS. The large difference is partly due to the difference in the background CO between the two regions. The mean background CO column mixing ratio in the eastern CONUS (113 ppbv) is approximately 138% of that in the western CONUS (82 ppbv), which is consistent with the pattern based on long-term MOPITT CO observations (Deeter et al 2012, Jiang et al 2018). This is primarily attributed to the much larger contributions from anthropogenic and biogenic CO sources in the eastern CONUS (Hudman et al 2008, Jiang et al 2018).
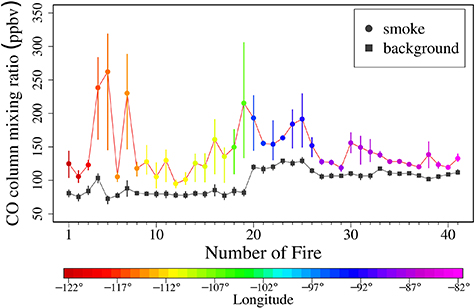
Figure 2. The TROPOMI CO column mixing ratios of the smoke plumes (colored cycles) and the non-smoke background (black squares) over the selected 41 fires. From left to right, fire samples are plotted along the longitude in the west-to-east direction, with colored circles and black squares representing the mean CO column mixing ratios of the smoke plumes and the background, respectively, and the error bars showing the CO column mixing ratio at percentiles 20% and 80% (error bars are not shown for a few eastern CONUS fires where smoke CO pixels are few).
Download figure:
Standard image High-resolution image4.2. The ABI FRP-based CO versus TROPOMI CO
The ABI FRP-based CO estimates agree well with the TROPOMI CO estimates (figure 3). Over the selected 41 fires, the total mass of the CO emissions estimated via the two FRE biomass combustion factors (equation (2)) was 0.001–6.78 Gg and 0.001–5.90 Gg, which has a similar magnitude to the TROPOMI CO based total mass: 0.015–6.21 Gg. The ABI FRP-based CO was significantly correlated to the observed TROPOMI CO (R2 = 0.94, p-value < 0.001). When an FRE biomass combustion factor of 0.368 kg MJ−1 was applied, the FRP-based CO was overall slightly larger than TROPOMI CO by up to 18% at a 95% confidence interval, with an RMSE (root mean square error) of 0.3. For some relatively small fires, the FRP-based CO was smaller than TROPOMI CO, as indicated by the small negative bias. Similarly, the FRP-based CO via an FRE combustion factor of 0.320 kg MJ−1 was overall slightly smaller than TROPOMI CO by up to 13% at a 95% confidence interval, with an RMSE of 0.3. Although the ABI and TROPOMI sensors provide unprecedented spatiotemporal resolution observations of fires and smoke emissions, the accuracy of the associated FRP and CO data could influence CO estimates for individual fires. However, the very good agreement between the ABI FRP-based CO and TROPOMI CO estimates over the 41 fires across the CONUS confirms the robustness of the FRP-based method for BBE estimation via FRE biomass combustion factors. The small difference (−13% – +18%) between the FRP-based CO and TROPOMI CO suggests that for the CONUS forest wildfires the uncertainty of the FRP-based BBE via the two FRE combustion factors is limited within 18%. This differs from the previous finding that BBE estimated via FRE combustion factor are largely underestimated and an increase of BBE by a factor of several times is needed to reduce the underestimation (Kaiser et al 2012, Darmenov and da Silva 2015).
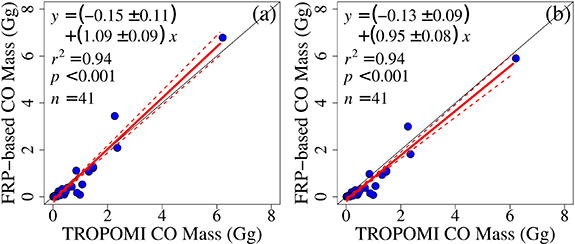
Figure 3. Comparisons of the observed TROPOMI CO and the ABI FRP-based CO estimated using two FRE biomass combustion factors: (a) 0.368 kg MJ−1 and (b) 0.320 kg MJ−1. The red solid and dash lines represent the best-fit model and 95% confidence intervals, and the black solid line is 1:1 line.
Download figure:
Standard image High-resolution image4.3. Comparison of CO emission coefficient with other studies
Figure 4 shows a CO emission coefficient of 29.92 ± 2.39 g MJ−1 based on ABI FRE and TROPOMI CO over the selected 41 fires. The coefficient of determination indicates that 94% of the variation in CO could be explained by ABI FRE, which also implies that the derived CO emission coefficient can be used to calculate the CO emissions from FRP without bias and with limited uncertainties.
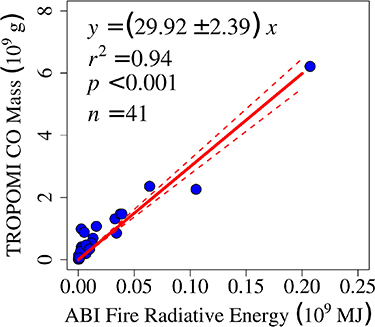
Figure 4. The CO emission coefficient based on ABI FRE and TROPOMI CO. The red solid and dash lines are the best-fit model and 95% confidence intervals.
Download figure:
Standard image High-resolution imageCO emission coefficient has been derived in several previous studies to directly estimate BBE using satellite-based FRP. In the published literature, CO emission coefficient has been derived directly by correlating lab-measured rate of the CO emissions to FRP (or mass of CO to FRE; Freeborn et al 2008) or indirectly inferring from the TPM (total particulate matters) emission coefficient based on the ratio of CO and TMP emission factors (Mota and Wooster 2018). Our CO emission coefficient is very close to the lab-based CO emission coefficient (33.71 g MJ−1; Freeborn et al 2008). However, the CO emission coefficient converted from the AOD-derived TPM emission coefficient is much larger. (Mota and Wooster 2018) reported a CO emission coefficient of 142 g MJ−1 based on MODIS AOD and FRP from SEVIRI (Spinning Enhanced Visible and Infra-red Imager) in open-canopy forest fires in Africa. Similarly, (Ichoku and Ellison 2014) and (Lu et al 2019) separately showed a TPM emissions coefficient of 40 g MJ−1 and 21.73 g MJ−1 for the CONUS forest fires based on MODIS FRP and AOD data, which corresponds to a CO emission coefficient of 193 g MJ−1 and 105 g MJ−1. One potential issue in deriving AOD-based CO emission coefficients is the uncertainties of the smoke mass extinction coefficient that converts AOD to TPM. The mass extinction coefficient varies between 2.22 and 7.6 m2 g−1 as smoke ages, which has been discussed in (Mota and Wooster 2018). Moreover, previous studies also showed that the BBE estimated via the AOD-based coefficients is larger than BBE estimates calculated via FRE biomass combustion factor by a factor of several times (Zhang et al 2014a, Li et al 2019, Carter et al 2020). As a result, it is reasonable to deduce that combining ABI FRE and TROPOMI CO could provide a much reliable CO emission coefficient.
4.4. The ABI FRP-based CO emissions across the CONUS
Figure 5 shows the spatial patterns of the ABI FRP-based monthly CO emissions across the CONUS from June to September 2018. During this period, fires occurred in most regions of the CONUS but the fire-released CO emissions varied significantly spatially. Fires in the western CONUS accounted for 82%, 92%, 95%, and 93% of the monthly total CO emissions across the CONUS in the four months, respectively. In the same period, however, fires in the eastern CONUS released a relatively very limited amount of the CO emissions, which were mainly contributed by fires across the southeastern CONUS. This is consistent with the previous finding that the majority portion of the CONUS emissions is from fires across the western CONUS during the summer months (Urbanski et al 2018, Li et al 2019).
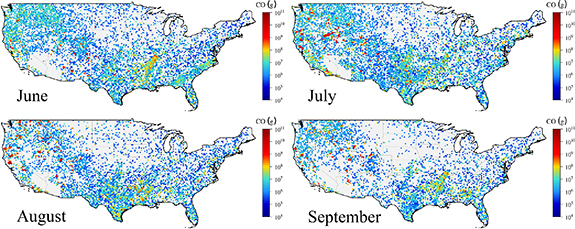
Figure 5. The ABI FRP-based monthly CO emissions in a 0.25° grid across the CONUS from June to September 2018.
Download figure:
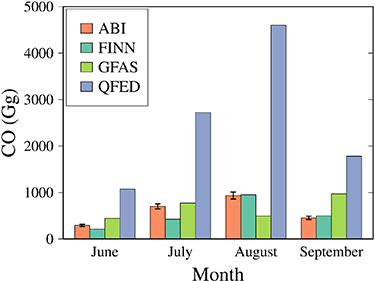
Standard image High-resolution imageThe ABI FRP-based CO emissions provide a good reference for evaluating the CO emissions from the existing fire emissions inventories. Figure 6 shows the monthly total CO emissions based on ABI FRP and from the FINN, GFAS, and QFED emissions inventories across the CONUS. In the four months from June to September, the ABI FRP-based monthly CO emissions were 294 (±23) Gg, 702 (±56) Gg, 934 (±75) Gg, and 455 (±36) Gg, respectively. In comparison with the three inventories, the ABI FRP-based monthly CO emissions on average were very similar to the FINN and GFAS CO, with a mean difference of less than 13%, but differed from the QFED CO by a factor of approximately four. Although the mean of the ABI FRP-based monthly CO emissions (596 Gg) was comparable with that of the GFAS CO (670 Gg), the ABI FRP-based CO and the FINN and QFED CO peaked in August while the GFAS CO peaked in September and was the smallest in August among all the four CO datasets. Further, previously published studies also found that the QFED emissions were much larger than the other emissions inventories across the CONUS and other regions, with a difference of 2–6 times (Li et al 2019, Carter et al 2020, Pan et al 2020). The large discrepancies are most likely associated with the fact that the QFED emissions are significantly enlarged by the MODIS AOD based scaling factors (Carter et al 2020).
Figure 6. Monthly CO emissions based on the ABI FRP and from the FINN, GFAS, and QFED emissions inventories. The error bars represent one standard deviation of the ABI FRP-based CO emissions.
Download figure:
Standard image High-resolution image
Potential uncertainties in the ABI FRP-based CO emissions estimates could arise from the omission errors in the ABI fire detection and the application of the single CO emission coefficient. First, the GOES-16 ABI sensor could miss very small and/or cool fires at large view angles in the northwestern CONUS because of the decrease in pixel resolution although its high temporal resolution significantly improves the fire detection capability (Li et al 2020). Luckily, the portion of small fires in the northwestern CONUS is much smaller than that in the southeastern CONUS (Randerson et al 2012) where the ABI sensor has a fire detection capability comparable to the VIIRS sensor (Li et al 2020). Thus, the uncertainty of the ABI FRP-based CO due to the omission errors of the ABI fire detections could be relatively small. Second, the CO emissions across the CONUS in this comparison were calculated using the single CO emission coefficient that was derived based on the TROPOMI CO over mostly forest fires (figure 4). For other types of fires (e.g. agricultural burnings), the CO emission coefficient could be different, which could introduce certain uncertainties in the CO emissions estimates. However, this effect could be limited in this comparison because fires, especially large forest wildfires, in the western CONUS contributed to the majority portion (82% in June and >90% in the following three months) of the CO emissions across the CONUS.
5. Conclusions
Accurate and timely estimation of BBE is crucial for understanding the role of biomass burning in the atmosphere and biosphere. Satellite-based FRP provides an effective way to estimate fire emissions at a regional-to-global scale. Because of the lack of direct and good-quality observations of BBE, current BBE estimates from satellite data are generally not fully validated. This study proposed a new algorithm to make a reliable and applicable evaluation of fire emissions estimates, which is to select fresh fire events detected by TROPOMI. As a result, this study evaluated the FRP-based method for fire emissions estimation using the 7-km Sentinel-5P TROPOMI CO and 2-km GOES-16 ABI FRP observations every 5 min over 41 fresh fires occurred during July 2018—October 2019 across the CONUS. The results show that smoke plumes on average enhance CO emissions by 51% compared with the non-smoke background over the 41 fires, and the ABI FRP-based CO estimates are significantly correlated to the TROPOMI CO with an overall difference of 13–18%. This result confirms that fire emissions can be well estimated from the FRE biomass combustion factors. Additionally, based on ABI FRE and TROPOMI CO, this study reports a CO emission coefficient of 29.92 ± 2.39 g MJ−1, which is very close to the one derived in the lab experiment. This coefficient, combined with ABI FRP, was further used to estimate the CO emissions across the CONUS during the 2018 summer months. The ABI FRP-based CO emissions provide a direct reference for evaluating the existing BBE inventories, which helps us understand the large discrepancies among the existing BBE inventories. Mitigating the uncertainty in BBE estimation could significantly improve the predictions of air quality and radiative effect(Vongruang et al 2017, Carter et al 2020). The algorithm proposed in this study is expected to be expanded to other fire-prone regions where high temporal resolution FRP observations from the latest geostationary sensors (e.g. ABI, SEVIRI, and the Advanced Himawari Imager) are available. The high-spatiotemporal-resolution observations of the fire-released atmospheric pollutants from the advanced instruments like the Geostationary Environment Monitoring Spectrometer (GEMS; Kim et al 2020) and the Tropospheric Emissions: Monitoring of Pollution (TEMPO; Zoogman et al 2017) will make it possible to examine the diurnal variation of emissions coefficients, which could further improve the accuracy of BBE estimation and advance our understanding of the effects of BBE on climate, weather and environmental conditions, and human health.
Acknowledgments
This study is supported by NOAA contract NA14NES4320003 and NASA contract 80NSSC18K0235. We thank NOAA for providing GOES-16 ABI active fire data and Copernicus for providing Sentinel-5P TROPOMI CO data. The ABI active fire data and TROPOMI CO and aerosol index data are freely available for public access at NOAA CLASS (https://www.avl.class.noaa.gov/; last accessed on 3 April 2020) and the Copernicus Sentinel-5P pre-operations data hub (https://s5phub.copernicus.eu//; last accessed on 3 April 2020). We also thank the groups of the FINN (http://bai.acom.ucar.edu/Data/fire/; last accessed on 18 May 2020), GFAS (https://apps.ecmwf.int/datasets/data/cams-gfas/; last accessed on 18 May 2020), and QFED (https://portal.nccs.nasa.gov/datashare/iesa/aerosol/emissions/QFED/v2.5r1/0.1/; last access on 18 May 2020) for making the products available. We thank two anonymous reviewers for their constructive comments that improved this work. The views, opinions, and findings contained in this manuscript are those of the author(s) and should not be interpreted as an official NOAA or U.S. government position, policy, or decision.
Data availability statement
All data that support the findings of this study are included within the article (and any supplementary information files).