

Abstract
Under global warming, changes in extreme temperatures will manifest in more complex ways in locations where temperature distribution tails deviate from Gaussian. Confidence in global climate model (GCM) projections of temperature extremes and associated impacts therefore relies on the realism of simulated temperature distribution tail behavior under current climate conditions. This study evaluates the ability of the latest state-of-the-art ensemble of GCMs from the Coupled Model Intercomparison Project phase six (CMIP6), to capture historical global surface temperature distribution tail shape in hemispheric winter and summer seasons. Comparisons with a global reanalysis product reveal strong agreement on coherent spatial patterns of longer- and shorter-than-Gaussian tails for both sides of the temperature distribution, suggesting that CMIP6 GCMs are broadly capturing tail behavior for plausible physical and dynamical reasons. On a global scale, most GCMs are reasonably skilled at capturing historical tail shape, exhibiting high pattern correlations with reanalysis and low values of normalized centered root mean square difference, with multi-model mean values generally outperforming individual GCMs in these metrics. A division of the domain into sub-regions containing robust shift ratio patterns indicates higher performance over Australia and an overestimation of the degree to which tails deviate from Gaussian over southeastern Asia in all cases, whereas model skill over other regions varies depending on season and tail of the temperature distribution. For example, model performance during boreal winter indicates robust agreement (>85% models) with reanalysis for shorter-than-Gaussian warm tails over the Northern Hemisphere, whereas cold-tail shape is generally mischaracterized by GCMs over western Russia. Although there is spatial and model variability, overall, results highlight the capability of the CMIP6 ensemble in capturing seasonal temperature distribution deviations from Gaussianity, boosting confidence in model utility and providing insight into the complexity of future changes in temperature extremes.
Export citation and abstract BibTeX RIS
1. Introduction
Extreme warm and cold temperatures are associated with a multitude of impacts on society and the environment, including crop yield reduction, infrastructure damage, and human health concerns (Kunkel et al 1999). The severity of these impacts may change under future warming, as global projections indicate increases and decreases in the frequency of exceeding current-climate extreme warm and cold thresholds, respectively (IPCC, 2013). Also, regional variability in the rate and magnitude of changes in temperature extremes is likely, with changes manifested in more complex ways for locations with non-Gaussian temperature distributions than normal distributions (e.g. Ruff and Neelin 2012, Huybers et al 2014, Sardeshmukh et al 2015, Guirguis et al 2017). It is therefore critical that the current generation of global climate models (GCMs) used to project changes in temperature extremes, the sixth phase of the Coupled Model Intercomparison Project (CMIP6; Eyring et al 2016), realistically reproduces the observed shape of underlying temperature distributions.
Spatially coherent regions of shorter- and longer-than-Gaussian warm and cold temperature distribution tails have been documented across the globe (Loikith et al 2018, Loikith and Neelin 2019). Following a warm shift applied uniformly to the temperature distribution, the simplest prototype of future warming, a region with a short tail would experience a more-rapid-than-Gaussian change in the frequency of exceeding a fixed temperature threshold, whereas a region with a long tail would experience a less rapid change (Ruff and Neelin 2012, Loikith and Neelin 2015). (Loikith et al 2018) found this relationship generally holds under GCM projections of near-term warming for short warm-side tails. (Loikith and Neelin 2019) also demonstrated that departures from Gaussianity on the cold side of the temperature distribution in the extratropics are related to the large-scale circulation features that produce extreme temperatures. This finding suggests model ability to capture non-Gaussian tails may be linked to realistic representation of circulation dynamics, errors in both of which contribute to uncertainty in simulated extremes. Therefore, it is essential that climate models adequately resolve tail Gaussianity under current climate conditions to boost confidence in projections of future changes in temperature extremes and associated impacts.
The distribution of surface temperatures simulated by the previous generation of GCMs from phase five of the Coupled Model Intercomparison Project (CMIP5; Taylor et al 2012) have been evaluated extensively. Using a set of climate indices, (Sillmann et al 2013) concluded that the simulation of daily temperature and precipitation extremes in CMIP5 improves upon its predecessor, CMIP3, and the multi-model ensemble mean outperforms individual models in root-mean-squared error metrics with reanalysis products. The CMIP5 ensemble also broadly captures the interannual variability in observed minimum, mean, and maximum temperatures both globally and regionally (Lewis and Karoly 2013). Results from model assessments increase confidence in CMIP5 projections in temperature, extremes, and associated changes in climate, while also identifying spatial biases and their implications. Over Europe, (Cattiaux et al 2013) determined that biases in extreme temperatures do not scale with biases in mean temperatures, as CMIP5 GCMs overestimated the frequency of extremes compared with that expected from the mean. However, this result was predicated on the assumption of an underlying Gaussian temperature distribution, but observations reveal coherent regions of non-Gaussian distribution tails over Europe for both the warm and cold sides of the distribution (Loikith et al 2018, Loikith and Neelin 2019). Thus, model fidelity in simulating temperature extremes relates to the shape of the distribution tail.
The latest state-of-the-art GCMs participating in phase six (CMIP6) have recently become available (Eyring et al 2016), requiring evaluation of basic climate properties. However, as the release of data is ongoing as of the writing of this manuscript, few multi-model studies have been published to date (Gusain et al 2019, Hsu and Yin 2019, Turnock et al 2019, Wang et al 2019). Existing work suggests that the previous phase, CMIP5, is capable of reproducing the principal spatial patterns of observed, shorter-than-Gaussian warm-side temperature distribution tails (Loikith et al 2018), but non-Gaussian cold-side distributions have not been explored in models. Therefore, this work provides a first examination of the ability of CMIP6 to capture tail shape on both sides of the temperature distribution with a focus on long and short tails, which provides a baseline from which to consider model skill in simulating changes in temperature extremes and associated impacts under future warming.
2. Data
Daily gridded data are obtained from the first ensemble member of all CMIP6 GCMs with available historical simulation output (downloaded as of November 12, 2019 from the Earth System Grid Federation database) for 2 m temperature, resulting in 20 models total (see supporting information table S1 (available online at stacks.iop.org/ERL/15/074026/mmedia)). The historical simulations are externally forced by freely evolving greenhouse gas emissions, solar variability, land-use changes, and aerosol emissions (Eyring et al 2016). Reference data is obtained from version two of NASA's Modern-Era Retrospective analysis for Research and Applications (MERRA-2; Gelaro et al 2017). MERRA-2 is the latest iteration of the reanalysis product and has been used in previous work analyzing temperature distribution tail Gaussianity (Loikith and Neelin 2019). To validate MERRA-2 results, the European Centre for Medium-Range Weather Forecasts reanalysis, ERA5 (developed through the Copernicus Climate Change Service 2017), is employed. Note, all datasets provide global 2 m temperature data, but we restrict analyses to land only as tail shape is a meaningful indicator of future exceedances for distributions that exhibit higher variance.
3. Methodology
Analyses are performed over an overlapping historical period (1980–2014) for two seasons comprised of June, July, and August (JJA), and December, January, and February (DJF). As spatial resolutions vary among GCMs and MERRA-2, all datasets are regridded to a common 1° × 1° latitude-longitude resolution using bilinear interpolation. Temperature anomalies are then computed by subtracting the daily climatological mean and linearly detrending to limit the influence of the warming signal in distribution shape. We examine the tails of the 2 m temperature anomaly distribution (warm-side and cold-side) during both JJA and DJF, yielding four cases for evaluation.
Non-Gaussian distribution tails are characterized here using a shift ratio as introduced in (Loikith and Neelin 2015). The shift ratio is computed as follows. First, the underlying daily temperature anomaly distribution is shifted uniformly to the right by 0.5σ. A value of 0.5σ provides a large enough shift to demonstrate the effect of non-Gaussian tails on changes in exceedances, and ensures that all distributions are shifted by the same amount relative to their underlying variance. Then, the frequency of days that exceed the pre-shifted threshold (95th percentile for warm-side tails and 5th percentile for cold-side tails) is tabulated and divided by the number of threshold exceedance days from shifting a Gaussian distribution by the same amount. For warm tails, if the ratio is greater than one, the distribution has a shorter-than-Gaussian tail, whereas if it is less than one, it has a longer-than-Gaussian tail (see figure 2 in Loikith and Neelin 2019 for schematic demonstration). For cold tails, the opposite condition is true. For example, a cold-side shift ratio of two indicates that under a uniform warm shift in the temperature distribution, there are twice as many cold exceedances below the pre-shifted 5th percentile than for a Gaussian, and a cold-tail shift ratio of one-quarter indicates only 25% of the number of exceedances that a Gaussian would exhibit are experienced, indicating a more rapid decrease in cold extremes in short-tailed regions. This approach specifically quantifies departures from Gaussianity in the tail, which differs from statistical moments such as skewness that describe asymmetry across the entire distribution. However, skewness generally provides a reasonable qualitative indicator of tail non-Gaussianity.
This shift ratio approach provides a pragmatic demonstration of the effect of non-Gaussian tails on changes in the frequency of exceeding fixed extreme temperature thresholds using the simplest prototype of future warming, a uniform rightward shift (actual warming may involve changes in higher moments of the distribution). Furthermore, as described in (Loikith and Neelin 2015), the shift ratio also provides a variant on the Kolmogorov-Smirnov/Lilliefors test for normality. Significance of tail deviations from Gaussian is assessed by randomly sampling a Gaussian distribution of equivalent length to the data 10 000 times and computing a shift ratio each time. If the actual shift ratio falls outside of the 5th to 95th percentile range of the randomly sampled shift ratio distribution, the distribution is determined to have a significantly non-Gaussian tail.
An important consideration is that data assimilation schemes differ among reanalysis products, leading to potential uncertainty in temperature distribution tail shape. However, (Loikith et al 2018) found that shift ratios computed using MERRA data compare well with those computed from available station observations. Also, a supplemental analysis of ERA5 yields shift ratios comparable to MERRA-2, although there are minor differences over small areas in northern Asia, southern Africa, and South America for certain cases (figure S1).
4. Results
4.1. Cold-side tail
Figure 1 displays MERRA-2 and CMIP6 multi-model ensemble mean (MMEM) global shift ratio values for temperature distribution cold-side tails, as well as a spatial map of model agreement. Warm colors refer to shorter-than-Gaussian distribution tails, and cool colors refer to longer-than-Gaussian tails. Black boxes specify selected sub-regions targeting principal patterns of non-Gaussian tails in MERRA-2, and are hereafter referred to as NAM (North America), EUR (Europe), NAS (northern Asia), SEA (southeastern Asia), AUS (Australia), SAF (southern Africa), and SAM (South America).
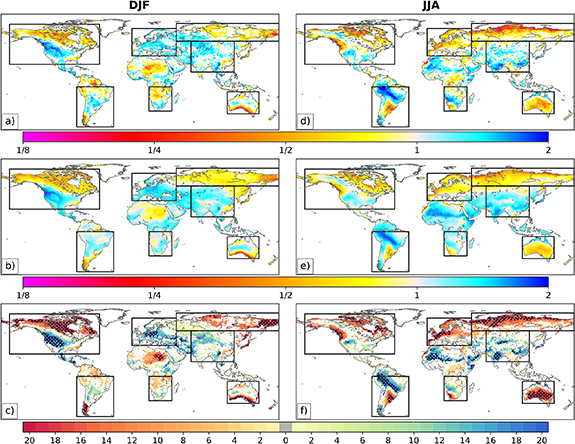
Figure 1. Temperature distribution cold-side tails: (a, d) MERRA-2 and (b, e) CMIP6 multi-model ensemble mean shift ratios over land using the 5th percentile as the fixed threshold to measure exceedances. Values greater than one indicate longer-than-Gaussian cold tails, and values less than one indicate shorter-than-Gaussian cold tails. Shading in the top row indicates tails that deviate from Gaussian with statistical significance at the 95% confidence level. Land areas without shading have cold tails that are not significantly different than a Gaussian. (c, f) Number of models in agreement with MERRA-2 on tail significance and shape (i.e. both significantly shorter- or longer-than Gaussian), with hatching over grid cells with at least 85% (⩾17) model agreement. Warm colors denote agreement on short tails, cool colors denote agreement on long tails, and gray shading denotes disagreement for all models (<3% of the domain). Left column is for the DJF seasonal analysis, and right column is for JJA. Boxes denote sub-regions selected for further analysis, labeled as NAM, EUR, NAS, SEA, AUS, SAF, and SAM moving clockwise from the upper left corner.
Download figure:
Standard image High-resolution imageIn MERRA-2, significantly shorter-than-Gaussian cold tails occur for DJF in northern NAM, eastern NAS, southern AUS, and southern SAM (figure 1(a)), signifying a more-rapid-than-Gaussian decline in cold extremes under a uniform warm shift. Conversely, coherent long-tailed regions over EUR, west-central NAM, and northwestern SEA indicate these locations experience nearly twice as many exceedances as Gaussian, meaning a slower decline in winter cold extremes under a warm shift. The MMEM shift ratio broadly captures the principal spatial patterns of both shorter- and longer-than-Gaussian DJF cold tails in MERRA-2 (figure 1(b)). There is robust agreement between CMIP6 and MERRA-2, defined here as at least 85% of GCMs (⩾17) agreeing on tail significance and shape, for 28.8% of grid cells over the domain of significant non-Gaussian tails in MERRA-2. The full ensemble agrees well with reference shift ratio patterns in northern and west-central NAM, although the degree of departure from Gaussianity varies among individual GCMs (figure S2). Short-tailed regions with a higher degree of departure than MERRA-2 denote regions where GCMs simulate too few exceedances following a uniform distribution shift, meaning pre-shifted cold temperatures are less extreme than reference data (e.g. BCC-CSM2-MR over NAM in figure S2). There are also areas where the majority of CMIP6 GCMs mischaracterize tail shape, most notably over northwestern NAS (figure 1(c)). However, nearly all GCMs properly identify tails as significantly shorter-than-Gaussian in southern AUS and southern SAM during DJF. Although model agreement is not robust over the long-tailed areas of these sub-regions (figures 1(a) and (c)), the MMEM corresponds with MERRA-2 (figure 1(b)), and captures other areas with weak agreement including short-tailed regions in southeastern NAM and SEA. This demonstrates the importance of considering multiple GCMs to characterize 2 m temperature distribution tail shape, as the MMEM averages across model error in the spatial extent of coherent regions of non-Gaussian tails.
In JJA, the presence of coherent regions of shorter-than-Gaussian cold tails with a high degree of departure from Gaussianity (shift ratios < one-quarter) over the northernmost sections of NAM, EUR, and NAS, denotes a more-rapid-than-Gaussian reduction in extreme cold temperature exceedances during summer months in high-latitude locations under a warm shift (figure 1(d)). Long-tailed regions signifying greater-than-Gaussian post-shift cold-side exceedances are generally located in the tropics, including over southwestern SEA and northern SAM. As in DJF, the MMEM spatial pattern of JJA cold-tail shift ratios compares well with MERRA-2 (figure 1(e)), although individual GCMs exhibit greater variability in the degree of departure from Gaussianity, particularly over long-tailed tropical regions (figure S3). There is robust model agreement (⩾85% GCMs) over 32.6% of the domain (figure 1(f)). Robust regions of shorter-than-Gaussian tails include AUS, southeastern SAM, NAS, EUR, and northeastern NAM, and robust long-tailed regions include SEA, northern AUS, and central SAM. In addition, the MMEM captures regions where many GCMs disagree on tail behavior including SAF, southern NAM, and eastern EUR (figures 1(e)–(f)).
Figure 2 displays Taylor diagrams summarizing statistical metrics of global shift ratio pattern error: Pearson correlation coefficients, normalized standard deviations, and normalized centered root mean square differences (Taylor 2001). GCM shift ratio patterns that most resemble MERRA-2 are closest to the 'origin' represented by the magenta square. For both long and short 2 m temperature distribution tails in each season, GCM cold-tail shift ratios are well correlated with MERRA-2, with coefficients from 0.58 to 0.88 (figures 2(a)–(b)). CESM2, CESM2-WACCM, and NorESM2-LM best capture MERRA-2 global DJF cold tails as values are nearest to the origin (figure 2(a)), whereas JJA cold tails are captured well by a number of GCMs, which is evident from the cluster at correlation values exceeding 0.8 (figure 2(b)). Although many GCMs exhibit a higher degree of departure from Gaussianity compared to reference data (nSDs > 1.0), overall performance by GCMs and the MMEM indicates reasonable agreement with MERRA-2, supporting results from figure 1. Compared to individual GCMs, the global MMEM shift ratio has a higher pattern correlation with reference data, although averaging across shift ratios of varying spatial extent and degrees of departure from Gaussianity dampens pattern variance.
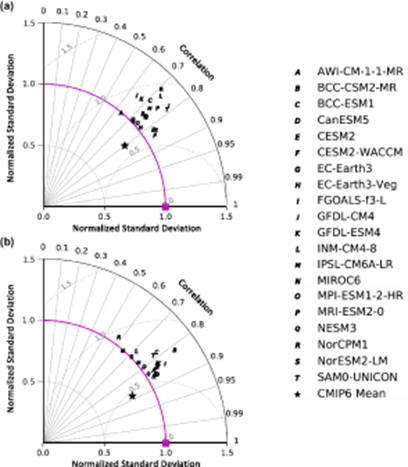
Figure 2. Taylor diagrams for (a) DJF and (b) JJA global shift ratios representing the cold tail of the temperature distribution. Metrics include the normalized standard deviation (nSD; radius) of shift ratios in CMIP6 models and MERRA-2 (magenta line), as well as the correlation coefficient (angle) and normalized centered root mean squared difference (nRMSD; dotted gray circles) between MERRA-2 and CMIP6. SDs and RMSDs are normalized by the SD of the MERRA-2 shift ratio to quantify GCM skill relative to this dataset. If a GCM shift ratio pattern perfectly matches MERRA-2, it has a correlation of one, nSD of one, and nRMSD of zero (magenta square).
Download figure:
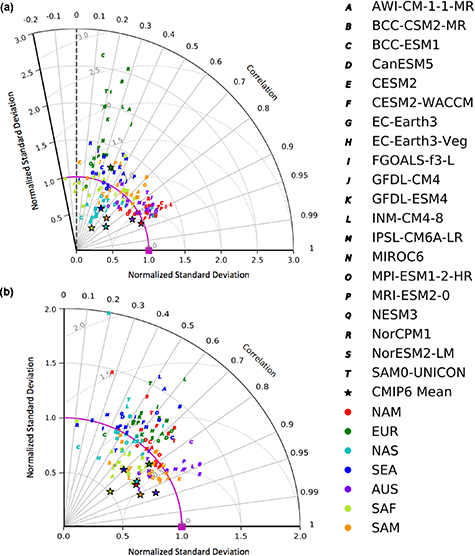
Standard image High-resolution imageCloser examination of performance over individual sub-regions shows a greater spread in skill among CMIP6 GCMs relative to MERRA-2 (figure 3). Pattern correlations range from −0.16 to 0.93, and nSDs range from one-third to almost three times MERRA-2. The highest model variability in non-Gaussianity occurs over EUR for shift ratios characterizing the cold side of the temperature distribution during DJF (figure 3(a)). There is also a wide range of correlation coefficients over SAF, where some GCMs (GFDL-CM4, GFDL-ESM4, and NorCPM1) are negatively correlated with MERRA-2 patterns, while others (BCC-ESM1, CESM2, CESM2-WACCM, FGOALS-f3-L, MIROC6, NorESM2-LM) perform moderately well over this sub-region (correlations >0.6). In addition to model variability, there is considerable spatial variability, with performance among sub-regions revealing characteristics common to both seasons. Over SEA and EUR, the majority of GCMs simulate a greater degree of departure from Gaussianity than MERRA-2, whereas variance in non-Gaussianity over SAF is lower. Relative to other sub-regions, most GCMs boast superior performance over NAM and AUS during DJF (figure 3(a)), and SAM and AUS during JJA (figure 3(b)), sub-regions that also contain coherent areas of robust agreement between CMIP6 and MERRA-2 (figures 1(c) and (f)). There is therefore higher confidence in simulations of extreme cold temperatures over these regions and seasons.
Download figure:
Standard image High-resolution image4.2. Warm-side tails
Shift ratios identifying regions of non-Gaussianity in the warm tail of the 2 m temperature distribution are displayed in figure 4. As in figure 1, warm colors denote areas where distribution tails are significantly shorter-than-Gaussian, and cool colors denote long tails. Note the reversal in the color axis, as here, a shift ratio of two represents a short-tailed region in which the right side of the distribution exhibits twice as many warm exceedances as a Gaussian following a uniform warm shift. During DJF, expansive coherent regions of warm tails significantly shorter-than-Gaussian are present over EUR, NAM, central AUS, and western NAS (figure 4(a)). The MMEM captures these short-tailed regions (figure 4(b)), and there is robust agreement over approximately half of the domain (figure 4(c)). Individual GCM shift ratios also largely agree with MERRA-2 on both spatial extent as well as the degree of departure from Gaussianity (figure S4). Model skill in simulating these shorter-than-Gaussian warm tails boosts confidence in CMIP6 simulations of future climate, which likely project a more-rapid-than-Gaussian increase in extreme warm temperature exceedances during boreal winter, with the greatest exceedances occurring over 'hot spots' in northwestern NAM and eastern EUR. Although not examined in CMIP6 models here, (Loikith et al 2018) demonstrated that future global warming simulations in CMIP5 support short tails as effective indicators of locations that will experience a more-rapid-than-Gaussian increase in extreme warm temperature exceedances. Despite this broad agreement, few shift ratio patterns in SAM and SAF are reproduced by the majority of GCMs (figure 4(c)), and tail shape is mischaracterized by the MMEM as shorter-than-Gaussian in the northern portions of these sub-regions (figure 4(b)). This suggests many CMIP6 GCMs simulate warm temperatures that are less extreme, in an anomalous sense, than reference data during the austral summer over the historical period, meaning these models may project a more-rapid-than-Gaussian increase in the number of days exceeding the 95th percentile under future warming than anticipated from equatorial temperature distributions in MERRA-2.
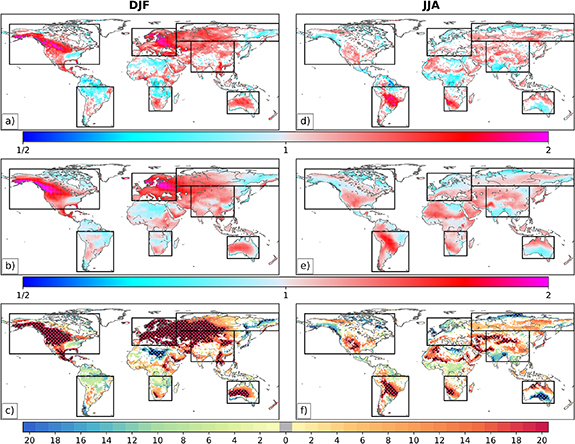
Figure 4. As in figure 1, but for temperature distribution warm-side tails using the 95th percentile as the fixed threshold to measure exceedances. In the top two rows, values greater than one indicate shorter-than-Gaussian warm tails and values less than one indicate longer-than-Gaussian warm tails. In the bottom row, warm colors indicate agreement on short tails, and cool colors indicate agreement on long tails.
Download figure:
Standard image High-resolution imageDuring JJA, MERRA-2 shift ratio values reveal significant short-tailed regions over central SAM, northern AUS, and northern SEA, and significant long-tailed regions over southern AUS, southern SEA, and northern NAS (figure 4(d)). The degree of departure from Gaussianity is modest relative to DJF, which exhibited hot spots over EUR and NAM (figure 4(a)). The MMEM JJA shift ratio pattern broadly agrees with MERRA-2 (figure 4(e)), as more than 85% of GCMs capture coherent short-tailed regions in SAM and SAF, as well as the complex shape of short-tailed regions in SEA (figure 4(f)). There is also robust agreement in coastal regions of northeastern and western NAM, northern NAS, and southern AUS for long-tailed distributions. However, there are fewer grid cells in MERRA-2 over which JJA warm tails deviate significantly from Gaussian compared to DJF, and a smaller percentage of the domain with robust model agreement (21.7%; figure 4(d)). Most GCMs also disagree on tail shape over southwestern NAS (figure 4(f)), simulating tails that are either near-Gaussian or longer-than-Gaussian (figure S5). This suggests a potential underestimation of warm tail exceedances under a warm shift, which could lead to projections of temperature change in these GCMs that are less credible owing, in part, to slower positive feedbacks with permafrost and snow (Schaefer et al 2014). A thorough analysis of model projections would be beneficial to ascertain the implications of biases in tail Gaussianity, but is outside the scope of this study.
Taylor diagrams for global and regional shift ratio patterns representing the warm side of the temperature distribution reveal variability in pattern correlations and nSDs (figure 5). Some GCMs perform well globally in both seasons including EC-Earth3-Veg, CESM2, and CESM2-WACCM, which boast correlations above 0.8 and nSDs under 1.1 (figures 5(a)–(b)). These values indicate a reasonable estimation of 2 m temperature distribution tail shape, which implies that these GCMs provide more realistic realizations of warm extremes on a global scale. However, model performance varies greatly among sub-regions. There is a higher degree of departure from Gaussianity over SEA and lower variance than MERRA-2 over SAF for most GCMs. Fidelity varies with season over SAM, where some GCMs are negatively correlated with MERRA-2 during DJF (figure 6(a)), but the MMEM correlation is greater than 0.7 during JJA (figure 6(b)). In fact, JJA MMEM correlation coefficients for all sub-regions are above 0.7, with the highest relative skill over AUS as the MMEM is closest to the origin. Individual GCMs that perform well over this region include BCC-CSM2-MR and BCC-ESM1, which demonstrate poor performance globally (figure 5(b)), mainly owing to a mischaracterization of tail shape over the Northern Hemisphere high-latitudes (figure S5). Differences in model performance among sub-regions may be related to systematic biases that have been documented in CMIP5 such as earth system feedbacks (Mueller and Seneviratne 2014, Sippel et al 2017), or potential errors in circulation dynamics associated with these extreme temperature exceedances (Cattiaux et al 2013, Loikith and Neelin 2019), but this requires further investigation. Despite regional differences, the majority of GCMs, including the MMEM, broadly capture both the pattern and degree of departure of the global reference shift ratio for JJA warm tails.
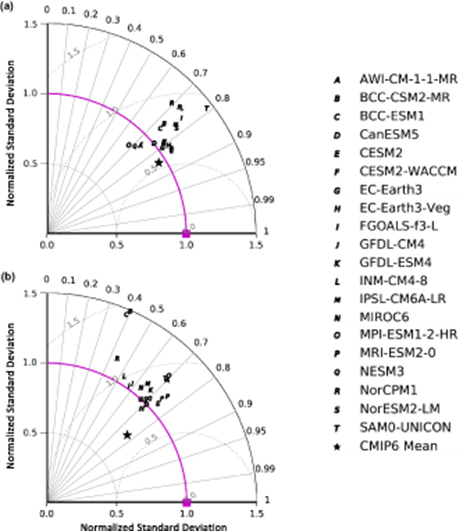
Figure 5. As in figure 2, but for global shift ratios representing the warm side of the distribution.
Download figure:
Standard image High-resolution image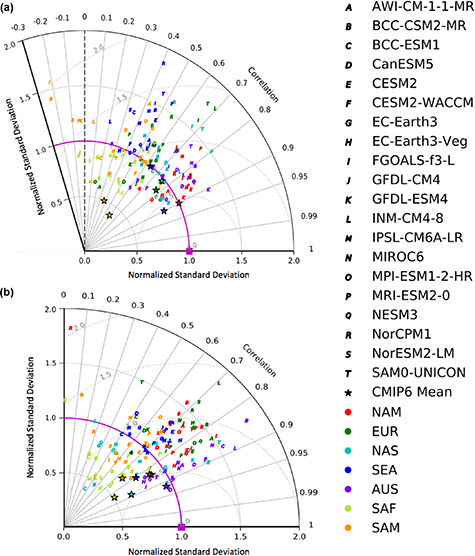
Figure 6. As in figure 3, but for regional shift ratios representing the warm side of the distribution.
Download figure:
Standard image High-resolution image
Note, pattern correlations mask GCM ability to simulate coherent regions of non-Gaussian tails that are marginally shifted in latitude or longitude, so slight differences in the position or extent of the region from MERRA-2 may yield a lower correlation coefficient even though the broader pattern of non-Gaussianity is reasonably captured. Close inspection of individual GCM shift ratio maps (see supporting information figures S1–S4) is useful while interpreting Taylor diagram metrics.
5. Conclusions and discussion
This work evaluates the ability of CMIP6 GCMs to capture historical 2 m temperature distribution tail shape, as confidence in GCM projections of future changes in extreme warm and cold temperatures relies on reasonable simulation of the normality of tails (Ruff and Neelin 2012, Loikith et al 2018). Results reveal that the CMIP6 ensemble is generally proficient at capturing coherent spatial regions of significant non-Gaussian warm and cold tails under current climate conditions in both the DJF and JJA seasons as represented by reanalysis. The CMIP6 MMEM closely resembles MERRA-2 global shift ratio patterns for both sides of the temperature distribution, and at least 85% of GCMs agree with MERRA-2 on tail significance and shape over many regions of strong non-Gaussianity. For example, nearly all GCMs capture the DJF principal pattern of shorter-than-Gaussian cold tails over the high latitudes of North America, increasing confidence in model realizations of extreme cold temperatures. One can then postulate that this short-tailed region will experience a milder climate under future warming, with a rapid decline (i.e. much faster than would be expected from a Gaussian distribution) in cold temperature exceedances during winter months, impacting agricultural and ecological sectors in the region. While the shift paradigm presented here is a useful indicator, the character of warming across the temperature distribution is likely more complex at many locations (Loikith et al 2018), so additional work analyzing projections of temperature extremes under greenhouse gas emissions scenarios will provide greater context for the importance of these findings.
Despite broad agreement globally, there is substantial regional and model variability in skill relative to MERRA-2. GCMs perform well over Australia but overestimate variance over southeastern Asia for all cases, and there is large variability in performance over other coherent regions of non-Gaussian tails depending on the case and GCM. For example, GFDL-ESM4 exhibits a near-zero pattern correlation with MERRA-2 over South America for both sides of the DJF temperature distribution (figures 3(a) and 6(a)), but exhibits the highest skill for cold tails in JJA (figure 3(b)). Both globally and regionally, CESM2 and CESM2-WACCM shift ratios are generally highly correlated with MERRA-2 patterns and feature comparable variance in non-Gaussianity, whereas NorCPM1 and BCC-ESM1 often show weak agreement and are outliers among individual sub-regions in nearly all cases. However, no GCM demonstrates the highest or lowest skill for all cases, and MMEM pattern correlations are generally superior to individual GCMs. This suggests the CMIP6 multi-model ensemble is generally capable of reproducing tail shape.
Model bias in historical temperature distributions increases uncertainty in future projections (Christensen and Boberg 2012), so further investigation of CMIP6 biases in processes related to temperature extremes such as land-atmosphere feedbacks, which have been shown to be insufficiently simulated by the CMIP5 ensemble (Sippel et al 2017), is required. Overall, though, the CMIP6 MMEM overcomes the limitations of individual GCMs and best captures MERRA-2 temperature distribution tail behavior over sub-regions. Also, the CMIP6 MMEM is comparable to warm-tail patterns in the CMIP5 MMEM (Loikith et al 2018), with improved performance over central Asia during DJF as well as western Asia during JJA. These results support the utility of the recently-released CMIP6 multi-model ensemble to simulate regional and seasonal dependence of 2 m temperature distribution tail behavior and thus, future changes in temperature extremes. Future work assessing the degree to which non-Gaussian tails influence simulated temperature extremes exceedances will connect distribution shape and complexity to impacts in a warming climate.
Acknowledgments
Support for this work is provided by the U.S. National Science Foundation through Grant AGS-1621554, as well as National Oceanic and Atmospheric Administration grant NA18OAR4310280 (JDN). We thank two anonymous reviewers for constructive comments. We acknowledge the World Climate Research Programme's Working Group on Coupled Modelling for coordinating CMIP6, and we thank the climate modeling groups (listed in table S1) for producing and making available their model output. We also acknowledge Earth System Grid Federation (ESGF) for archiving and providing access to CMIP6 data, as well as the funding agencies supporting CMIP6 and ESGF.
Data availability statement
The data that support the findings of this study are openly available. MERRA-2 data is publicly available from https://disc.gsfc.nasa.gov/, and ERA5 through https://climate.copernicus.eu/climate-reanalysis.