

Abstract
In the western United States, mountain pine beetles (MPBs) have caused tree mortality across 7% of the forested area over the past three decades, leading to concerns of increased fire activity in MPB-affected landscapes. While fire behavior modeling suggests MPB-associated changes in fuels may influence fire behavior, retrospective studies have generally found negligible or weak effects of pre-fire MPB outbreak on fire activity. This apparent disagreement may arise from differences in fire weather, fuels, or scale and highlights the need for empirical studies that examine the influence of MPB outbreak on fire activity at finer spatiotemporal scales. Here we use a novel combination of geospatial data and firefighter observations to test the relative influences of red and gray stage MPB outbreak on two measures of daily wildfire activity—daily area burned (DAB) and observed fire behavior. We analyzed 2766 large wildfires that burned in the West over the 2003–2012 period. We found 329 fires that intersected prior MPB outbreak, however most burned in areas affected by MPB for only a few days (median = 4 d). We modeled DAB and the occurrence of observation of high-extreme fire behavior in 57 large (>1140 ha) wildfire events that burned for long time periods (>10 d) in landscapes affected by MPB. Under these conditions, we found no effect of red or gray stage MPB outbreak on either DAB or observed fire behavior. Instead, greater DAB and observations of high-extreme fire behavior occurred during warmer, drier, and windier weather conditions and where pre-outbreak fuels were characterized by lower canopy base heights and greater canopy bulk densities. The overriding influence of weather and pre-outbreak fuel conditions on daily fire activity observed here suggest that efforts to reduce the risk of extreme fire activity should focus on societal adaption to future warming and extreme weather.
Export citation and abstract BibTeX RIS

Original content from this work may be used under the terms of the Creative Commons Attribution 4.0 licence. Any further distribution of this work must maintain attribution to the author(s) and the title of the work, journal citation and DOI.
1. Introduction
Wildfire and bark beetle outbreaks are key disturbances affecting forests across the western United States, where they have respectively affected 6.3% and 7.1% of the forested area over the past three decades (Hicke et al 2016). The coincidence of extensive wildfire and bark beetle outbreak has led to widespread concern that bark beetle-induced tree mortality may exacerbate fire activity (Hicke et al 2012, Jenkins et al 2014). These concerns are driving costly federal policy decisions and forest management actions across millions of acres of National Forest System lands (Agricultural Act of 2014). Yet at the broad spatial scales most relevant to forest management and policy, empirical evidence for increased fire activity in bark beetle-affected forests is lacking (Harvey et al 2014b, Hart et al 2015, Meigs et al 2016).
Across the Western US, the mountain pine beetle (Dendroctonus ponderosae; hereafter 'MPB') has caused most of the recent bark beetle-induced tree mortality, primarily in lodgepole pine (Pinus contorta) and ponderosa pine (Pinus ponderosa) (Negrón and Fettig 2014). Adult MPBs inhabit a tree's inner bark, where they oviposit and the resulting larvae feed on phloem tissues. Extensive colonization and reproduction by MPBs lead to tree death. MPBs typically attack weakened trees, however outbreaks may occur when beetle populations rapidly grow in response to favorable effects of temperature on beetle development rates and drought stress in host trees (Raffa et al 2008, Chapman et al 2012).
Tree mortality caused by MPB infestation is expected to alter fire activity by changing the flammability, continuity, and structure of fuels (Hicke et al 2012, Jenkins et al 2014). Initially following death, trees enter the 'red stage', which is characterized by declines in leaf moisture content and changes in chemical composition that increase flammability (Jolly et al 2012, Page et al 2012). Predictive models of fire behavior suggests these changes may promote crown fire (Page and Jenkins 2007, Schoennagel et al 2012, Hoffman et al 2012, 2013, 2015). About three years following initial attack, needles drop, and trees move into the 'gray stage.' During the gray stage, canopy bulk density and continuity are reduced (Klutsch et al 2009, Simard et al 2011, Schoennagel et al 2012), fuels build up on the forest floor due to falling needles, branches, and/or release of understory vegetation (Klutsch et al 2009), and the forest microclimate changes from the loss of live tree crowns (Simard et al 2011). In fire behavior models these changes generally lead to decreased crown fire potential (Page and Jenkins 2007, Klutsch et al 2011, Simard et al 2011, Schoennagel et al 2012, Hoffman et al 2015). However, fire behavior modeling also shows that pre-outbreak stand structure and fuels, weather conditions, temporal and spatial patterns of tree mortality, and surface fireline intensity exert an important influence on fire behavior in MPB affected stands (Page and Jenkins 2007, Klutsch et al 2011, Simard et al 2011, Schoennagel et al 2012, Hoffman et al 2012, 2013, 2015).
Retrospective studies have generally found negligible or weak effects of pre-fire MPB outbreak on fire occurrence (Kulakowski and Jarvis 2011, Mietkiewicz and Kulakowski 2016), area burned (Hart et al 2015, Meigs et al 2015) and fire severity (Harvey et al 2014a, 2014b, Meigs et al 2016, Talucci and Krawchuk 2019). Effects of pre-fire MPB outbreak are also thought to depend on daily weather conditions (Harvey et al 2014a, 2014b, Agne et al 2016). However, there are few empirical studies of the effects of MPB outbreak on daily fire activity, largely due to difficulties associated with collecting data in active wildfire. Perrakis et al (2014) observed greater rates of spread in red and gray stage MPB than unaffected forests, however analyses were limited to 16 observations. Results from nine paired experimental burns in control and simulated MPB-killed stands revealed no effect of simulated red-stage MPB outbreak on fire behavior (Schroeder and Mooney 2012). Yet, in interviews with 28 wildland firefighters, Moriarty et al (2019) found amplified fire behavior in the red stage of outbreak. These uncertainties highlight the need for a broad-scale analysis of the relative influence of MPB outbreak on daily wildfire activity.
We used a novel approach that combined geospatial data and wildland firefighter observations. Specifically, we used satellite data to generate maps of daily fire progression and linked these data to daily Incident Status Summary reports (ICS-209 reports) filed by wildland firefighters. ICS-209 reports are filed for all large wildfires on lands managed by the US Federal agencies and detail the daily fire size and observed fire behavior. Reports provide coarse-grain daily 'snapshots' of the management situation and are critical in determining resource allocation (National Intelligence Working Group 2017). ICS-209 reports have been used to make inferences about containment probability (Finney et al 2009) and biomass emissions (Pouliot et al 2008), but to our knowledge have not been used to analyze descriptions of observed fire behavior. We focused on three questions: (1) At the daily timescale, how frequently did fires burn in areas affected by MPB? (2) In large wildfire events, is MPB outbreak associated with greater daily area burned (DAB) and/or the occurrence of days with high-extreme fire behavior as reported by wildland firefighters? and (3) Do the potential effects persist after controlling for biophysical factors known to affect fire activity? Additionally, we examined the relationship between remotely sensed DAB and wildland firefighter observations of fire behavior.
2. Methods
2.1. Data
We first obtained spatial data on large wildfire (>405 ha) extent for all fires that burned during the 2003–2012 period in the contiguous western United States (figure 1) from the Monitoring Trends in Burn Severity Project (MTBS Project 2017). To characterize daily fire growth, we obtained fire progression polygons produced by incident management teams from the Geospatial Multi-Agency Coordination group (Geospatial Multi-agency Coordinating Group GeoMAC 2019). Consistent with previous retrospective studies of wildfire (e.g. Collins et al 2009, Parks et al 2015), we found data on fire growth from GeoMAC was characterized by many temporal gaps, thereby limiting our ability to quantify DAB. We therefore followed methods outlined in Parks (2014) and created maps of day-of-burning (DOB) for each fire by spatially interpolating Moderate Resolution Imaging Spectrometer (MODIS) active fire-detection data (NASA MCD14ML product, Collection 5, Version 1), which depicts the location of actively burning 1 × 1 km MODIS pixels (figure S1 is available online at stacks.iop.org/ERL/15/054007/mmedia). We used the high temporal resolution of MODIS to estimate DOB at higher spatial resolutions (30 × 30 m) using a weighted by mean and distance spatial interpolation approach (Parks 2014). Finally, we converted gridded day-of-burning data to polygons depicting the daily fire progression.

Figure 1. The study area (A) and frequency distributions of the percent area of the fire event and daily fire progression polygon that intersected mountain pine beetle (MPB) host forest (B) and (C) and prior MPB outbreak (D) and (E). The insets show frequency distribution for mean crown area of prior MPB outbreak within an event and daily fire progression polygon. Note the area of mean crown area of prior MPB outbreak represents a conservative estimate.
Download figure:
Standard image High-resolution imageMaps of DOB are difficult to validate because of the lack of ground-truthed data, particularly in large wildfires. Parks (2014) found GeoMAC and MODIS-based maps of DOB, matched exactly for 46.1% of cases, while 75% of cases were within 1 d. However, disagreement arises from errors in both datasets. To determine if our results were sensitive to the use of MODIS-based maps of fire progression, we compared our findings to results obtained using the subset of wildfires with both GeoMAC- and MODIS-based maps of daily fire progression (Supplement).
To characterize daily fire behavior, we obtained daily ICS-209 reports from the National Fire and Aviation Management (2019) Web Application. ICS-209 reports are filed daily by incident management teams, who record the cumulative area burned, observed fire behavior, and projected fire behavior, among other things. For each day, we extracted the observed fire behavior descriptions which were classified following the Fire Behavior Reference Guide (NWCG 2017), where possible values included (1) smoldering, (2) creeping, (3) running, (4) torch/spot, (5) crowning, and (6) erratic and extreme (table 1). To do so, we compiled a list of terms associated with each category from the Fire Behavior Reference Guide (NWCG 2017) (tables 1 and S3) and classified the text in R (R Core Team 2017). In the dataset examined here, the frequency of these six groups was extremely unequal (figure 2). Therefore, we combined smoldering, creeping, running, and torch/spot classes into a low-moderate fire behavior category. The crowning and erratic and extreme classes were grouped into a high-extreme category (table 1). Where observations indicated varied fire behavior, we assigned the highest category.
Table 1. Categories, descriptions and search terms for categorizing observed fire behavior descriptions from ICS-209 reports.
| Fire behavior class | General fire behaviora | Descriptiona | Example search termsb |
|---|---|---|---|
|
|
||
| Smoldering |
|
|
|
|
|||
|
|
||
|
|
||
| Creeping |
|
|
|
|
|||
|
|
||
| Low-moderate |
|
|
|
| Running |
|
|
|
|
|||
|
|
||
|
|
||
| Torch/spot |
|
|
|
| Torching | |||
|
|||
|
|
||
|
|||
| Crowning |
|
|
|
| High-extreme |
|
|
|
|
|
||
|
|
||
|
|
||
| Extreme and erratic |
|
|
|
|
|
aCategories of fire behavior and their descriptions are adapted from the Fire Behavior Reference Guide (NWCG 2017). bFor a full list of search terms, see table S1.

Figure 2. Boxplots displaying the DAB in each observed fire behavior class. Data shown are from the 41 fires and 663 d with coincident MODIS and ICS-209 data. The horizontal line is the median, 25th and 75th percentiles are box edges, vertical lines show 1.5 times the interquartile range, and points are outliers.
Download figure:
Standard image High-resolution imageTo characterize MPB outbreak, we first defined the presence of MPB host-species using three forest cover-type spatial datasets: Landfire Existing Vegetation Type (LANDFIRE 2001a), National GAP Landcover data (LANDFIRE 2011), and a map of US forest types produced by Zhu and Evans (1994). We created 30 × 30 m grids of the presence of MPB host tree species (see table S2) by defining presence as any cell where two or more datasets were in agreement (e.g. Preisler et al 2012). We then aggregated the data by calculating the percent of host cover within a 990 × 990 m cell, a spatial grain chosen to match the coarse-scale of forest disturbance data from the United States Forest Service (USFS) Aerial Detection Survey (ADS) program (Johnson and Ross 2008). We acquired all ADS describing the extent and estimated severity (e.g. damaged trees per hectare) of MPB infestation across the western US over the 2000–2011 period (USFS and its partners 2017). Approximating the methods outlined by Meddens et al (2012), we first converted annual (2000–2011) ADS polygon data to a 990 × 990 m raster by first calculating the percent of each pixel that intersected an MPB damage polygon. We then constrained the percent MPB damage of each pixel so that it could not exceed the percent MPB host forest by overlaying the percent host and percent MPB damage rasters. Thus, the rasters created here are conservative estimates of where outbreak is most likely to have occurred. Next, we multiplied the percent MPB damage rasters by the estimated number of affected trees per hectare to generate grids of the number of damaged trees per hectare. These grids were converted to crown area per hectare by multiplying by the average tree crown diameter for each host tree species, which we obtained from Meddens et al (2012). Finally, we created rasters depicting the stage of outbreak, where we defined red-stage outbreak as the total MPB crown area mapped within two years of the fire year and gray-stage outbreak as the total MPB crown area within three or more years prior to the fire year (e.g. Hart et al 2015). We assume the resulting datasets describe the relative amount of MPB activity within a cell, but caution that aerial sketchmapping is subjective and often underestimates the severity of tree mortality (Johnson and Wittwer 2008, Meddens et al 2012, Hicke et al 2016).
To determine the relative influence of MPB outbreak on DAB and observed fire behavior, we acquired spatial data for eleven independent biophysical predictors (table S3). We selected variables that are known to influence fire behavior, including fuels, topography, and weather (Agee 1993). To characterize daily fire weather, we used daily weather data (collected hourly) from the nearest Remote Automated Weather Station (table S5) describing the daily maximum temperature, average relative humidity, and wind gust speed. To describe fuel moisture, we obtained 4 × 4 km daily grids of Energy Release Component (ERC), a composite fuel moisture index that integrates the effects of weather conditions on the focal day and preceding seven days (Abatzoglou 2013). We characterized fuel characteristics using a 30 × 30 m raster of pre-outbreak canopy bulk density (CBD) and canopy base height (CBH) (LANDFIRE 2001b, 2001c), factors that are known to affect crowning. Finally, to control for potential differences in fire activity between MPB hosts, we used 30 × 30 m rasters listing the presence/absence of lodgepole pine and ponderosa pine. To represent topography, we obtained 30 × 30 m rasters of slope and elevation (LANDFIRE 2013). We assigned values of each predictor to each daily fire progression polygon by calculating the mean value of the raster cells overlapping the DOB polygon. Prior to modeling, we used pairwise correlations to detect potential multicollinearity issues associated with the predictor variable set (figure S2).
2.2. Analyses
To better understand how frequently wildfires intersected prior MPB outbreak, we first used GIS to determine the number of wildfires that intersected MPB host forest and prior MPB outbreak for all wildfires. For wildfires that intersected MPB outbreak, we also calculated the number of daily fire progression polygons that intersected prior MPB outbreak and the mean MPB crown area.
To determine if prior MPB outbreak was associated with increased DAB or high-extreme observed fire behavior, we selected the fires where more than 50% of the daily fire progression days intersected prior MPB outbreak. To determine if the 50% threshold for selecting fires influenced our results, we additionally performed all analyses using both a 25% and 75% threshold (see Supplement). We further constrained our analysis to only wildfires with ≥10 d with fire progression data, which allowed for enough replication within each fire to treat fire identity as a random effect in analyses (described below) (Bolker et al 2009). We examined the effect of pre-fire MPB outbreak on observed fire behavior for the subset of these burning days where data on observed fire behavior was recorded and could be classified for both the current and proceeding day, which allowed for the inclusion of a temporal autocovariate term (table S4). As a consequence, our analysis focuses on large wildfires that burned over long time periods, which tend to have the greatest social and ecological consequences.
To understand if fire growth was associated with firefighter observations, we first compared DAB with classified observed fire behavior. Specifically, we modeled the occurrence of high-extreme fire versus low-moderate fire behavior as function of DAB using a generalized linear model (GLM) with a binomial distribution and logit link function. To account for differences between fire events and temporal autocorrelation, we also included an autocovariate term—the prior day's observed fire behavior. We assessed significance using a likelihood ratio test that compared the model with DAB as predictor to the intercept only model (Zuur et al 2009).
To determine if MPB outbreak was associated with either increased DAB or occurrence of high-extreme rather than moderate-low fire behavior, we used two approaches. First, we constructed univariate models, where the only predictor was either the crown area of red or gray stage MPB outbreak. As above, models of observed fire behavior were constructed using a GLM with a binomial distribution (logit link) and included an autocovariate term. We used a linear mixed effects (LME) model with a random intercept term for fire identity and a first order autocorrelation structure nested within fire identity to model DAB (log transformed to improve normality). We fit LME models using the R package 'nlme' (Pinheiro et al 2017).
Next we constructed multivariate models using the same modeling frameworks as in the bivariate analyses and including the eleven other biophysical predictors of fire activity. We used a model selection approach to determine the influence of MPB outbreak relative to other drivers of daily fire activity. Prior to model construction, all predictor variables were z-score transformed to allow for comparison. We started with a model with all possible predictors and used likelihood ratio tests to evaluate the effect of dropping each variable from the model (Zuur et al 2009). Non-significant (p > 0.05) terms were removed until all remaining variables were significant. Variable selection removed both red and gray stage MPB outbreak from models of observed fire behavior and DAB, but we forced these variables into the final model to evaluate their relative influence as indicated by the model coefficients. Because the effects of MPB outbreak on fire activity have been hypothesized to only occur during specific conditions (Harvey et al 2014a), we also tested for interactions between MPB outbreak variables and significant biophysical variables using likelihood ratio tests. Overall explanatory power of the most parsimonious model was evaluated using the marginal coefficient of determination (R2), which reflects the variance explained by the fixed effects (Nakagawa and Schielzeth 2013).
3. Results
We examined 2766 large wildfires that burned in the western US during the 2003–2012 period (figure 1(A)). Of these fires, 916 (33%) burned in MPB host forest and 329 (12%) burned in areas with prior MPB outbreak. When fires burned in areas with MPB host forest, typically less than 30% of the total fire area was MPB host forest (median = 27%) and less than 3% of the total fire area was affected by prior MPB outbreak (figure 1). At the daily scale, we were able to use MODIS data to produce at least one fire progression perimeter for 92% of the fire events that intersected MPB affected forest (n = 302). The resulting dataset consisted of 3501 daily fire progression polygons, of which 91% (n = 3191) intersected MPB host forest and 58% (n = 2030) burned in areas with prior MPB outbreak (figures 1(C) and (E)). Of the 302 fires intersecting prior MPB outbreak, 60% (n = 192) had a fewer than 10 daily fire progression polygons (median = 8) and only a few days (median = 4 d) intersected prior MPB outbreak. Of the fires intersecting prior MPB outbreak that also burned for at least 10 d, 43% (n = 57) burned in MPB-affected landscapes for at least half of the burning days (n = 1318 daily fire progression polygons) (table S4).
Coincident ICS-209 data and MODIS-based fire progression polygons were available for 41 fires and 663 d (table S4). Data was generally available in both datasets when fires were large (>500 ha) and observed fire behavior was more extreme (figure 2). Consistent with the expectation of more rapid growth during periods of more extreme fire behavior, increases in DAB were associated with the occurrence of high-extreme (i.e. crowning or extreme) fire behavior.
We found observations of high-extreme fire behavior in daily ICS-209 reports and greater DAB often occurred in areas with greater red stage MPB mortality area (figures 3–4). However, neither red nor gray stage MPB were significantly related to either the occurrence of high-extreme fire behavior or DAB (p > 0.15; figures 3–4). Around 20% of the variance in observed fire behavior was explained by the MPB variables and autocovariate combined. Less than 1% of the variance in DAB was explained by MPB variables ( ≤ 0.01; figures 4(A)–(B)). These results were not sensitive to either the source of daily fire progression data nor the choice of threshold used to select fires for our analyses (figures S2–S7).
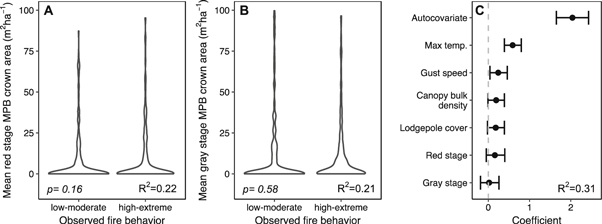
Figure 3. The effect of MPB outbreak on observed fire behavior. Density plots illustrate the univariate associations between observed fire behavior and mean red stage MPB (A) and gray stage MPB (B). The right panel shows regression estimates for the top performing multivariate model of observed fire behavior (C). Whiskers illustrate the 95% confidence intervals for the regression estimates. Note that confidence intervals for MPB associated coefficients overlap with zero. Data shown are from the 41 fires and 663 d with coincident MODIS and ICS-209 data.
Download figure:
Standard image High-resolution image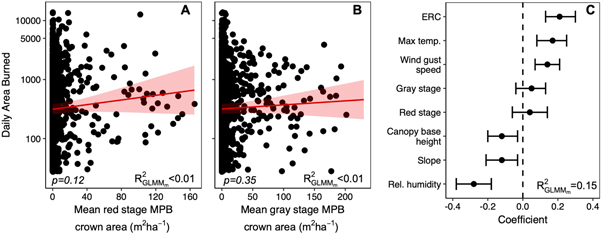
Figure 4. The effect of MPB outbreak on daily area burned (DAB). Scatterplots illustrate the univariate associations between DAB and mean red stage MPB (A) and gray stage MPB (B). The solid red line illustrates predicted values for the population based on the fixed effect estimates. Red shading shows the 95% confidence interval for the population prediction conditional on estimates of the random effects. P-values are from likelihood ratio tests.  and
and  are the marginal and conditional coefficients of determination, respectively. The right panel shows regression estimates for the top performing multivariate model of observed fire behavior (C). Whiskers illustrate the 95% confidence intervals for the coefficient estimates. Data shown are for the 57 wildfires that burned in MPB-affected landscapes for at least half of the burning days (n = 1318 daily fire progression polygons).
Download figure:
Standard image High-resolution image
The top performing multivariate model of observed fire behavior explained about 30% of the variance (R2 = 0.31) and included maximum temperature, gust speed, pre-outbreak canopy bulk density, and percent lodgepole pine cover (figure 3(C), tables S6–S7). More extreme fire behavior occurred when maximum daily temperatures were warmer, gust speeds were higher, and average pre-outbreak canopy bulk density was greater (figure 3(C), table S6). We found the top performing model of DAB explained about 30% of the variance ( = 0.30) about half of which was attributed to the predictor variables (
 = 0.15). Greater DAB was associated with higher ERC, warmer temperatures, windier conditions, lower canopy base height, flatter terrain, and lower relative humidity (figure 4(C), table S6). The inclusion of interaction terms between MPB outbreak and biophysical variables did not significantly improve performance of either observed fire behavior or DAB models (table S8). Similarly, average red or gray stage MPB outbreak were not important predictors of DAB or observed fire behavior when the threshold used to select fires was higher or GeoMAC data was used to map fire progression (figures S3–7).
4. Discussion
Using a combination of geospatial data and firefighter observations, we found no effect of prior MPB outbreak on DAB or the occurrence of observed high-extreme fire behavior in 1318 burning days occurring in 57 large wildfire events. Instead, the occurrence of high-extreme fire behavior and greater DAB were associated with the burning conditions of the previous day, weather conditions, pre-outbreak fuel conditions, and to a lesser extent, topography. These findings are consistent with experimental burning research that showed fire behavior increased with fire weather but not simulated MPB-kill conditions (Schroeder and Mooney 2012). Our results suggest that during drought conditions that promote extensive wildfire across the western US (Dennison et al 2014), short-term fluctuations in weather are likely more important than MPB-alterations to fuels at moderate spatiotemporal (daily) scales.
Consistent with previous work showing negligible effects of prefire-MPB on area burned (Hart et al 2015, Meigs et al 2015), our results indicate that few wildfires burned extensively in MPB-affected landscapes during the a decade of widespread fire and MPB outbreak. The limited overlap between MPB-affected forest and wildfire reflects the heterogenous environments where western wildfires burn—even when fires intersected MPB host forest, most fires burned in areas composed of diverse plant communities. Moreover, here we show that when wildfires intersected prefire-MPB, the area burned in MPB outbreak accounted for a small proportion of the total area burned. At the daily scale, the overlap of MPB outbreak and wildfire disturbance typically occurred for a small proportion of the DAB and a relatively low crown area of MPB mortality. Given the limited spatial and temporal coincidence of MPB and wildfire, post-outbreak fuels treatments may be of limited efficacy.
We found firefighter observations of daily fire behavior and fire growth agree with MODIS-based reconstructions of DAB. Additionally, we found similar models of DAB using maps of fire progression from incident management teams (e.g. GeoMAC) and MODIS active fire detection data. However, because MODIS data does not lack temporal gaps it provides key information about daily fire activity (Parks 2014). These findings support the use of MODIS daily fire activity data in reconstructing daily fire growth. However, we note that MODIS data is biased toward differences days of large fire growth and results should be interpreted in this context.
Here we examined the effect of MPB outbreak on two measures of daily fire activity in large wildfire events. At finer spatial and temporal scales, anecdotal observations and qualitative interviews with firefighters suggest that outbreaks may affect fire behavior (Moriarty et al 2019). Subsequent analyses where the spatial and temporal heterogeneity of MPB outbreak is better characterized may provide critical insights into this apparent incongruity. Additionally, our analyses use average conditions to characterize fuels, weather, and topography, the role of variability and extreme values at the daily scale requires more research. Further our analysis targeted large wildfires and days of notable fire growth (minimum daily area burned = 26.7 ha), when the potential effects of MPB on fuels are expected to be less important. Under more moderate weather conditions and finer spatiotemporal scales, the potential effects of bark beetle outbreaks on fire behavior may be important and warrant caution from a firefighting perspective (Jenkins et al 2014).
In addition to finding no significant effect of pre-fire MPB outbreak on observed fire behavior, we found strong influences of daily weather variability on observed fire behavior and daily fire growth (DAB). Weather and climate variability strongly influence fire occurrence (Dennison et al 2014), annual area burned (Littell et al 2009, Abatzoglou and Kolden 2013), fire severity (Holden et al 2007), and average fire size (Miller et al 2012) across the western United States. Yet the effects of climate conditions on individual fire sizes are less clear. For instance, Harvey et al (2016) found fire size in the Northern Rockies was weakly associated with cumulative moisture deficit at the time of fire and moisture deficit during the burning period. Yet Riley et al (2013) found individual fire sizes across the contiguous western United States were not strongly related to long- (>6 months) or moderate-term (7 d to 3 months) drought indices. Here, we found daily fire growth was sensitive to both daily weather variability (maximum temperature, gust speed, and relative humidity) and moderate-term drought (ERC), supportive of the idea that variation in weather is a key driver of fire size. Thus, predictions of future wildfire should incorporate both the effects of slowly changing broad-scale climate, which promote periods of widespread wildfire, and extreme weather events, which lead to rapid periods of fire growth.
5. Conclusion
At a moderate spatiotemporal scale, both daily fire growth (DAB) and observed fire behavior, as recorded in ICS-209 reports, were driven by fire weather, not MPB outbreak in 56 large wildfire events that burned across the West during the 2003–2012 period. Given the relative rarity of wildfire burning in MPB-affected forests and negligible effects on daily fire activity, post-outbreak management strategies should emphasize mitigation of other negative effects on socioecological systems, including diminished tourism, tree-fall hazards, and effects on wildlife habitat (Morris et al 2018). In general, efforts to reduce the risk of extreme fire behavior should focus on societal adaption to future warming and extreme weather events.
Acknowledgments
We thank two anonymous reviewers for their comments and Sean Parks for sharing code for generating daily fire progression polygons. The National Aeronautics and Space Administration (Award NNX16AH58G) and the University of Wisconsin-Madison Office of the Vice Chancellor for Research and Graduate Education supported this research.
Data availability statement
The data that support the findings of this study are openly available. ADS data is available from the USFS and its partners (2017) at https://fs.fed.us/foresthealth/applied-sciences/mapping-reporting/detection-surveys.shtml. LANDFIRE vegetation (LADNFIRE 2001a), canopy base height (LANDFIRE 2001c), canopy bulk density (LANDFIRE 2001b), and elevation (LANDFIRE 2013) data are available online at www.landfire.gov. GAP vegetation data are available from the USGS (2011) at 10.5066/F7ZS2TM0. RAWS data is available from the Western Regional Climate Center (2019) at https://raws.dri.edu/. The ERC data (Abatzoglou 2013) is at http://climatologylab.org/gridmet.html. Fire perimeter data from the MTBS project (2017) and Geospatial Multi-Coordination Agency (GeoMac) (2019) are available online at www.mtbs.gov/direct-download and https://rmgsc.cr.usgs.gov/outgoing/GeoMAC/, respectively. ICS-209 reports can be downloaded from the National Fire and Aviation Management (2019) at fam.nwcg.gov/fam-web/. MODIS active fire location data is available from NASA (2019) at https://earthdata.nasa.gov/active-fire-data.