

Abstract
River corridors store, convey, and process nutrients from terrestrial and upstream sources, regulating delivery from headwaters to estuaries. A consequence of chronic excess nitrogen loading, as supported by theory and field studies in specific watersheds, is saturation of the biogeochemically-mediated nitrogen removal processes that weakens the capacity of the river corridor to remove nitrogen. Regional nitrogen models typically assume that removal capacity exhibits first-order behavior, scaling positively and linearly with increasing concentration, which may bias the estimation of where and at what rate nitrogen is removed by river corridors. Here we estimate the nitrogen concentration saturation threshold and its effects on annual nitrogen export from the Northeastern United States, revealing an average 42% concentration-induced reduction in headwater removal capacity. The weakened capacity caused an average 10% increase in the predicted delivery of riverine nitrogen from urban and agricultural watersheds compared to estimates using first-order process assumptions. Our results suggest that nitrogen removal may fall below a first-order rate process as riverine concentration increases above a threshold of 0.5 mg N l−1. Threshold behavior indicates that even modest mitigation of nitrogen concentration in river corridors above the threshold can cause a self-reinforcing boost to nitrogen removal.
Export citation and abstract BibTeX RIS

Original content from this work may be used under the terms of the Creative Commons Attribution 4.0 licence. Any further distribution of this work must maintain attribution to the author(s) and the title of the work, journal citation and DOI.
Introduction
The expanding global human footprint—land conversion to agricultural and urban use, fertilizer application, and burning of fossil fuels—has mobilized nutrients from the terrestrial landscape to aquatic systems (Raymond et al 2008). The increased flux of nutrients to freshwaters puts pressure on the natural processing capacity of the river corridor, the zone encompassing hydrologic interactions between river channels and hyporheic areas, floodplains, riparian wetlands, and ponded waters that collectively regulate biogeochemically-mediated removal of nutrients and other constituents and thus downstream loads of riverine materials (Harvey and Gooseff 2015). The long-term degradation of water quality in roughly 46% of all the river corridors in the United States, for example, is a concerning factor associated with the impairment of 18% of the coastal areas and 21% of the lakes, reservoirs, and other ponded waters (US Environmental Protection Agency 2017). Excessive downstream delivery of nutrients has been implicated in negative consequences such as recurring harmful algal blooms and hypoxic areas in receiving waters around the world (Diaz and Rosenberg 2008, Conley et al 2011, Wells et al 2015), which compels a need to identify and prioritize effective management strategies (Diaz and Rosenberg 2008). Receiving waters such as the northern Gulf of Mexico and Chesapeake Bay are prominent examples of degraded coastal systems with expanding hypoxic areas that have spurred efforts to reduce nitrogen sources on the landscape and to identify the most cost-effective management strategies to decrease nitrogen loading to downstream waters (Keisman et al 2018, US Environmental Protection Agency 2008).
High riverine nitrogen concentrations that result from chronic increases in watershed sources may saturate biogeochemical processes and weaken the removal capacity of aquatic systems. Theoretical and small-scale field studies suggest that nitrogen removal in river corridors often does not follow first-order reaction kinetics. Instead, the capacity of the river corridor to remove nitrogen tends to decrease with increased nitrogen concentration, indicating reactive surfaces eventually can become saturated (Johnson and Goody 2011). For example, field measurements from river channels of several different sizes and flow conditions in one well-studied basin (Böhlke et al 2009) and from dozens of low-flow river channels scattered across the United States (Mulholland et al 2008) together provide evidence that nitrogen removal capacity decreases with increasing concentration.
The effects of nitrogen concentration saturation have been included in water quality models of specific agricultural watersheds (e.g. David et al 2009). However, modeling that consistently characterizes the behavior and estimates the cumulative effects of nitrogen concentration saturation across large river basins has not been accomplished. Rather, large-basin nitrogen models typically represent nitrogen removal as a first-order process where removal grows unbounded as a linear function of concentration. That approach leaves the large-scale impacts of concentration saturation unknown (Boyer et al 2006, Preston et al 2011) and obscures efforts to identify the most effective mitigation strategies—such as use of cover crops, land retirement, riparian setbacks, or river restoration. A more comprehensive approach will require regionally calibrated models using widely collected data that estimate the specific effect of nitrogen concentration saturation, among other factors, controlling nitrogen delivery from headwaters to coasts.
We hypothesize that nitrogen concentration saturation, which can transform healthy river corridors that naturally process and remove nitrogen into river corridors that essentially behave like pipes, increases the delivery of nitrogen to downstream lakes, reservoirs, and estuaries (figure 1). Quantifying the large-scale effects of concentration saturation is important to establish (1) the threshold above which nitrogen removal is diminished compared to first-order assumptions, (2) which river corridors are above this threshold, and (3) how those effects are likely to influence efforts to achieve load reduction targets. Unexpected yet beneficial behaviors may become apparent. For example, nitrogen concentration pushed above the threshold decreases removal. Conversely, if the concentration can be lowered by a change in management practices, there could be a self-reinforcing boost in the removal capacity as the effects of concentration saturation are lessened.

Figure 1. Hypothesized effects of nitrogen concentration saturation on delivery of nitrogen from headwaters to coasts. The net capacity of a river corridor to remove nitrogen by biogeochemically-mediated processes is hypothesized to decrease with increasing nitrogen concentration, with a threshold where the rate of removal falls below a first-order process (left panel). Nitrogen concentration saturation causes an increase in the downstream delivery of nitrogen, with the largest effect in headwaters (right panel) where the area in red represents the total increase in export from river channels of various size (stream order).
Download figure:
Standard image High-resolution imageMethods
Modeling nitrogen removal as a function of concentration
Here we extend the capabilities of the spatially referenced regression on watershed attributes (SPARROW) model (Schwarz et al 2006) to quantify the effects of concentration saturation on long-term mean annual export and coastal delivery of total nitrogen. We modeled the controls on nitrogen concentration and downstream load in approximately 190 000 river corridor reaches to demonstrate how concentration saturation behavior differentially affects river corridor removal capacity in urban, agricultural, and forested landscapes in the Northeastern United States, including Chesapeake Bay (CB) and New England (NE) basins. Hereafter, our use of 'regional' refers to these basins. Input data for our model are based on extensive measurements of nitrogen sources and riverine loads in the Northeastern United States described previously by Schmadel et al (2019) and detailed in the supplementary material.
SPARROW is comprised of three process-related components: (1) source terms (e.g. mass of manure applied to a catchment), (2) land-to-water delivery terms (e.g. terrestrial or climatic characteristics that affect delivery from the landscape to the river corridor), and (3) removal within the river corridor. Removal estimates typically assume that river corridors are equally reactive, flow is steady, and reaction kinetics are first-order, where the nitrogen removed (MR; kg y−1) in reach i is estimated as:

where LoadIN (kg y−1) is the nitrogen load entering reach i that includes load entering the upstream end and load generated within the corresponding catchment; τ (d) is the travel time through the reach for mean annual streamflow; d (m) is the water depth for mean annual streamflow;  (d m−1) is the reciprocal hydraulic load (a standard metric that quantifies the time required to displace a unit volume of water in the reach); and νf is the uptake velocity (m d−1), which estimates the net rate of biogeochemical reactions in the river corridor that remove and replenish instream nitrogen, including biotic assimilation, burial, remineralization, and denitrification (Alexander et al 2000, Seitzinger et al 2002, Boyer et al 2006). Because we model long-term mean annual loads, we interpret the resulting estimate of vf as a lumped measure of the net effect of all reaction processes in the river corridor that collectively influence downstream loading of nitrogen. When multiplied by riverine nitrogen concentration (C; g m−3), the uptake velocity provides the areal nitrogen uptake flux (U; g m−2 d−1):

If first-order behavior is assumed, the nitrogen uptake flux grows unbounded as a linear function of concentration.
We extended the capabilities of SPARROW to specify how nitrogen uptake velocities vary nonlinearly as a function of concentration throughout river corridors of the Northeastern United States from small headwaters to larger rivers by testing the regional performance of three different uptake velocity expressions. The first expression evaluates the power-law relationship between decreasing uptake velocity and increasing concentration (Mulholland et al 2008), specified as:

where a and b are constant calibration parameters. The second expression applies a Michaelis–Menten (MM) equation, a widely used formulation that describes the response of biological reaction rates to increased concentrations typically observed from laboratory incubations of constant sediments at a constant temperature (Johnson and Goody 2011). The MM equation has been used to explain decreased (i.e. nonlinear) nitrogen uptake velocities observed in river reaches with high concentrations (Earl et al 2006, Böhlke et al 2009, Covino et al 2010), and tested here to explain the effects of increased concentration on the regional nitrogen budget, specified as:

where Umax (g m−2 d−1) is the maximum U possible at low concentrations, Ks (g m−3) is the concentration at which U = 0.5Umax, and Umax and Ks are constant calibration parameters. The key difference between the first two expressions is that uptake velocity estimates at very low concentrations are bounded at  from the MM equation yet are unbounded for the power-law relationship.
In the third expression, we applied a more flexible statistical optimization approach to test for a significant nitrogen-saturation relationship that is not first order. The mean uptake velocity (v0; m d−1) is adjusted by a mean-centered concentration, such that:

where β (m d−1) represents the effect of concentration on ν0, and β and ν0 are constant calibration parameters. Concentration is mean-centered to provide a meaningful estimate of v0,  and log-transformed to add model calibration stability and reduce the dependence on the shape of the distribution. For this mean-centered approach, a negative value of β, for example, implies a reduction in nitrogen uptake velocity caused by a concentration above the mean concentration. While this expression allows for some adjustment to account for variation in the mean concentration between specific large river basins, it should consistently characterize the effects of concentration saturation on the regional nitrogen budget given that concentration varies widely across most large river basins.
We used the three saturation expressions to quantify a concentration saturation threshold where nitrogen uptake flux is diminished and thus increases the loading to downstream waters in the Northeastern United States. A concentration threshold was estimated for each expression where the rate of change in nitrogen uptake flux with respect to concentration falls below that of a first-order rate assumption (figure S1 is available online at stacks.iop.org/ERL/15/044018/mmedia). Unique to the functional form of the MM equation, deviation below first-order can also be approximated at the concentration where the uptake flux is half of the maximum (i.e. Ks = 0.5 Umax; equation (4)).
Quantifying the regional effects of nitrogen concentration saturation
We calibrated the nitrogen model to load observations (i.e. mean annual nitrogen loads estimated at 363 monitoring stations spread across the Northeastern United States) separately for the three different removal expressions (equations (3)–(5) substituted into equation (1)) to quantify the effects of concentration saturation on the regional nitrogen budget. Including concentration saturation effects is designed to allow the uptake velocity (vf) to vary spatially in a realistic way in response to natural and culturally-influenced variations in concentration. See supplementary material for model specifications, calibration results (tables S1–S5), and data sources (table S6).
In total, there were four different model calibrations performed (see tables S1–S5) and hereafter referred to as: (1) base model (common SPARROW model approach with spatially constant vf for rivers of a given size class and no concentration effects), (2) power-law saturation model (equation (3)), (3) MM saturation model (equation (4)), and (4) regional saturation model (equation (5)). From the base model, we have mean annual flow-weighted nitrogen concentration for each of the nearly 190 000 river reaches. These concentrations were used to populate and calibrate the power-law, MM, and regional saturation models, each allowing for vf to vary spatially as a function of concentration. We directly test our hypothesis that nitrogen concentration saturation—a process shown to be important by a limited number of field studies mostly in small watersheds (Mulholland et al 2008, Böhlke et al 2009)—is an important factor to the export of nitrogen from large river basins through calibration of the three saturation models.
To quantify the effect of concentration on nitrogen delivery, we ran the calibrated saturation models in 'simulation mode' that excluded the effects of concentration saturation. In the simulations, the exponent b in the power-law saturation model was set to zero, the denominator (C + Ks) in the MM saturation model was set to one, and the coefficient β in the regional saturation model was set to zero. To isolate the effects of concentration, we calculated the difference between the calibrated and simulated nitrogen load predictions, both as a function of Strahler stream order and throughout the Northeastern United States. We approximated uncertainty in load predictions and concentration thresholds from the standards errors of b, Ks, and β (see supplementary material for details).
We evaluated whether one functional form best represents the regional effects of concentration saturation by comparing the overall error (i.e. a measure of how well each saturation model with the same number of parameters explains load observations across the region) and Akaike Information Criterion (AIC) from lowest AIC (ΔAIC) for each model. Generally, the lowest AIC is interpreted as the most accurate model and larger ΔAIC values indicate less empirical support (Burnham and Anderson 2002) (see supplementary material for details). We also assessed the statistical significance (i.e. p-value) of each saturation model calibration parameter because improved model performance (e.g. lower AIC) does not itself indicate whether we can reject the null hypothesis. Statistical significance (i.e. p < 0.10) found in the saturation model parameters rejects the null hypothesis that concentration has no effect on the regional export of nitrogen.
Lastly, our model-inferred uptake velocities and saturation behavior across the Northeastern United States were compared to independently collected measurements of nitrogen uptake velocities from published field studies. These measurements include nitrogen uptake velocities estimated in 72 small streams (Mulholland et al 2008) and in one river basin in the midwestern United States with measurements repeated under varying flow conditions (Böhlke et al 2009). At many of the field sites, both denitrification uptake velocity and total uptake velocity were measured. However, caution must be exercised when comparing independent information because the field measurements reflect short-term conditions rather than the long-term, time-averaged behavior of our model predictions. In particular, measurements of total uptake velocity include seasonal processes such as biotic assimilation in the building of algal biomass in spring and summer that would be cancelled out by a release later in the year by scour, death, and remineralization of nitrogen back into the water column (Bernot and Dodds 2005). Conversely, denitrification and nitrogen burial (e.g. on floodplains) essentially represent permanent removal of nitrogen from the downstream load. Thus, it is likely that the field measurements would define the lower and upper limits of uptake velocity, with an expectation that the field-measured denitrification uptake velocity would tend to be lower while the field-measured total uptake velocity would tend to be higher than the annual model-inferred uptake velocity.
Results
Concentration effects on regional nitrogen delivery patterns
Nitrogen concentration saturation decreased nitrogen removal in headwaters and increased delivery to coasts (figure 2). The model that best described concentration saturation for the Northeastern United States was the regional saturation model (equation (5)) as indicated by the lowest model error, lowest AIC, and significant parameters (table S1). From the regional saturation model, we estimated a net 42% (±8%) reduction in river corridor removal capacity in the Northeastern United States compared to the model simulation without concentration effects, which suggests that saturation has caused a net 10% (±2%) increase in nitrogen mass exported to the coast (figure 3). High nitrogen concentrations are associated with intensive agricultural and urban land use (figures 2(b), (c)). In those areas, nitrogen delivery to the coast may be as much as 30% higher than estimated by models that assumed all river corridors were equally reactive (positive values in figure 2(a)).
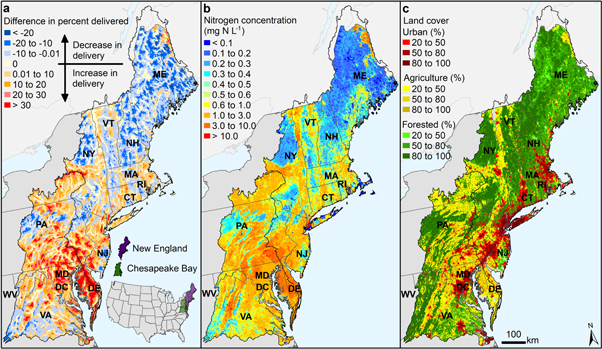
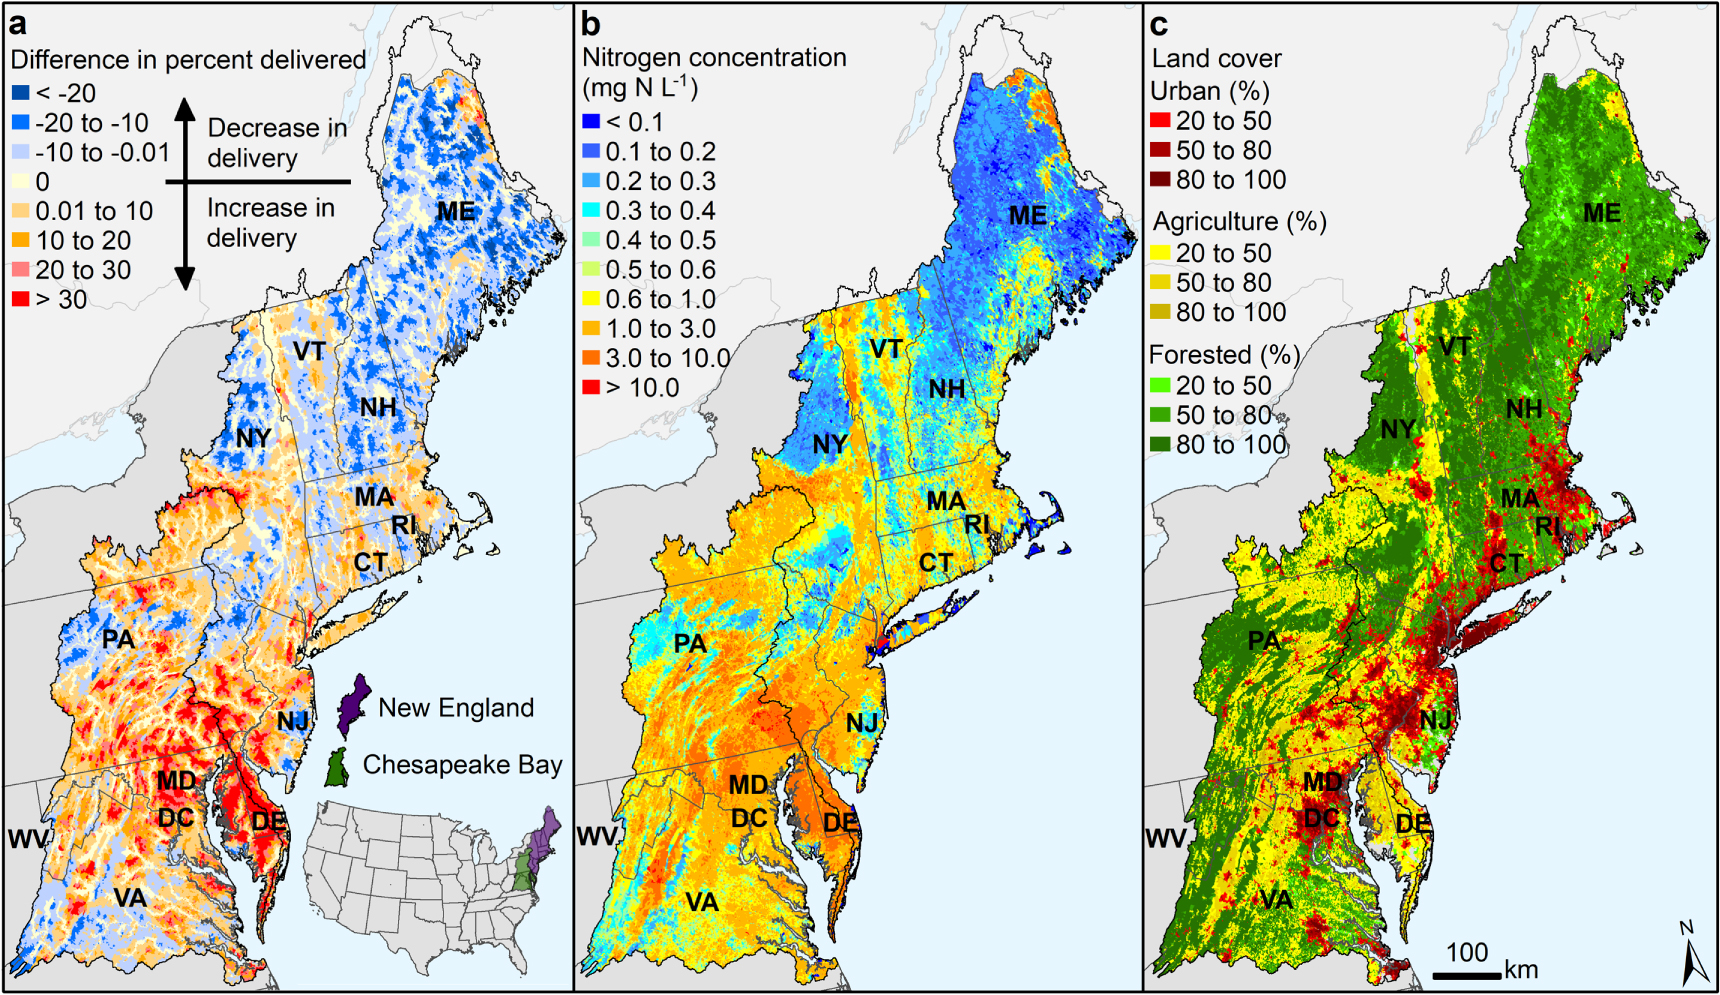
Figure 2. Nitrogen concentration effect on delivery from headwaters to coasts in the Northeastern United States. (a) Predicted difference in delivery caused by accounting for natural and culturally influenced variations in nitrogen concentration. Results shown are from the difference between the calibrated regional saturation model (equation (5)) and the simulation with concentration effects removed (see Methods). (b) Mean annual nitrogen concentration (flow-weighted) of each river corridor reach. (c) Land cover classified by urban, agriculture, and forested (see table S6 for data sources).
Download figure:
Standard image High-resolution image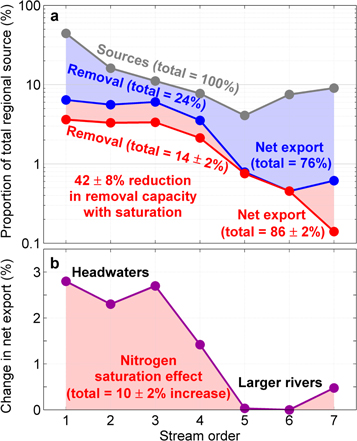
Figure 3. The effect of concentration saturation on nitrogen removal and export in the Northeastern United States. (a) The proportion of nitrogen mass removed relative to the total regional source per stream order. The red line corresponds to the calibrated regional saturation model (equation (5)) that accounts for concentration effects. The blue line corresponds to the simulation where concentration effects were removed. (b) The difference between the mass removed for the two scenarios illustrates the reduction in river corridor removal capacity and increase in net export resulting from nitrogen concentration saturation (i.e. a 42% reduction in removal capacity corresponds to a drop from 24% to 14% removal total or 10% increase in net export of nitrogen mass). Uncertainty in the effect of concentration was approximated using the standard errors of the calibration parameters (see supplementary material for details).
Download figure:
Standard image High-resolution imageOur results suggest that chronic excess nitrogen loading in many agricultural areas has weakened the natural capacity of river corridors to remove nitrogen. Nitrogen concentration saturation in river corridors of the intensively farmed Delaware–Maryland–Virginia peninsula, for example, decreased the estimated net nitrogen removal (positive values in figure 2(a)). Nitrogen mass removed in the high-concentration river corridors of this area was overestimated by as much as 80% in previously published models that assumed all river corridors of a given size were equally reactive (Moore et al 2011). In contrast, river corridors in central Maine, which is largely forested, have lower concentrations (below saturation thresholds) and thus more efficiently remove nitrogen, reducing nitrogen delivery to the coast below what had been estimated with previous models (roughly 10% more mass removed; negative values in figure 2(a)).
Concentration effects on regional nitrogen budget
The concentration saturation effect on net nitrogen removal is greatest in headwaters (defined as stream orders 1 to 3 after Allen et al 2018) primarily because a majority of nitrogen sources enter the river network in headwaters (figure 3). According to the regional saturation model, the river network collectively removed 14% (±2%) of all nitrogen sources, leaving a net 86% (±2%) exported to the coast (figure 3(a)). In contrast, the same network and sources simulated without the effects of concentration saturation was estimated to remove 24% of all nitrogen sources, revealing that chronically high-concentration streams caused 10% (±2%) more nitrogen mass to be exported to the coast. This change in mass export translates to a 42% (±8%) reduction in river corridor removal capacity, with nearly all the reduced removal capacity occurring in headwaters (figure 3(b)).
Nitrogen mainly enters the river network in headwaters, which is important to evaluating the impact of nitrogen concentration saturation. The major contributors to above saturation-level concentrations of nitrogen in headwaters are agricultural and urban runoff and atmospheric deposition (figure S2). In higher-order river corridors, these nitrogen sources are diluted by mixing with source waters lower in nitrogen while also being locally increased by point sources from wastewater treatment facility outflow; the result is that larger rivers on average have lower concentrations compared with headwater streams (figure S3). Furthermore, a consistent finding among all model calibrations was that large rivers generally have low estimated removal rates for nitrogen (tables S2–S5); large rivers generally have too much discharge and not enough contact time across reactive surfaces to remove nitrogen efficiently (Alexander et al 2000, Seitzinger et al 2002). If nitrogen uptake velocity is low in small streams, the likely cause is nitrogen concentration saturation.
Striking differences between CB and NE further confirm the importance of land use on nitrogen export. Concentration saturation effects are more pronounced in CB compared to NE because agricultural sources are higher in CB (figure S4). In CB, chronically high concentrations have caused a net 58% (±12%) reduction in estimated river corridor removal capacity compared to a net 27% (±4%) reduction in NE (figure S4). Concentration saturation effects are greatest in headwaters of both CB and NE, indicating consistent patterns of where in the river network nitrogen delivery is most affected.
Concentration saturation threshold effects on nitrogen uptake velocity
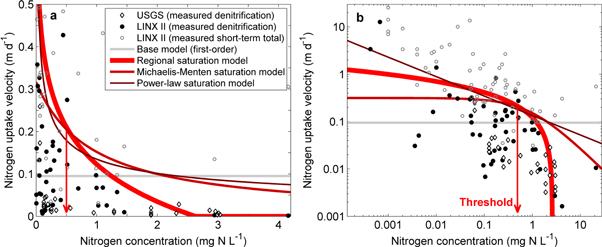
Uptake velocities are nonlinear and tend to decrease with increased nitrogen concentration, indicating that biogeochemically-mediated reactive surfaces eventually can become saturated (figure 4). The long-term mean annual concentration threshold at which nitrogen uptake flux in a river corridor deviates below first-order reaction kinetics was quantified as 0.5 (±0.2) mg N l−1 for the regional saturation model (figure S1). As a result, our improved model of nitrogen transport and fate in the Northeastern United States indicates that more nitrogen mass is delivered from areas where concentrations are above this threshold than previously predicted (positive values in figure 2(a)). The relatively low concentration threshold indicates that the health of a river corridor can be strongly affected by even small additional inputs of nitrogen above the threshold, a finding that is generally consistent with the independent field measurements (figure 4). Our model-inferred estimates of uptake velocity reflect the combined net effects of denitrification, assimilation, and burial averaged over a year, and generally fall within the lower (i.e. denitrification only) and upper (e.g. denitrification plus short-term assimilation, burial, and remineralization processes) limits indicated by the field-based measurements, confirming that our results reasonably express the net effect of nitrogen concentration saturation on the annual nitrogen budget. Calibration of the regional saturation model further suggests that river corridors with mean annual concentrations above 2.6 mg N l−1 (range of 1.8–6.6 mg N l−1 based on the standard error of β) essentially function as pipes because of the effects of nitrogen concentration saturation (figure 4).
Figure 4. Nitrogen uptake velocities across varying degrees of riverine concentration. Nitrogen uptake velocities predicted from the base model and the regional, power-law, and Michaelis–Menten saturation models (equations (3)–(5)) on (a) arithmetic and (b) log–log scales. The lines are the calibrated saturation models for the Northeastern United States. Literature values from USGS (Böhlke et al 2009) and LINX II (Mulholland et al 2008) field studies are included as independent information only for visual comparison and were not used as part of the model calibrations. The USGS values are reach-integrated measures of denitrification uptake velocities repeated across varying flows in two rivers in the upper Mississippi River basin. The LINX II values include both denitrification and total short-term nitrogen uptake velocities from small low-flow rivers scattered across the United States. The concentration threshold (red arrow) indicates where nitrogen uptake flux deviates below first-order rate assumptions for the regional saturation model (see figure S1).
Download figure:
Standard image High-resolution image
The regional saturation model was selected based on lowest model error, lowest AIC, and significant parameters (table S1). Here we delve further into model comparisons to help interpret concentration saturation effects. The threshold concentration was generally consistent between the candidate saturation models—the power-law and MM saturation models both also suggest low concentration thresholds (0.6 (±0.4) and 0.7 (±0.9) mg N l−1, respectively), but larger uncertainty in the MM saturation model makes the associated threshold indistinguishable from zero. However, the models differed somewhat at the low and high concentration extremes (figure 4). Uptake velocity estimated by the MM saturation model is bounded at lower concentrations and approaches zero at much higher concentrations compared to the regional saturation model. The power-law saturation model provides the highest estimates of uptake velocity at the high and low concentration extremes. As a result, estimates of the net increase in nitrogen mass exported to the coast varies as 17% (±20%), 10% (±2%), and 4% (±3%) for the MM, regional, and power-law saturation models, respectively (table S1). However, the MM saturation model parameters are colinear and not statistically significant (table S5), and thus indicate that the functional form may not be the most appropriate to represent and explain regional saturation effects. The parameters of the power-law saturation model are marginally significant (i.e. p-value close to 0.10) while the regional saturation model has clearly significant model parameters.
Accounting for concentration effects in the regional saturation model provided a considerable improvement from the base model (ΔAIC = 6.1; table S1). While there is some overlap between the regional and power-law saturation models, the regional saturation model provided an improvement over the power-law saturation model (ΔAIC = 4.6). There was no markable difference between the regional and MM saturation models (ΔAIC = 1.1), but high standard errors in the MM saturation model parameters resulted in indistinguishable large-scale effects of concentration. We conclude that the regional saturation model provides the most reliable estimates of net export from the region and concentration thresholds.
Discussion
Improved prediction of factors influencing regional nitrogen budgets
Previous field studies detected nitrogen concentration saturation in specific sites (Mulholland et al 2008, Böhlke et al 2009), but were limited to a few dozen streams mostly at low flow in small watersheds and did not reveal the collective effect of concentration on long-term, regional-scale mass balances. Our results demonstrate across a substantial region of the United States that nitrogen concentration saturation reduces river corridor removal capacity. Furthermore, nitrogen concentration saturation occurs mostly in headwaters of agricultural and urban catchments, tipping the balance even further toward the majority of the nitrogen mass exported to coasts will be delivered from these culturally-impacted landscapes.
Our study provides a fundamental step towards improved predictive and forecasting capabilities of regional nitrogen models by better identifying which river corridors efficiently process nitrogen and which ones more efficiently deliver nitrogen through the river network. In the Northeastern United States, agricultural activity and urban development have caused long-term nitrogen concentrations above the saturation threshold throughout nearly half of the river network (figure 2). The extent of agricultural and urban land use is even more widespread in several prominent river basins around the world (Thenkabail 2010)—for example, throughout upper portions of the Mississippi River drainage (Preston et al 2011, US Environmental Protection Agency 2008)—supporting the need to model and understand the effects of nitrogen concentration saturation on delivery to sensitive estuaries worldwide. In such intensively managed areas with concentrations higher than explored here, it is likely that the extent of saturation is an even greater concern because minor decreases in nitrogen inputs may not cause a self-reinforcing boost to nitrogen removal. Alternatively, higher runoff and river flows from agricultural and urban areas may have a confounding effect of shunting nutrients through the river corridor (Raymond et al 2008).
The amount of nitrogen removed by the aquatic system may be overestimated if concentration saturation effects are not considered, which, in turn, may lead to underestimating removal on the terrestrial landscape (Elser et al 2007). We found that better representing removal in the river corridor caused a consistent shift in some of the source component estimates; accounting for concentration saturation effects reduced the estimated fraction of nitrogen sources originating from agricultural activity and increased the fraction from atmospheric deposition (figure S2). Improved modeling of nitrogen loading throughout large river basins that could better support management strategies, starting with establishing more realistic restoration targets, is, therefore, accomplished by better accounting and understanding where and how nitrogen removal varies.
Our study of nitrogen concentration saturation suggests that there is a delicate interplay between concentration and uptake in river corridors. Near the concentration threshold, any additional nitrogen inputs will increasingly push the system towards further saturation that could exacerbate higher nitrogen concentration and downstream loading to the coast. Alternatively, even minor decreases in nitrogen inputs will lessen saturation effects and, therefore, cause a self-reinforcing boost to nitrogen removal that will decrease nitrogen concentration and loading to the coast. The self-reinforcing behavior of decreases in nitrogen concentration and increases in nitrogen removal provides a strong incentive for taking actions to manage nitrogen in river corridors.
Management importance of stressed headwaters
Our finding that the nitrogen concentration saturation threshold is surprisingly low in headwaters of the Northeastern United States has serious implications for future loading of nitrogen to the coast. According to our results, the capacity of the headwater aquatic system to remove nitrogen can be reduced by as much as 42% as a result of the chronically high concentrations caused by agricultural and urban activities. This finding is particularly relevant because headwaters comprise nearly 89% of the total river network length globally (Allen et al 2018) with the vast majority of water and nutrient sources entering the river network in headwaters (Alexander et al 2007).
Quantifying where and why nitrogen sources are processed in the river basin is necessary to inform policy and establish management targets aimed at protecting water resources. Our finding that headwaters are the locus of decreased nitrogen removal capacity agrees with recent findings and evolving policy focused on headwaters rather than large rivers (Loken et al 2018, Sullivan et al 2019). For example, the 1972 Clean Water Act traditionally only provided protection for navigable waters. The 2015 Clean Water Rule extended protection into headwaters (US Environmental Protection Agency and US Department of Defense 2015), but it was recently repealed, leaving the small streams in many states without regulatory protection (Sullivan et al 2019).
Development of new management styles for river corridors that increase nitrogen removal capacity is in its formative stages. Current emphasis is on increasing residence times by adding small riparian ponds that hold waters longer (Goldfarb 2018) and increasing the size and processing capacity of natural reaction zones in river corridors such as floodplains and streambed hyporheic zones (Hester et al 2016, Herzog et al 2018). Our findings suggest that there should be a positive reinforcing behavior between management-initiated reductions in nitrogen concentration above the threshold and further increases in removal capacity, thus easing the effects of concentration saturation. The self-reinforcing reduction in nitrogen concentration suggests that even greater benefits will accrue from developing and prioritizing best management practices than those previously estimated using models that did not account for the effects of nitrogen concentration saturation in river corridors (García et al 2016).
In summary, we found that nitrogen concentration saturation has significant effects, mostly in headwaters, on the annual net nitrogen budget in the Northeastern United States. Although nitrogen concentration saturation begins at a relatively low threshold, our results suggest that management efforts that reduce concentrations above that threshold will have a self-reinforcing effect on increasing the rate of nitrogen uptake in river corridors. The significance of nitrogen concentration saturation effects could be further evaluated across the United States using the methods developed here. Furthermore, the modeling could be extended to evaluate potential seasonality in nitrogen saturation effects, which may fluctuate with seasonally variable nitrogen uptake processes (e.g. Miller et al 2016). However, large-scale modeling of the seasonality of flows, nitrogen concentration, uptake velocities, and the resulting effect of nitrogen saturation will be a considerable undertaking. From a practical standpoint, our regional modeling study serves as a useful foundation for building and improving tools to support evaluation of cost-effective management strategies in both source reduction and river corridor restoration.
Acknowledgments
The US Geological Survey (USGS) River Corridor Working Group developed the project idea in their meetings at the John Wesley Powell Center with support from the USGS and the National Science Foundation Hydrologic Sciences Program. NMS, JWH, RBA, GES, and CPK also received support from the USGS Water Resources Availability Program. NMS was additionally supported by a USGS Mendenhall Postdoctoral Fellowship. EWB and DS received support from the US Department of Agriculture National Institute of Food and Agriculture. JDGV received support from the US Department of Energy Subsurface Biogeochemistry Research Program as part of Pacific Northwest National Laboratory's scientific focus area. DS also received support from the Virginia Agricultural Experimental Station. The SPARROW source code is also publicly available (https://water.usgs.gov/nawqa/sparrow/). Expressions and equations in the Methods section can be used to reproduce the results. Any use of trade, firm, or product names is for descriptive purposes only and does not imply endorsement by the US Government. The authors declare no competing interests.
Data availability
All datasets used are publicly available. See Table S6 in Supplementary Material for data sources.
Author contributions
RBA, EWB, NMS, and JWH conceived the study. NMS and JWH wrote the paper with contributions from RBA, EWB, JDGV, DS, and CPK. The data compilation and modeling were performed by NMS, RBA, GES, and JWH. All authors interpreted results.