

Abstract
The risks of flood and drought have been projected to increase in many regions due to global warming. Afforestation is considered an adaptation option because it reduces flood risks by decreasing total runoff and peak river discharge, but it also exacerbates drought risks by increasing evapotranspiration. In this study, both effects of afforestation were evaluated in comparison with changes caused by climate warming from the viewpoint of an adaptation measure, using a land surface model. The upper Chao Phraya River basin was taken as a case study. The present climate was set as a base condition and future climate conditions projected by the moderate (RCP4.5) and strong (RCP8.5) warming scenarios in the middle and late 21st century were used. The effects of afforestation were much smaller than the changes caused by warming even with the extreme forest area expansion and soil property changes. The effect of afforestation that reduced runoff was marked in the wet season, whereas the effect of afforestation that increased evapotranspiration was noticeable in the dry season leading to little increase in dry-season runoff. These results indicate that both the decrease in runoff that reduces flood risks in the wet season and the increase in evapotranspiration that exacerbates drought risks in the dry season should be taken into consideration when evaluating the hydrological effects of afforestation under global warming.
Export citation and abstract BibTeX RIS

Original content from this work may be used under the terms of the Creative Commons Attribution 4.0 licence. Any further distribution of this work must maintain attribution to the author(s) and the title of the work, journal citation and DOI.
1. Introduction
Under global warming, the number of people exposed to flood and drought is projected to increase worldwide (IPCC 2014b). Within the water sector, afforestation is considered an adaptation option that could prevent increased flooding by reducing runoff, as well as a mitigation option against global warming itself by reducing greenhouse gases in the atmosphere (IPCC 2014a).
Numerous studies have investigated the effects of forest-cover change from various viewpoints. Zhang et al (2017) reviewed the effects of land use change (LUC) on annual runoff and presented the decreases by forest gain at large scales only. Farley et al (2005) and Lane et al (2005) reported the decreases in low-flow discharge in small watersheds. However, forests also have the effect of increasing evapotranspiration (Cuo 2016), so they can also reduce water resources and exacerbate water scarcity (e.g. Farley et al 2005). It is therefore important to consider the effects of exacerbating water scarcity by increasing evapotranspiration, as well as the effects of flood mitigation, when considering afforestation as a climate change adaptation measure.
Because afforestation is related to the water balance of the entire basin throughout the year, in contrast to adaptation measures such as installation of embankments, it is desirable to set the study area over a wide area. In the case of targeting a wide area, studies involving model simulations are common because of the difficulties related to wide-area observations. This is particularly the case in Southeast Asia, where few hydrological and meteorological observations have been collected. Exceptionally, Tebakari et al (2018) analyzed the long-term flow data of the Nan River, a tributary in the northeastern Chao Phraya River basin (CP) in Thailand, and reported an increase in low streamflow suggesting a relationship to the decrease in forest areas. Lacombe et al (2016) combined observation data and model simulations and reported an increase in runoff due to afforestation in Laos and a decrease in runoff due to reforestation in Vietnam. With regard to evapotranspiration, observations are limited to the plot scale, and few studies have investigated changes in evapotranspiration due to LUC using observation data. Exceptionally, Kim et al (2014) used the meteorological observation data from 2003 to 2013 at Tak in the Ping River basin, a tributary in the northwestern CP, to show that the effects of climate conditions on the evapotranspiration changes were stronger than those of LUC.
Few hydrological studies have investigated the effects of LUC over a wide area in Thailand, even including studies involving models. Thanapakpawin et al (2007) used the Distributed Hydrology Soil Vegetation Model and showed that the expansion of highland crops (i.e. deforestation) increased water yields both annually and in the wet season in the Mae Chaem River basin in the northwestern CP. Wangpimool et al (2013) showed that streamflow was reduced in the wet season and increased in the dry season due to reforestation in the watershed in the upper Nan River basin using the Soil and Water Assessment Tool (SWAT) model.
With regard to the hydrological changes due to future climate warming, precipitation is projected to increase in CP, meaning that runoff will increase, particularly in the wet season (Kotsuki et al 2014, Watanabe et al 2014). However, the increased water yield in the wet season is difficult to utilize as a water resources because of the limited capacity of the reservoirs in the basin (see section 2.1); this was demonstrated during the 2011 Chao Phraya River flood (Komori et al 2012). Moreover, deforestation has proceeded in the area since the late 20th century (Royal Forest Department 2017), which can exacerbate the risk of flooding that occurs regularly in the late wet season. Accordingly, afforestation is included in Thailand's National Adaptation Plan (ONEP 2018). However, the effect of afforestation on increasing evapotranspiration is also important in Thailand, because both of floods in the late wet season and water scarcities in the late dry season are nationwide issues.
Few studies have considered both climate change and LUC in Thailand; Ponpang-Nga and Techamahasaranont (2016) used a monthly water balance model in the upper CP under the A2 and B2 climate scenarios (IPCC 2001) for the 21st century projected by a global climate model (GCM) and showed increases in precipitation, runoff, and evapotranspiration on an annual basis under three deforestation scenarios. Chacuttrikul et al (2018) reported an increase in river discharge caused by warming in northeast Thailand using a hydrological model (SWAT-type, H08) and a land use model (CLUE). They also reported that the impact of LUC would be smaller in the future compared to the present, with a decreasing trend of the effect of afforestation on runoff under stronger warming conditions. Igarashi et al (2019) also used a hydrological model (SWAT) and a land use model (CLUE) and reported greater river discharge from future rainfall with a 10 year return period when forest coverage was assumed to be less than 45% of the present coverage.
Overall, the effects of deforestation and afforestation on runoff have been investigated in various places. However, the effects of afforestation as an adaptation measure to global warming have not been evaluated with respect to both flood risks and water scarcity. Evaluation of the effects of afforestation on both the risks, including seasonal changes, is essential not only for Thailand, but also for other countries with similar hydroclimate characteristics, that is, with distinct rainy and dry seasons.
The objective of this study was to examine the hydrological effects of afforestation as an adaptation option to global warming, on both runoff and evapotranspiration, both annually and in the wet and dry seasons, in comparison with changes caused by future warming. A land surface process model was used, and the upper Chao Phraya River basin was used as the target area for a case study.
2. Data and methods
2.1. Study area
The CP is located in central and northern Thailand, with an area of approximately 160 000 km2. The upper and lower basins are divided at Nakhon Sawan (15 °40' N, 100 °07' E; hereafter C2). The area of the upper CP (outlet at C2) is 109 973 km2, covering approximately two thirds of the total area of the CP. The altitudes of the headwaters are ∼1500 m, but most of the middle and lower basins are rather flat (Komori et al 2012). The annual precipitation is ∼1250 mm, and the annual mean temperature is ∼26 °C (Thai Meteorological Department 2015). There is a marked seasonal cycle: precipitation during the wet season (May–October) is ∼950 mm, while that in the dry season is ∼300 mm (Thai Meteorological Department 2015).
The upper watershed has two major dams for irrigation and power generation, the Bhumibol Dam (BB) on the Ping River in the northwestern CP and the Sirikit Dam (SK) on the Nan River in the northeastern CP. The catchment area of BB is 26 400 km2, and the total and active storage capacities are 13.5 billion m3 and 9.7 billion m3, respectively. The mean annual inflow is 186 m3 s−1, leading to the 1.6 year residence time of the lake water (active capacity divided by inflow). The catchment area of SK is 13 000 km2, and the total and active storage capacities are 9.5 billion m3 and 6.7 billion m3, respectively. The mean annual inflow is 175 m3 s−1, and the residence time of the lake water is 1.2 years (Shintani et al 1994). Precipitation in the wet season is stored in the reservoirs, and the amount of water supplied for irrigation in the dry season is determined from the water storage in the reservoirs.
2.2. Land surface model
A land surface model, MATSIRO (Takata et al (2003), Nitta et al (2014); supporting information S1.1), was used for numerical experiments to explore the effects of vegetation canopy, such as radiation transfer and reflection, interception of precipitation, transpiration, root uptake of soil moisture, and water and energy exchanges by eddy fluxes. Four types of runoff processes were considered, infiltration excess runoff, surface storage overflow, saturation excess runoff, and base flow. TOPMODEL (Beven and Kirkby 1979) was used to calculate saturation excess runoff and base flow with parameters that consider the sub-grid topographical features to represent the different runoff responses in accordance with terrain.
River discharge was calculated using the river channel network model, TRIP (Oki and Sud 1998). In TRIP, runoff caused by the land surface hydrological processes at each grid point, described above, flows out of the grid along the river channel network of TRIP assuming a constant flow velocity for simplification. In the calculation, river flow changes due to irrigation water intake and dam operation were not taken into account. When the calculated river flow was compared to observations, the observed river flow was 'naturalized,' meaning that changes in flow rate due to irrigation intake and dam operation were compensated for from the observed values. This means that additional considerations for the effects of irrigation and dam operation are necessary when discussing actual adaptation measures.
The model was used at a horizontal resolution of 5 arc minutes in the calculation domain of 13–20° N, 97–102° E, with a meteorological forcing dataset.
2.3. Input data
The input data of the simulation were set in accordance with the observed facts as much as possible, as follows.
The meteorological conditions (precipitation, surface air temperature, humidity, air pressure, shortwave and longwave downward radiations, and wind speed) at a horizontal resolution of 5 arc minutes for the late 20th century (IMPAC-T Forcing Data; IFD-K10) and those for the mid and late 21st century (IMPAC-T Driving Data; IDD-2.1) were provided by Kotsuki et al (2014) and Watanabe et al (2014). In preparing these meteorological data, local observation data and the high-resolution elevation data were used to correct the biases in the global meteorological data and to interpolate from the low resolution of the global data. The data periods are shown in table 1. For the future climate, two warming scenarios of the representative concentration pathways (RCPs) were used: one moderate scenario (RCP4.5) and one strong scenario (RCP8.5) (IPCC 2013). The results of three GCMs (CSIRO-Mk3.6, GFDL-ESM2M, and MIROC5) were used from IDD-2.1 for each warming scenario and each future period in our simulations.
Table 1. List of simulations.
| Period | Warming scenarios | Land use | Soil property | Names of simulations |
|---|---|---|---|---|
| (a) Present conditiona | ||||
| 1981–2004 | — | PRS | CTL | 20 C |
| (b) Warmed conditionb | ||||
| 2040–2059 | RCP4.5 (3 GCMs) | PRS | CTL | 2050R4-PRS |
| AFR20 | CTL | 2050R4-AFR20 | ||
| AFR100 | CTL | 2050R4-AFR100 | ||
| AFR100 | SOL100 | 2050R4-SOL100 | ||
| RCP8.5 (3 GCMs) | PRS | CTL | 2050R8-PRS | |
| AFR20 | CTL | 2050R8-AFR20 | ||
| AFR100 | CTL | 2050R8-AFR100 | ||
| AFR100 | SOL100 | 2050R8-SOL100 | ||
| 2080–2099 | RCP4.5 (3 GCMs) | PRS | CTL | 2090R4-PRS |
| AFR20 | CTL | 2090R4-AFR20 | ||
| AFR100 | CTL | 2090R4-AFR100 | ||
| AFR100 | SOL100 | 2090R4-SOL100 | ||
| RCP8.5 (3 GCMs) | PRS | CTL | 2090R8-PRS | |
| AFR20 | CTL | 2090R8-AFR20 | ||
| AFR100 | CTL | 2090R8-AFR100 | ||
| SOL100 | SOL100 | 2090R8-SOL100 | ||
aData source: IFD-K10 (Kotsuki et al 2014). bData source: IDD-2.1 (Watanabe et al 2014).
The land use map for 2000 was used as the present condition (PRS in table 1), in which croplands are distributed in the lower plain areas of the CP. Those have been markedly expanded in the late 20th century. Then the land use map for 1970 was used as the 20% pseudo-afforested condition (AFR20 in table 1) because the area of cropland was 20% smaller than that for 2000 (table S1 is available online at stacks.iop.org/ERL/15/044020/mmedia), and the map for 1950 was used as the 100% pseudo-afforested condition (AFR100 in table 1) because almost no cropland existed. In fact, these afforestation scenarios were considerably strengthened scenarios; namely, even AFR20 would be extremely difficult to achieve socially and economically for the wide area covered in this study. However, these extreme conditions were used to estimate the maximum effect of afforestation. The land use maps in past years were determined from the distributions of historical cropland fractions (Hurtt et al 2011) and potential vegetation (Ramankutty and Foley 1999) (see Watanabe et al (2010) for details).
The effects of vegetation represented in MATSIRO (section 2.2) are related to the leaf amounts specified by the leaf area index (LAI). Changes in LAI due to LUC in this study were assigned to those of potential vegetation in the same way as Watanabe et al (2010). It was assumed that the forest had reached maturity in the future simulation settings of this study. That was because, if LUC were to have occurred at the present time, the intervals of the simulation periods (50 years and 100 years) were similar to or longer than the usual replanting intervals for teak forests in Southeast Asia (Mapa 1995, Lacombe et al 2016). In fact, it usually takes only 3–5 years for teak forests to close their canopy after planting (Lacombe et al 2016).
Forests are known to produce litter that enhances the formation of organic soil layers and develops soil structure to increase water retention, creating what is known as 'forest soils.' The depth is usually about 10–50 cm, and the formation takes several decades (Dubbin 2001). Such changes in soil properties are thus important in the time scale of the simulation in this study. The soil properties were changed at the grid points where LUC was applied in AFR100 (SOL100 in table 1), with the goal of estimating the maximum effects caused by afforestation. Based on the survey results in Sri Lanka (Mapa 1995) and Japan (Ohta et al 1989, Kosugi 2007), 1.5 times greater porosity and six times higher hydraulic conductivity were assigned to the three layers of surface soil (0–5 cm, 5–25 cm, and 25–100 cm).
2.4. Numerical experiments and analyzes
The present meteorological condition with PRS land use was taken as a base simulation in the analysis (20 C in table 1). For the warming meteorological conditions, two warming scenarios each from three GCMs during two periods yields 12 warming conditions. The equilibrium for each meteorological condition was prepared by a spin-up calculation conducted using PRS land use data. The land use map was then changed from PRS to AFR20 or AFR100 to examine the effects of expanding forest area. In addition, soil properties were changed to SOL100 (table 1).
The monthly means for 1981–1999 (20 C), 2041–2059 (hereafter 2050), and 2081–2099 (hereafter 2090) were used for the analysis, and the target area was the upper CP (outlet at C2). The effects of global warming were calculated from the difference between 20 C and the four warming conditions with PRS land use (2050R4-PRS, 2050R8-PRS, 2090R4-PRS, and 2090R8-PRS) for each of the three GCMs. Effects of afforestation were calculated from the difference between PRS and the three afforested simulations under each warming condition, for example, the differences of 2050R4-AFR20, 2050R4-AFR100, and 2050R4-SOL100 from 2050R4-PRS for each of the three GCMs.
The reproducibilities of seasonal cycles and interannual variations of river discharge and energy balance, represented by a Bowen ratio (i.e. a sensible heat flux divided by a latent heat flux), were verified by comparing the simulation results with the observations in the upper CP (supporting information S2).
3. Results and discussion
This section presents hydro-meteorological changes due to global warming (sections 3.1 and 3.2), and the effects of afforestation (sections 3.3 and 3.4), to explore its efficacy as an adaptation option for reducing flood and drought risks.
3.1. Annual changes due to global warming
The annual means of precipitation, air temperature, and downward net radiation in the upper CP in the 20 C simulation were 978.5 mm year−1, 25.6 °C, and 593.6 W m−2, respectively. Under those meteorological conditions, the annual means of runoff and evapotranspiration were 167.6 mm year−1 and 811.9 mm year−1, respectively. Each value increased as global warming proceeded, that is, in the order of 2050R4, 2050R8, 2090R4, and 2090R8 (table 2). The change ratio of precipitation to that in 20 C was +20% (in 2050R4, smallest) and increased to +35% (in 2090R8, largest), where the ranges of the three GCMs were approximately ±5%. The annual mean runoff increased under the warming climate in accordance with the increase in precipitation (table 2, figure 1(a)). The change ratio of runoff to that in 20 C was as large as +84% in 2050R4 and increased to +162% in 2090R8. The change ratio of evapotranspiration to that in 20 C was not as large as that of runoff, +7% in 2050R4, increasing to 9% in 2090R8. In short, the increase in precipitation (e.g. 191 mm year−1 in 2050R4) was converted mainly into an increase in runoff (140.1 mm year−1 in 2050R4), in contrast to the moderate increase in evapotranspiration (55 mm year−1 in 2050R4).
Table 2. Annual increases from 20 C under the four warming scenarios (2050R4, 2050R8, 2090R4, and 2050R8) with the PRS land use. Simulated changes were averaged over the upper CP for the three GCMs.
| Warming scenario | 2050R4 | 2050R8 | 2090R4 | 2090R8 |
|---|---|---|---|---|
| (a) Changes in driving conditions | ||||
| Precipitation [mm year−1] | +191.1 | +225.5 | +275.3 | +341.7 |
| Air temperature [°C] | +1.7 | +2.1 | +2.5 | +4.0 |
| Downward radiation [W m−2] | +16.2 | +18.6 | +24.2 | +35.2 |
| (b) Simulated changes (land use: PRS) | ||||
| Runoff [mm year−1] | +140.1 | +187.5 | +214.5 | +272.2 |
| Evapotranspiration [mm year−1] | +55.1 | +42.3 | +64.8 | +76.3 |
| Net radiation [W m−2] | +13.2 | +12.9 | +15.8 | +15.3 |
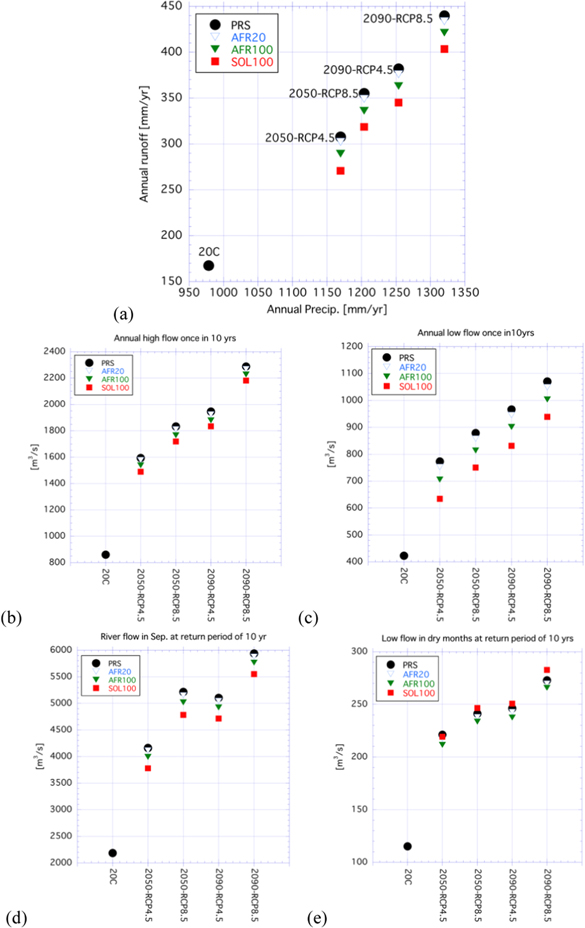
Figure 1. (a) Annual precipitation versus annual runoff in the upper CP for the simulations in table 1. Closed circles denote the results with PRS land use under the present (20 C) and four warming scenarios (2050R4, 2050R8, 2090R4, and 2090R8 from left to right); open triangles denote those with AFR20 land use under the warming scenarios; closed triangles denote AFR100; closed squares denote SOL100. Averages of the three GCMs (CSIRO-Mk3.6, GFDL-ESM2M, and MIROC5) are shown for the results under the warming scenarios. (b) High annual streamflow at C2 once in 10 years in each climate condition. Symbols are the same as (a). (c) The same as (b) but for low annual streamflow. (d) The same as (b) but for high streamflow in September. (e) The same as (b) but for low streamflow in the dry season.
Download figure:
Standard image High-resolution imagePrecipitation and runoff increased proportionally to the warming climate uniformly, whereas evapotranspiration was lowest in 2050R8 (table 2) because evapotranspiration is controlled by multiple factors that interact with each other, including temperature, radiation, atmospheric humidity, and soil moisture.
In addition to examining the mean changes, the high annual streamflow and low annual streamflow once in 10 years were calculated in the upper CP by assuming a Gumbel distribution. They correspond to the annual water yields in the wet years and dry years, respectively. Both the high and low annual streamflow once in 10 years were doubled from 20 C under the mildest warming (2050R4) and nearly tripled under the strongest warming (2090R8) (closed circles in figures 1(b) and (c)). It follows that the annual water yields in the upper CP were markedly increased by the warming in both the wet and dry years.
3.2. Seasonal changes due to global warming
Because there is a clear seasonal cycle in the study area, a portion of the precipitated water in the wet season remains in the soil and is transpired by vegetation in the dry season (figure S4); that is, a carryover of land water from the wet season to the dry season. By separating the increases due to warming into the wet season (from May to October) and the dry season (from November to April), the precipitation increase was clearly concentrated in the wet season, most of which led to a runoff increase in the wet season (figure 2). The carryover increased due to warming in addition to the precipitation increase in the dry season, that is, the 'land water input' in the dry season increased. As a result, both the runoff and evapotranspiration increased in the dry season at a similar magnitude due to warming.
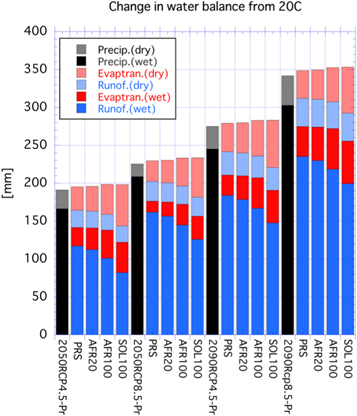
Figure 2. The increases in precipitation (black bars), runoff (blue bars), and evapotranspiration (red bars) from 20 C under the four warming scenarios (2050R4, 2050R8, 2090R4, and 2090R8) with each LUC condition (PRS, AFR20, and AFR100) and the soil property change (SOL100). The solid colors denote changes in the wet season (May–October), and the faded colors denote changes in the dry season (November–April).
Download figure:
Standard image High-resolution imageThe mean monthly changes showed that the amplitudes of the seasonal cycles were increased by the warming (figure S6): the precipitation increase was concentrated in the wet season and resulted in large increases in runoff and river discharge in the wet season. The monthly peak in river discharge at C2 was simulated in September when floods occur regularly and was doubled or even tripled by the warming (figure S6(d)). In contrast, the increase in evapotranspiration occurred rather uniformly throughout the year. The seasonal changes caused by warming were in agreement with Kotsuki et al (2014).
Considering flood risks, high streamflow in September at C2 once in 10 years was calculated by assuming a Gumbel distribution. The high streamflow was doubled from 20 C even under the mildest warming (2050R4) and nearly tripled under the strongest warming (2090R8) (closed circles in figure 1(d)). Additionally, the return period of September streamflow at 3000 m3 s−1, the largest value in 20 C (in 1995), was estimated to be 38.7 years in 20 C and was remarkably reduced to 3.5, 1.9, 2.1, and 1.5 years under the warming conditions of 2050R4, 2050R8, 2090R4, and 2090R8, respectively (table S2). Those results indicate that flood risks in the late wet season would be markedly increased by warming.
For drought risks, low streamflow in the dry season (November–April) at C2 once in 10 years was calculated. The low streamflow was again doubled from 20 C under the mildest warming (2050R4) and nearly tripled under the strongest warming (2090R8) (closed circles in figure 1(e)). Namely, the water yield in the dry season in drought years was increased by the warming. However, the magnitude of the increase in the low streamflow in the dry season was only a quarter of the increase in the low annual streamflow (figure 1(c)). This implies that the increase in water yield in the dry season in drought years would have a limited effect on reducing the risks of water scarcity.
Summarizing the changes caused by warming, the precipitation increase due to warming was converted mainly to runoff on an annual basis, leading to the considerable increase in annual runoff (i.e., the annual water yield). The increase in runoff was highly concentrated in the wet season, with a remarkable increase in high streamflow in September, indicating a strong increase in flood risk. In contrast, the low streamflow in the dry season was increased due to warming, but its magnitude was only a quarter of the increase in the low annual streamflow. Additionally, the increase in evapotranspiration was noticeable year-round. These results imply that the drought risk in the dry season would not be reduced by the warming.
3.3. Annual effects of afforestation on runoff and evapotranspiration under global warming
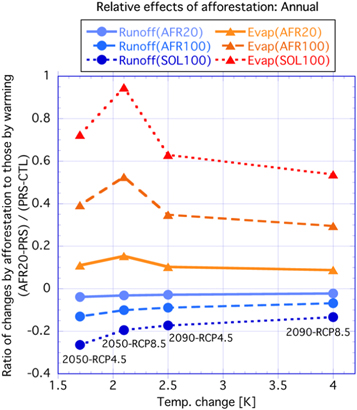
The annual hydrological changes due to afforestation were calculated from the difference between PRS and the three afforestation scenarios (AFR20, AFR100, and SOL100) under each warming condition (2050R4, 2050R8, 2090R4, and 2090R8). The annual runoff decreased due to afforestation (figure 1(a)). However, the reductions were much smaller than the marked runoff increases accompanying the annual precipitation increases due to warming. The reduction ratio (in negative values) of runoff by AFR20 to the increase due to the warming was at most −3.8% (2050R4) and further decreased to −3.2% (2050R8), −2.8% (2090R4), and −2.2% (2090R8) (the light blue solid line in figure 3 and table S3). In contrast, annual evapotranspiration increased due to afforestation. The increase ratio (in positive value) of evapotranspiration by AFR20 to the increase caused by warming was at most +15.4% (2050R8) (the orange solid line in figure 3 and table S3). The signs of the changes in annual runoff and annual evapotranspiration by afforestation are identical to those reported by earlier studies (e.g. Cuo 2016) and signify reductions in the annual water resources of the basin.
Figure 3. The ratio of the annual change caused by afforestation to the annual change caused by warming versus the change in air temperature under each warming scenario (2050-RCP4.5, 2050-RCP8.5, 2090-RCP4.5, and 2090-RCP8.5), as indicated in the panel. Circles denote the ratios for runoff; triangles denote the ratios for evapotranspiration. Solid lines denote the results with AFR20; dashed lines denote the results with AFR100; dotted lines denote the results with SOL100. Negative values denote a decrease due to afforestation; positive values denote an increase due to afforestation. The means of the ratios for the three GCMs are shown.
Download figure:
Standard image High-resolution image
The simulations for sensitivity analysis (AFR100 and SOL100) showed that the effects of afforestation on reducing runoff and increasing evapotranspiration were considerably strengthened (figures 1 and 2). The reduction ratio of runoff due to afforestation to the effects of warming were increased: specifically, to −13.0% for runoff reduction and to +39.3% for evapotranspiration increase by expanding the afforestation area (AFR100), and to −43.6% and +72.5% by soil property changes (SOL100) (the broken lines and dotted lines in figure 3 and table S3).
It follows that afforestation reduced annual runoff and increased annual evapotranspiration, which is consistent with the findings of Cuo (2016) and Zhang et al (2017). In other words, it reduces annual water yield, namely, annual water resources. The effects were much smaller with AFR20 than the changes due to warming. It should also be noted that even the AFR20 scenario would be difficult to achieve in reality, as mentioned in section 2.3.
Examinations of the extreme values of annual streamflow revealed that the high annual streamflow and the low annual flow once in 10 years decreased due to afforestation (figures 1(b) and (c)). The high annual streamflow increased by 750–1450 mm year−1 with warming while decreased by less than 100 mm year−1 with afforestation. The low annual flow increased by 350–650 mm year−1 with warming but decreased by ∼150 mm year−1 with afforestation. Namely, the effects of afforestation on reducing annual flow were appreciably larger in dry years than in wet years compared to the changes due to warming; that is, the decrease in annual water resources due to afforestation would be greater in drought years than in flood years, exacerbating the risk of water scarcity.
3.4. Seasonal effects of afforestation on runoff and evapotranspiration under global warming
The seasonal effects of afforestation on runoff and evapotranspiration were examined. In the wet season, afforestation reduced runoff and increased evapotranspiration (figure 2). The water input to land in the dry season, which is the sum of the dry season precipitation and the carryover of land water from the wet season to the dry season, slightly increased due to afforestation (AFR20). In the dry season, evapotranspiration increased due to afforestation, hence there was no significant increase in runoff (figure 2).
Whether runoff (i.e. water yield) in the dry season would be increased by afforestation is important for water resource issues, but that is not apparent due to the multiple interacting processes involved. We thus tried to explain the processes that led to almost no increases in dry season runoff due to afforestation in this case study in CP, based on the components of water balance. In fact, the components of water balance cannot directly be validated by observations, but the overall performance of the energy and water balances for seasonal and interannual variations were validated with observation (supporting information S2). Moreover, the seasonal cycles of the components were confirmed to be reasonable (supporting information S4.1). In the analysis, the effects of forest area expansion (AFR20 and AFR100) and the effects of the soil property changes (SOL100) were evaluated separately.
The increases in evapotranspiration were marked in both wet and dry seasons. The evapotranspiration increase in the wet season was attributed to the expansion of forest areas (AFR20 and AFR100): the increases in interception evaporation and transpiration (figure S7(g) and (h)) were due to the increase in LAI. On the other hand, the runoff reduction by afforestation was marked not only in AFR20 and AFR100, but also in SOL100 (figure 2). This was attributed to the soil moisture decrease (figure S7(a)–(f)) due to the reduced through-fall precipitation caused by the increased LAI with AFR20 and AFR100, while it was attributed to the surface runoff decrease (figure S7(j)) induced by the deeper ground water table (figure S7(l)) due to the soil moisture decrease in deep soil in SOL100 (figures S7(d)–(f)). As a result, the runoff reduction was larger than the evapotranspiration increase in the wet season, leading to a small increase in carryover. In the dry season, the evapotranspiration increase was attributed to the transpiration increase (figure S7(h)) because of the increased LAI and the deeper root distribution in AFR20 and AFR100, and to the increase in ground evaporation in SOL100 (figure S7(i)) due to the increased near-surface soil moisture (figure S7(a)–(c)) accompanied by the increased soil porosity.
It should be noted that the interpretations of the changes in runoff and evapotranspiration, as described above, would differ in accordance with the meteorological conditions and runoff characteristics in each place and at each time. The amounts of the carryover of land water would thus differ from place to place and time to time. We believe that this type of discussion could contribute to a comprehensive understanding of the hydrological effects of forests, which include multiple interacting processes.
In the examinations of the extreme values, the high streamflow at C2 in September once in 10 years decreased marginally in AFR20 and slightly more in AFR100 and SOL100 (figure 2(d)). Additionally, the return periods for September river discharge of 3000 m3 s−1 were extended slightly, for example in 2050R4, from 3.5 years (PRS) to 3.6 years (AFR20), 4.1 years (AFR100), and 7.0 years (SOL100) (Table S2). It follows that the effects of afforestation in reducing flood risk were only marginal under the 20% afforestation and were just noticeable under the extreme afforestation conditions.
For the drought risk, the low streamflow at C2 in the dry season once in 10 years was appreciably decreased by expanding the forest areas (AFR20 and AFR100), while it was increased by considering the soil property changes (SOL100) (figure 1(e)). This was attributed to the increase in base flow due to the increased hydraulic conductivity (figure S7(k)). The increased low streamflow in the dry season in SOL100 might suggest a reduction in drought risk by considering the high water retention of forest soil. This seems to agree with the observed increasing trends of low-flow in the upper Nan River watershed in the northeastern CP (Tebakari et al 2018), attributed to the decrease in natural forests in the watershed (Baicha 2016). However, the magnitude is very uncertain due to the well-known difficulty in defining large-scale soil properties.
4. Conclusions
We conducted a series of hydrological simulations in the Chao Phraya River basin in Thailand to investigate the effects of afforestation as an adaptation measure for climate change in the water sector. We compared the effects of afforestation to the changes caused by climate warming and found that the effects of afforestation on decreasing annual runoff and increasing annual evapotranspiration were much smaller than the increases caused by warming: the ratio of runoff reduction due to 20% afforestation (AFR20) to the increase due to warming was at most −3.8% under the weakest warming (2050R4), in contrast to the large ratio of runoff increase due to warming compared with that in 20 C (+84%, 2050R4). The analysis of the high annual streamflow and the low annual streamflow once in 10 years at C2 revealed that both levels were decreased by afforestation, indicating that annual water resources decreased both in water-abundant years and in water-scarce years.
The clear seasonal cycle in CP induces the carryover of land water from the wet season to the dry season. Dividing the changes into the wet and dry seasons, a large portion of the increases in precipitation, and hence runoff, occurred in the wet season due to warming. Runoff was decreased by afforestation in the wet season, indicating a reduction in the flood risk, but the magnitude of the decrease was much smaller than the increase caused by warming, similar to the annual changes. The water input to land in the dry season, that is, the sum of dry season precipitation and the carryover of land water, was increased by warming, as well as by afforestation, although only slightly. However, those increases did not lead to an increase in runoff (i.e. an increase in water resources) in the dry season because evapotranspiration increased noticeably in the dry season. The decrease in the September high streamflow due to afforestation indicated a reduction in the flood risk, while the decrease in the low streamflow in the dry season due to expansion of afforestation areas indicated an exacerbated risk of water scarcity.
Climate warming exacerbates the risks of annual water resource shortages, flooding in the wet season, and water scarcity in the dry season. Afforestation can exacerbate the risks of annual water resource shortages and water scarcity in the dry season, while it can reduce the risk of flooding in the wet season. Because reducing flood flows would not reduce available annual water resources, that effect would be considered positive. In the present study, the afforestation conditions were considered to be 20% and 100% of the present cropland areas (AFR20 and AFR100). It is worth mentioning, however, that even 20% afforestation is very difficult to achieve in reality, because many people live on incomes generated from working on the cultivated land. The 100% afforestation scenario is therefore virtually impossible to achieve. The effects of afforestation were barely appreciable in AFR100 and only marginal in AFR20. Thus, the benefit of afforestation in reducing flood risks would be rather small under actual adaptation measures.
In conclusion, the hydrological effects of afforestation that reduce flooding risks and exacerbate drought risks should be equally considered in regions exposed to both risks, such as the Chao Phraya River basin. However, these effects were very small, compared to the changes due to global warming in a large area, such as the upper CP. These results provide additional viewpoints for evaluating afforestation as a mitigation and adaptation measure to climate change.
Acknowledgments
This research was supported by the Science and Technology Research Partnership for Sustainable Development (SATREPS) program of the Japan Science and Technology Agency (JST) and the Japan International Cooperation Agency (JICA).
Acronyms
IPCC: Intergovernmental Panel on Climate Change. ONEP: Office of Natural Resources and Environmental Policy and Planning, Thailand.
Data availability statements
The data that support the findings of this study are available from the authors upon reasonable request.