

Abstract
China's rice agriculture, a primary source of greenhouse gases (GHGs), has experienced great changes in the last five decades due to changes in dominant varieties and farming practices. However, the impacts of these changes on GHG emissions have not been comprehensively assessed. While most earlier studies focused on the GHG emissions per unit area, recent research indicated that the yield-scaled impact may better reflect the reality. Through integrating the results from a meta-analysis, two multi-site field experiments and an expert survey, we quantify the integrated impacts of different practices on both area- and yield-scaled GHG emissions in China. Results from the expert survey showed that rice planting area has shifted northwards, and alternate water-saving (WS) irrigation has been applied in nearly 78% of Chinese rice paddy areas in both the rice nursery stage and post-transplanting period over the past five decades. The changes of these practices and replacement of new rice varieties have increased China's rice yield by 131%. During the same period, cropping system adjustment, variety replacement, and implementation of WS irrigation have reduced total GHG emissions by 7%, 31%, and 42%, respectively. Also, the major decrease in GWP occurred prior to the 2000s, and the decreasing trend continued in the post-2000s period but at a slower rate. Our results have some limitations as these estimates ignore a number of important variations and interactions among management factors as well as climatic and edaphic conditions. Still, our findings illustrate that it is possible to enhance rice productivity at reduced environmental costs through screening for low emission varieties and agronomic practices. Future innovations should ensure that rice farming progressively adapts to climate change, while continuing to reduce GHG emissions.
Export citation and abstract BibTeX RIS

Original content from this work may be used under the terms of the Creative Commons Attribution 3.0 licence. Any further distribution of this work must maintain attribution to the author(s) and the title of the work, journal citation and DOI.
1. Introduction
Rice is an important food crop and the rice demand is predicted to increase by 40% by 2040 to meet the need of the growing world's population (Seck et al 2012). Meanwhile, rice paddies are a major source of greenhouse gases (GHGs), accounting for about 48% of global cropland GHG emissions (Carlson et al 2017). More importantly, GHG-induced climatic changes may threaten long-term rice productivity and further exacerbate GHG emissions (Zhang et al 2011, Van Groenigen et al 2013). Thus, to facilitate climate-smart rice agriculture, there is a substantial need to explore innovative agronomic practices that can dually facilitate rice production and GHG mitigation.
China, a leading rice producer in the world, contributes about 28.1% to the global rice production (FAO Statistical Yearbook 2013). To promote sustainable rice production, an array of innovations in agronomic practices have been achieved in the last few decades. These innovations can be classified into: (1) the use of improved varieties that has tripled the yield per unit area since the 1960s, contributing to about 50% of the rice yield enhancement (Evenson and Gollin 2003), (2) non-flooded irrigation, e.g. alternate wetting-drying irrigation in major Chinese rice cropping areas that has consequently benefited grain filling and yield (Feng et al 2013), (3) chemical nitrogen (N) fertilizers or organic residues/manures that significantly increased plant N uptake and rice production from 1961 to 2010 (Ladha et al 2016), and (4) northward expansion of rice cropping over the last 50 years, with a 485% increase in single rice cropping systems in Northeast China but a 48% decline in double rice cropping systems in South China (Peng et al 2009). Together, implementation of these practices has increased rice yield in China from 2.7 t ha−1 in the 1960s to 6.3 t ha−1 in the 2000s (National Bureau of Statistics of China 1960–2019).
Simultaneously, genetic improvements of rice cultivars and changes in field management regimes may also have affected GHG emissions. For example, new rice varieties with higher allocation of photosynthates to seeds may reduce photosynthate allocation belowground to methanogens, and are thus conducive to CH4 mitigation (van der Gon 2000, Jiang et al 2013, 2017). Also, compared to fully flooded irrigation, alternate wetting-drying irrigation enhances soil aeration in rice paddies, reducing CH4 production, while promoting CH4 oxidation (Yan et al 2003, Wang et al 2012, Zhang et al 2014b). This can be particularly true in the early stage of rice plants in nursery (Liu et al 2012, Zhang et al 2014a). In addition, the decreasing rice area in South China also contributes to a decline in GHG emissions, as GHG emissions are usually higher in the warm South than in North China (Chen et al 2012, 2013).
Although changes in rice varieties and management practices may have significantly affected GHG emissions, their integrated impacts have not been quantitatively assessed. As similar practices have recently been adopted in other major rice-producing countries (Balasubramanian et al 2007, Mueller et al 2012), a comprehensive evaluation of the integrated impacts of China's agricultural changes on rice yields and GHG emissions may provide important references and/or guidance for developing management regimes (Zhang et al 2016) that promote both rice production and climate change mitigation. In particular, GHG emissions per unit yield (yield-scaled GHG emission) may provide a unique indicator to jointly evaluate productivity and environmental impacts (Linquist et al 2012, Pittelkow et al 2014, Ali et al 2015, Xu et al 2018).
In this study, we first conducted a meta-analysis to investigate the impacts of cropping system adjustments on GHG emissions. We then conducted two independent field experiments to examine the effects of changes in rice varieties and irrigation methods: (i) thirty dominant rice varieties between 1960s and 2000s were selected to determine the effects of the replacement of rice varieties on GHG emissions and rice yields, and (ii) impacts of different water management regimes on GHG emissions in rice seedling nurseries and post-transplanting period were quantified at three different locations that represent China's three rice cropping systems. We also conducted a survey to estimate the historical changes of these practices and further estimated both area- and yield-scaled GHG emissions between the 1960s and 2000s in China. Our objectives are to: (1) characterize the changing trends of rice variety evolution, irrigation and cropping system adjustments, (2) determine the magnitude of GHG emission changes associated with rice agronomic practices between the 1960s and 2000s, and (3) evaluate the integrated impacts of changes in rice varieties and agronomic practices in the 1960s and 2000s, and project GHG emissions from Chinese rice paddies in the next two decades.
2. Materials and methods
2.1. A survey of experts on changing trends of rice production in China from 1960 to 2009
A national survey of rice experts was conducted in 2011 to investigate the historical changes of cropping systems, varieties and water management practices in China's rice paddies from the 1960s to 2000s. We selected 19 major rice production provinces (figure S1 is available online at stacks.iop.org/ERL/14/114020/mmedia), which accounted for 98% of the total rice production in China. Then five counties were purposively drawn from each province based on the levels of rice production. The historical data in each county was collected through face-to-face interviews using a questionnaire (table S1) with local rice cultivation experts, who have worked in rice cultivation for at least 30 years and were at least 50 years old. Rice cropping systems were classified as annual single rice (SR) cropping system in the northern region, annual rice-upland (RU) crop rotation system in the central region, and annual double rice (DR) cropping system in the southern region in the questionnaire (table S1). Water management regimes were divided into two groups: continuous flooding and water-saving (WS) irrigation either in the rice nursery stage or in the post-transplanted stage. The experts were asked to estimate the percentage of total rice paddy area under each of these management practices in their county. In Total, we collected 95 valid questionnaires including 285 observations to investigate the historical changes for rice nursery, rice planting and irrigation methods. We estimated the coverage of different practices in China as the mean value of the expert investigation.
2.2. Meta-analysis: impacts of different cropping systems on GHG emissions
We extracted results for rice yields and CH4 and N2O emissions from Chinese rice fields, using databases of the Web of Science and the China National Knowledge Infrastructure (CNKI) for an exhaustive search of the journal articles published before May 2015. The search terms were 'rice yield' and 'greenhouse gas emission' or 'rice yield' and 'CH4' or 'rice yield' and 'N2O' for article topics. In total, the search results produced ~540 article hits. Finally, twenty-four papers (table S2) including 134 field measurements were selected according to the following criteria: (1) CH4 and N2O fluxes were measured for an entire season (included the period from transplanting to harvesting) from field conditions, using static chamber method; (2) only studies that determined both rice yields and CH4 and N2O emissions were included. In some cases, rice yield data were obtained from other publications (table S2). Also, we only selected the studies with cropping practices that had been widely used by local farmers, and the studies with rarer cropping practices, such as plastic mulches and slow-releasing urea, were excluded.
Rice cropping systems in China can be divided into three major groups (SR, RU and DR) as indicated in section 2.1 above (see also figure S1). Rice sown area of each system was extracted from National Bureau of Statistics of China (1960–2019). GHG (CH4 and N2O) emissions from entire growing season and rice yields of different systems were quantitatively assessed. The global warming potential (GWPs) of GHG emissions for double rice cropping season are the averages of the early- and late-rice cropping season. The mean GHG emissions for the three cropping systems were evaluated following the method used by Linquist et al (2012):


where M is the mean value of the area- or yield-scaled GWP of CH4 and N2O for each cropping system. Yk is the observed area- and yield-scaled GWP at the kth study site. Wk is the weight for the observation from the kth site, with higher weights assigned to the well replicated studies (Feng et al 2013). In equation (2), n is the number of replicates in the field experiment and f is the number of GHG measurements per month for the weight of GHG emissions, and t is the total number of observations from the kth site. We used the software Metawin 2.1 to generate the mean GHG emissions and 95% confidence intervals (CIs) using bootstrapping with 4999 iterations (Rosenberg et al 2000). The mean emissions of each cropping system were considered to be significantly different if their 95% CIs did not overlap.
2.3. Field experiment 1: variety impacts
In order to investigate the rice variety impacts on GHG emissions, we conducted a multi-site field experiment to compare GHG emissions using thirty major rice varieties (each with a total planting area of more than 1 000 000 ha). The experiments were carried out in 2011 at three locations, respectively, in three major Chinese rice cropping regions (figure S1), including (1) Shenyang, Liaoning Province with SR system, (2) Danyang, Jiangsu Province with RU system, and (3) Jinxian, Jiangxi province with DR system. Ten local major varieties, released in different eras between 1960s and 2000s, were selected for each location according to the results of expert survey and the statistical data of rice varieties in China (supplementary table S3; Zhang et al 2015). The experiment consisted of a complete randomized block design with three replicates at each site. The plot size for each treatment was 3 m × 4 m.
Rice seedlings (28 d after seed sowing in the nursery) were transplanted on 2 June, 30 June and 30 April in the SR, RU and DR cropping systems, respectively. Rice planting density, fertilization, and applications of insecticides and herbicides were implemented following the local management practices. Mid-season drainage that consisted of 7 d of drainage at 50 d after transplanting was applied for all the field plots (each at 3 m × 4 m).
Rice samples were collected at the maturing stage, and rice grains from an area of 1 m2 per plot were harvested. GHG emissions were monitored in each plot using a static closed chamber method as described by Zou et al (2005). Briefly, GHG fluxes were measured at 7 d intervals since 3 d after transplanting until maturity. Sampling for GHGs was done at 9:00–11:00 in the morning. During the gas sampling, a chamber (made of PVC; 50 × 50 × 50 cm: length × width × height) was placed on a fixed base that was installed before seedling transplanting. At 0, 5, 10 and 15 min after chamber enclosure, 50 ml gas samples were withdrawn with gas-tight syringes. The gas samples were brought back to the laboratory and CH4 and N2O concentrations were detected by a gas chromatograph (GC-7890A, Agilent, Santa Clara, CA, USA). Total GHG emissions during the rice growing season were calculated according to Zou et al (2005).
2.4. Field experiment 2: impacts of water management regimes on GHG emissions
Estimation of GHG emissions from rice paddies over the last few decades mainly focused on the post-transplanting period (from transplanting to harvesting), and often overlooked the rice nursery stage. Two rice nursery methods, including flooded nursery (FN) and alternate WS nursery (WS), were set up to investigate CH4 and N2O fluxes under major Chinese rice cropping systems (SR, RU, and DR). Briefly, the nursery experiments in each cropping system region were performed in an open field with a complete randomized block design and three replicates, with a plot area of 6 m2 (1.5 m × 4 m). Rice seeds of selected varieties in each system was sown on 21 April, 29 May, 24 March and 20 June in the SR, RU, and early and late double rice cropping systems, respectively. Organic residues were not incorporated into the soil, and other farming practices were all applied following the local management practices. The nurseries were kept under either flooded or WS conditions. For flooded nursery, soil was kept saturated with continuing flooding and maintaining 2–3 cm water depth above the soil surface throughout the whole nursery stage. For the WS nursery, the soil was only saturated before sowing, and then was kept at 70%–80% water holding capacity with periodically watering. After nursery stage, rice seedlings were transplanted to the field, using WS irrigation method. Over the entire nursery period (one month) and transplanting to harvesting period, gas sampling was taken every 3 or 4 d using a static closed chamber-GC method, respectively (Zhang et al 2014c). Total GHG emissions during the rice nursery stage and post-transplanting stage (see supplementary information) were calculated according to Zou et al (2005).
2.5. Evaluation on the changes in rice cropping systems, rice varieties, and irrigation regimes on GHG emissions from 1960 to 2009
Two scenarios ('no cropping practices innovated' and 'cropping practices innovated') were evaluated to assess the impact of cropping system adjustment, variety replacement, and water regime improvement on GHG emissions from rice field. The 'cropping practices innovated' scenario represents the actual improvements in cropping system, rice variety and water management from the 1960s to 2000s. The 'no cropping practices innovated' scenario is a hypothetical 'null' scenario used as a control to compare with the 'cropping practices innovated' scenario, whereby, we assume that there were no changes in the cropping system, rice variety and water regime from the 1960s to 2000s. The CH4 and N2O emission under these two scenarios were calculated as follow:

where TEt represents the total emission in the tth period (1960s, 1970s, 1980s, 1990s, 2000s). CPAAti represents the application area of the ith cropping practice (cropping system, variety, and irrigation regime) in the tth period, EIti is the CH4 and N2O emissions of the ith cropping practice in the tth period. The standard deviation of TEt was determined by the variance of the emission values over the ten years in the tth period.
When all the practices are integrated together, the integrated GHG emissions (ITEt) in the tth period was calculated as follows:


where EFt_c,v,w is the adjusted emission factor for different cropping practices in tth period (kg CO2-eq ha−1) , and A t_c,v,w is rice planting area for different cropping practices in the tth period. c, v, and w represent different cropping systems, varieties, and water managements, respectively. f and n represent emissions from post-transplanting field stage and nursery stage, respectively. EFt0 is the baseline emissions for continuously flooded fields. SFct, SFvt and SFwt are the scaling factors for cropping system, variety and water management in the tth period, respectively. The standard deviation of ITEt was determined by the variance of the emission value of ten years in the tth period.
We followed that common practice in GWP estimation, whereby CO2 is taken as the reference gas, and the radiative forcing potentials relative to CO2 are 25 used for CH4 and 298 used for N2O (based on a 100 year time horizon; IPCC 2007). Thus, GWPs of the combined CH4 and N2O emissions are expressed in CO2 equivalents (i.e. cumulative CH4 emission ×25 + cumulative N2O emission × 298; IPCC 2007). The area-scaled GWP is expressed as the overall GWP of CH4 and N2O emissions per unit rice area (ha), whereas the yield-scaled GWP represents the overall GWP per unit rice grain yield (Mg). In calculating GHG emissions, we only accounted for direct emissions during the entire growth period from the rice nursery stage to rice harvesting, and did not include indirect emissions (e.g. production of fertilizers and pesticides, production and operation of farm machines) (Zhang et al 2013, Xia et al 2016).
2.6. Emission scenarios for rice fields from the 2010s to 2030s in China
To integrate the historical mitigation potentials of agronomic practices described above and evaluate their potential impacts on GHG emissions from Chinese rice paddies in the coming decades, we performed a scenario analysis based on historical trends of rice agronomic practices and the increase in expected future rice productivity (table S4). Total GHG emissions will be affected by grain production and mitigation efficiency of rice variety, WS irrigation, and changes in cultivated area in each rice cropping region (S0–S4). In all scenarios, a 0.8% annual increase in rice yield was assigned to meet the need for the growing population in 2030s (Seck et al 2012). S0 is a conservative scenario with the assumption that 'no cropping practices innovated'. Scenario S1, S2 and S3 assume that only cropping system changes, only rice variety changes, and only irrigation regime changes were considered, respectively. Scenario S4 is an optimal scenario that incorporates all the improved practices. The annual change rates of these practices over 2010–2039 are estimated according to the impacts of historical changes of agronomic practices on CH4 and N2O emissions (summarized in table S4). Briefly, CH4 emissions were decreased by 0.2%, 0.5%, and 0.6% per year, for S1, S2, and S3 scenarios, respectively, while N2O emissions were increased by 1.5%, 1%, and 7.5% per year, for S1, S2, and S3 scenarios, respectively.
3. Results and discussion
3.1. Changes in rice cropping systems, dominant varieties, irrigation regimes, and yields in China from 1960 to 2009
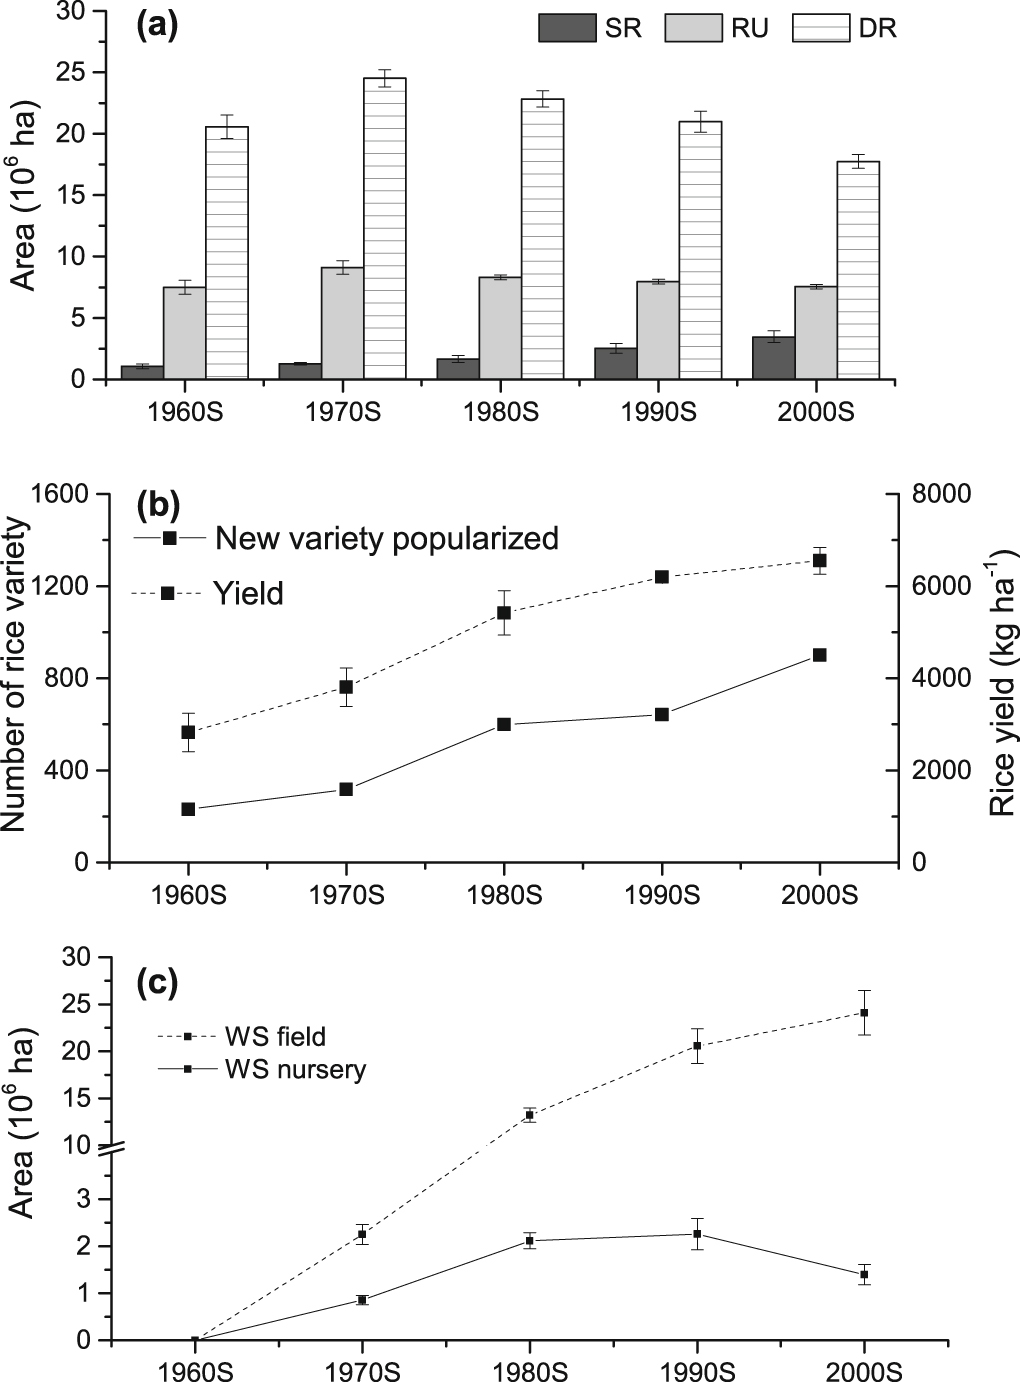
Over the last 50 years, Chinese rice cropping practices have changed substantially (figure 1). First, rice-planting areas in different cropping systems have been continuously changing, with a decreasing trend (by 13%) in the DR system and a significant increase (by 230%) in the SR system from the 1960s to 2000s (figure 1(a)). Second, increasing new varieties have been adopted and popularized during the whole period (Li 2007), with nearly the same increasing trend as the changes in rice yield (figure 1(b). Third, alternate water saving (WS) irrigation has gradually increased by 16.7% per decade in major rice cropping areas in the post-transplanting period (figure 1(c)). Based on the expert survey, we estimated that WS was applied in at least 83% of rice planting area (table S5). Meanwhile, rice nursery method has been changing from traditional flooded nursery to alternate water saving nursery (table S5). The application of WS technology has increased in recent years primarily because it has obvious tillering and growth superiority and the potential to increase rice yields (Zhang et al 2014c). One more innovation is the planting method. Traditional manual transplanting has been replaced by mechanical transplanting and dry direct-seeding (table S5) because of the shortage of rural labor. Particularly, mechanical rice planting can significantly decrease rice production cost and nursery area, which has great potential to decrease GHG emissions from the nursery stage (Zhang et al 2014c).

Figure 1. Changing agronomic practices for rice production between the 1960s and 2000s in China. (a), areas under the annually single rice cropping (SR), annually rice-upland rotation cropping (RU) and annually double rice cropping system (DR). (b), number of rice varieties that was over 6667 ha, and average rice yield per ha between the 1960s and 2000s. (c), the estimated coverage of water saving (WS) irrigation during the rice nursery stage and post-transplanting period of rice field. The data are presented as 10 year running means for the period from 1960 through 2009, and error bars indicate standard deviation.
Download figure:
Standard image High-resolution image3.2. Impacts of different cropping systems on CH4 and N2O emissions
The GWP of GHG emissions from rice fields in China varied significantly among different cropping systems (table 1, figure 2). Results from the meta-analysis showed that CH4 emissions from DR cropping systems were nearly 3 times and 33% higher than that from SR and RU systems, respectively, while N2O emissions were similar among these systems (table 1). Both the area- and yield-scaled GWP of these systems showed the same trend: single rice cropping system < rice-upland crop rotation system < double rice cropping system. Differences in CH4 emissions mainly contributed to the significant differences in the area- and yield-scaled GWP among the cropping systems. Also, a large gradient change of soil temperature among these cropping systems may have caused higher GHG emissions in DR than the other cropping systems. It has been well documented that temperature increase can significantly stimulate CH4 emissions from rice paddies (Parashar et al 1993).
Table 1. The effects of different agronomic practices on CH4 and N2O emissions and their global warming potentials (GWP) determined by meta-analysis and multi-site field experiments. Cropping system incudes single rice (SR), rice-upland (RU), and double rice (DR) cropping systems. Water regimes includes continuous flooding (CF) and water-saving irrigation (WS). For cropping system, data shown are mean value of the area- or yield-scaled GWP of CH4 and N2O for each (SR, RU and DR) cropping system, and the standard deviation (SD) shown here are 95% confidence intervals from the meta-analysis. For rice variety and water regime, data shown are mean value of the results measured at three field experiment sites, and SD is obtained from three replicates (n = 3).
| CH4 (kg CO2-eq ha−1) | N2O (kg CO2-eq ha−1) | Area-scaled GWP (kg CO2-eq ha−1) | Yield-scaled GWP (kg CO2 eq Mg−1) | ||||||
|---|---|---|---|---|---|---|---|---|---|
| Practice | Mean | SD | Mean | SD | Mean | SD | Mean | SD | |
| Cropping system | SR | 1621 | 1279 | 473 | 267 | 2094 | 1307 | 347 | 169 |
| RU | 5374 | 1450 | 626 | 171 | 6000 | 1460 | 780 | 157 | |
| DR | 7166 | 1962 | 379 | 139 | 7545 | 1967 | 1189 | 300 | |
| Rice varietiesa | 1960S | 8082 | 544 | 146 | 41 | 8227 | 514 | 1253 | 79 |
| 1970S | 7810 | 448 | 147 | 25 | 7957 | 462 | 1137 | 85 | |
| 1980S | 7454 | 535 | 176 | 31 | 7630 | 532 | 806 | 71 | |
| 1990S | 6858 | 381 | 186 | 31 | 7043 | 393 | 755 | 70 | |
| 2000S | 5671 | 325 | 199 | 35 | 5870 | 340 | 628 | 47 | |
| Water regimea | CF | 12801 | 677 | 122 | 6 | 12923 | 710 | 2188 | 263 |
| WS | 5794 | 325 | 333 | 23 | 6126 | 341 | 937 | 126 | |
aThe data of rice variety and water regime were the mean value of the results measured at three field experiment sites. The detailed results of each site were listed in tables S6 and S7.
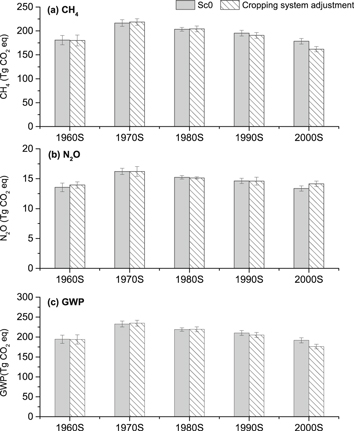
Figure 2. Effect of changes in the cropping system on the CH4 emissions (a), N2O emissions (b), and their global warming potential (GWP, c) from 1960s to 2000s at national scale. Sc0, no cropping system adjustment; Sc, scenario with changes in cropping system. The data are presented as 10 year running means for the period from 1960 through 2009, and error bars indicate standard deviation.
Download figure:
Standard image High-resolution imageOver the past few decades, the planting area of SR system in northern China has increased by 230%, while that of DR system has declined by 13% (figure 1(a)). Although the shifts in these cropping systems are driven mainly by the demand for labor saving or high comparative profits for rice production (Feng et al 2013), the planting area changes have simultaneously mitigated GHG emissions from rice paddies since the 1960s. Consequently, the area adjustments in rice cropping systems reduced total GWP of GHG emissions by 7% from 1960s to 2000s (figure 2(c)).
3.3. Impacts of rice variety replacement on CH4 and N2O emissions
New variety application was a major factor influencing rice yield per unit area, accounting for almost 50% of yield growth for all developing countries (Evenson and Gollin 2003). Since the 1960s, 1387, 2017, and 4591 varieties were certified in SR, RU, and DR systems, respectively, of which nearly 700 are widely planted among these years (figure 1(b); Tang et al 2012). There were large variations in the estimation of the rice variety effects on GHG emissions, though the application of high-yielding rice varieties was a major strategy for enhancing rice yields (Huang et al 1997, Wang et al 1997, Das and Baruah 2007). For example, van der Gon (2000) assessed the impact of changes in rice cultivation on methane emissions from rice paddies since the 1960s for four countries (Indonesia, Philippines, Thailand, and Nepal), indicating that the introduction of modern rice varieties can be regarded as a GHG mitigation strategy. However, most of the previous studies overlooked the effects of rice varieties when estimating the regional or national GHG emissions (Huang et al 1998, Cai et al 2003, Yan et al 2003). In the present study, we found that the replacement of rice varieties in China over the past 50 years has significantly increased rice yield with a declining trend in both area- and yield-scaled GHG emissions (table 1). The results showed that varietal replacement has gradually reduced the area-scaled GWP by 2.0%, 6.4%, and 4.4% per decade in SR, RU, and DR systems, respectively (table 1). Also, although new varieties (those released in recent two decades) increased N2O emissions (figure 3(b)), they reduced CH4 emissions at a higher magnitude (figure 3(a)), leading to a net reduction in GWP (figure 3(c)). Together, as compared to the 1960s, variety replacement reduced total GWP by 31% from China's rice paddies in the 2000s (figure 3(c)). Jiang et al (2018) found that the potential of CH4 mitigation from rice paddies through increasing the harvest index was small, but increased root porosity and grain yield of new varieties can reduce CH4 emissions by promoting O2 transport to soils (Jiang et al 2016, 2017). Therefore, selecting and breeding high-yielding rice varieties, e.g. super rice, are proposed as a desirable approach to reduce GHG emissions (Yagi et al 1997, Jiang et al 2013, 2017) and overcome the yield ceiling under future climatic conditions. Recently, Su et al (2015) reported for the first time a high-starch low-methane-emission rice that was generated via transcription factor technology, suggesting that genetic improvements through modern rice breeding strategies have great potential to contribute more to sustainable rice production in future.
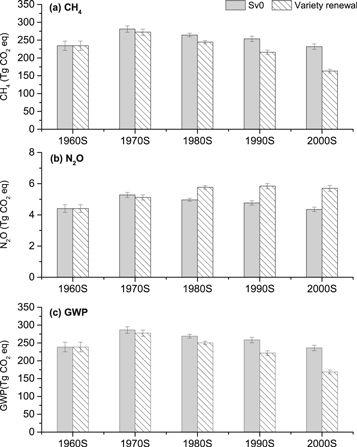
Figure 3. Effect of changes in rice varieties on the CH4 emissions (a), N2O emissions (b), and their global warming potential (GWP, c) from 1960s to 2000s at national scale. Sv0, no varieties changed; Sv, scenario with variety replacement. The data are presented as 10 year running means for the period from 1960 through 2009, and error bars indicate standard deviation.
Download figure:
Standard image High-resolution image3.4. Impacts of different irrigation regimes on CH4 and N2O emissions
WS irrigation (i.e. non-flooded irrigation, such as mid-season drainage and alternate wetting-drying) has been gradually accepted by farmers, because it can inhibit ineffective tillers, remove toxic substances, improve root activities, and benefit rice yields (Ramasamy et al 1997). According to the data from our expert survey, WS irrigation only accounted for 6% of irrigation methods in the 1970s, but has increased to 83% of rice paddies in the 2000s (table S5). WS irrigation can reduce CH4 emission by inhibiting the activity of methanogenic archaea (Ma and Lu 2011), but may facilitate N2O emission by increasing the nitrate available for denitrifiers (Zou et al 2005). Our results (figures 4(a) and (b)) and previous meta-analysis showed that WS irrigation reduces CH4 emissions by 62% and increases N2O emissions by 278%, compared to continuous flooding (Feng et al 2013). More recently, Kritee et al (2018) reported extremely high N2O fluxes from intermittently flooded rice paddies, though CH4 emissions were mitigated. These results indicate that a strong trade-off between CH4 and N2O emissions under different water management regimes. Thus, net climate impacts of water management on CH4 and N2O should be assessed, primarily through the calculation of GWP that quantifies the integrated radiative forcing of equal-mass pulses of emissions of each GHG versus CO2 over a 100 year time horizon (IPCC 2007).
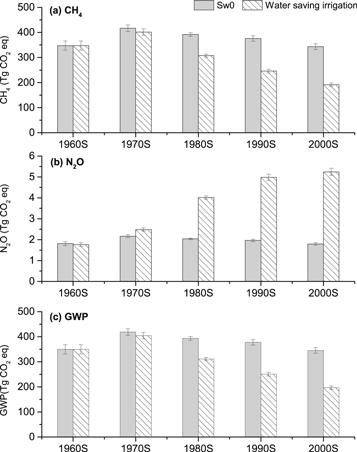
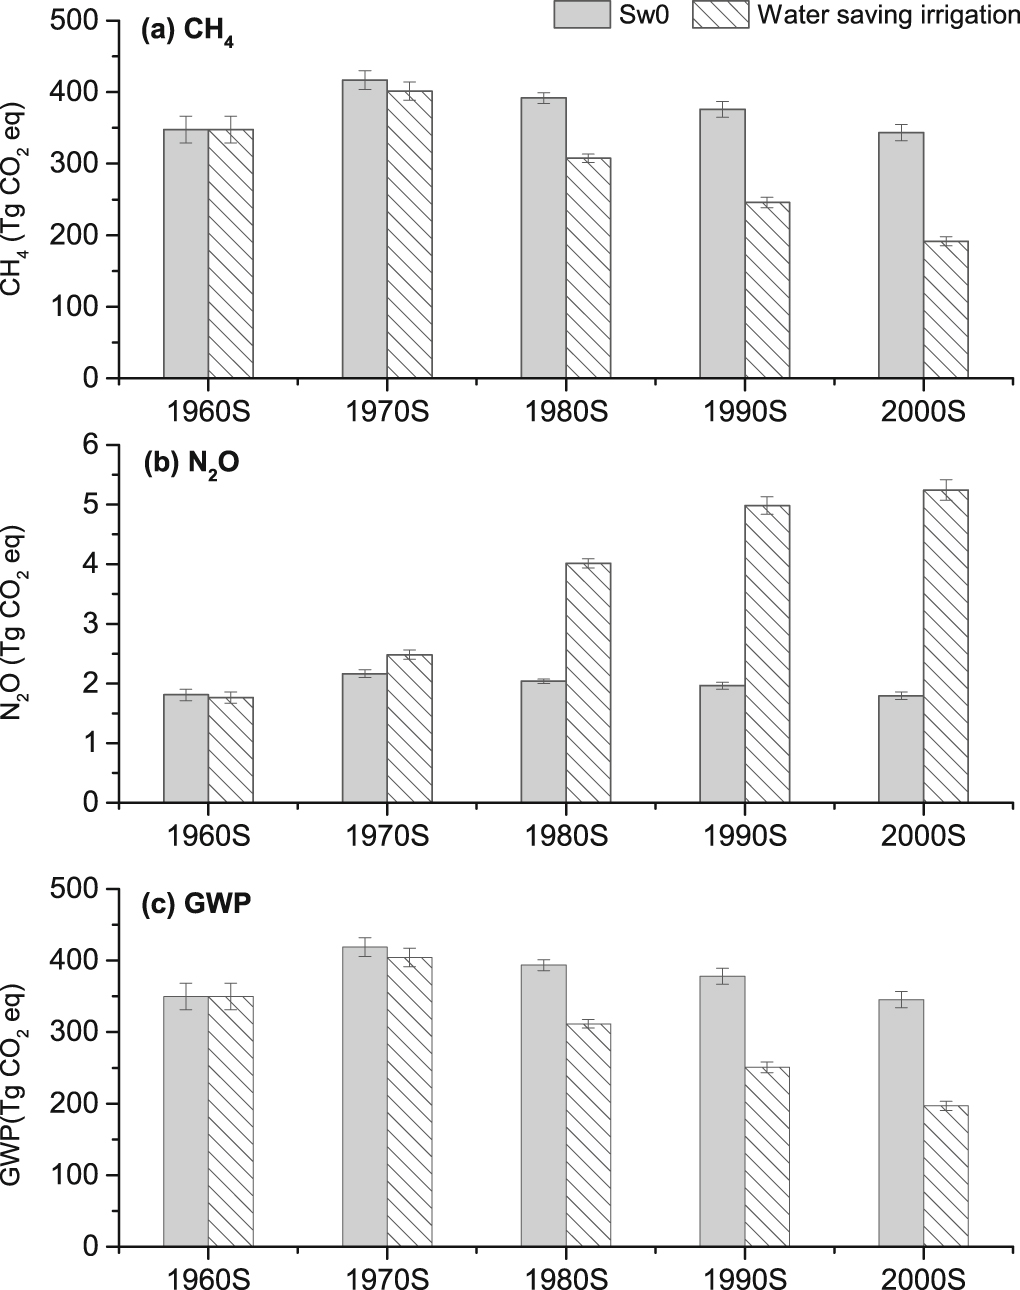
Figure 4. Effect of water saving (WS) irrigation in the field (a) and nursery (b) stages on the CH4 emissions (a), N2O emissions (b), and their global warming potential (GWP, c) from 1960s to 2000s at national scale. Sw0, no water management practices innovated; Sw, scenario with improved irrigation regime. The data are presented as 10 year running means for the period from 1960 through 2009, and error bars indicate standard deviation.
Download figure:
Standard image High-resolution imageSimilarly, WS irrigation has also been gradually accepted in rice nurseries (Zhang et al 2014c). Rice plants generally grow in seedling nursery for 30–40 d during which the GHG emissions may account for nearly two-thirds of the area-based total emissions across the whole growing season (Liu et al 2012, Feng et al 2013). WS technology was introduced much earlier in SR than in RU and DR systems (figure S2(A)). The relatively quick switch from flooded nursery to water saving nursery could significantly decrease GHG emissions in SR systems (Zhang et al 2014a, 2014b, 2014c). Also, GHG emissions are usually higher in the warm South than in cold North China (Chen et al 2012, 2013). The lower temperature in SR than other systems, together with lower rice nursery area because of increasing mechanized transplanting (table S5; Zhang et al 2014a, 2014b, 2014c) led to low GHG emissions in the rice nurseries of SR system (figure S2(B)). Together, it is estimated that WS irrigation reduced total GHG emissions of rice paddies by 41% from 1960s to 2000s (figure 4(c)).
WS irrigation covers a range of irrigation methods. The soil moisture conditions including the duration of the flooded period also differ significantly. This makes CH4 emission highly variable among different WS irrigation methods (Zhang et al 2014c, Jiang et al 2019). This is a source of large uncertainty, and future studies should aim to identify irrigation regimes that minimize the GHG emissions while optimizing rice production.
3.5. Integrated impacts on GHG emissions and future mitigation potential
Over the past 50 years, the improvements in these agronomic practices have reduced total GWP by 70% (figure 5). The results are similar to the reduction trends across the globe over this period (Tubiello et al 2014), providing important references for other developing countries. However, recent results from a model estimating showed that CH4 emission has gradually increased by 65.8% from the early 1970s to 2009 (Zhang et al 2011). This might be partially because CH4MOD model estimated paddy CH4 emission solely based on the assumption that CH4 emission positively correlates with rice biomass production (Zhang et al 2011). Indeed, varieties with high biomass may reduce CH4 emissions by releasing more O2 into soils for CH4 oxidation (Khalil et al 1998, Ma et al 2010), and the impact of variations in variety choice and management practices, including fertilization and irrigation, were typically not taken into account but needs to be considered in the future (Alexander et al 2018).
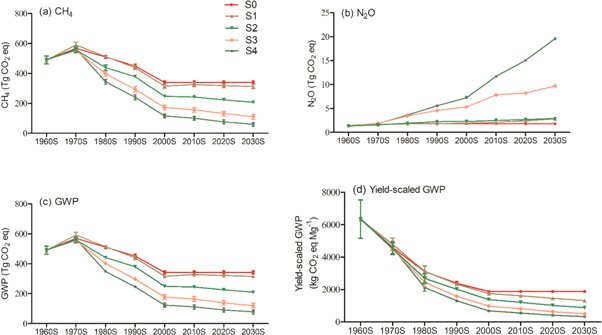
Figure 5. Integrated effect of changes in rice variety and agronomic practices on the CH4 emissions (a), N2O emissions (b), the global warming potential (GWP, c), and yield-scaled GWP (d) from the 1960s to 2000s, and the projected emissions under different emission scenarios from the 2010s to 2030s. S0, no cropping practices innovated; S1, only cropping system changes; S2, only variety changes; S3, only water regime changes; S4, integrated effect of all the practices. The data are presented as 10 year running means for the period from 1960 through 2039, and error bars indicate standard deviation.
Download figure:
Standard image High-resolution image
To estimate how much GHG mitigation potentials of these practices may materialize in the coming decades, several emission scenario analyses were performed. First, emission scenario analyses based on historical trends of rice agronomic practices were conducted. The potential mitigation rate of cropping system adjustments only (S1), rice variety changes only (S2), and irrigation regimes changes only (S3) is 0.1%, 5%, and 10% per decade, respectively, for area-scaled GHG emissions in the 2030s, compared to the 2000s (figure 5(c)). Meanwhile, yield-scaled GHG emissions will be reduced by 8.4%, 10.6%, and 11.9% per decade, respectively, in these three emission scenarios (figure 5(d)). Although the mitigation rate slowed down since the 2000s, the integrated practices (S4) would reduce the total and yield-scaled GWP by 12% and 17% per decade in the 2030s, respectively, compared to the 2000s (figures 5(c) and (d)). Moreover, WS irrigation will likely remain highly popular during the 2020s-2030s, and the mitigation potential could continue to increase when this practice is incorporated into other management approaches (Khalil et al 2008, Janz et al 2019). Together, these results highlight the need for a comprehensive understanding of future management practices on GHG emissions.
Recently, rice agriculture has progressively extended to other countries, such as those in Africa (Balasubramanian et al 2007, Foley et al 2011, Mueller et al 2012). China's rice farming innovations of variety breeding and agronomic improvements are also increasingly practiced in other developing countries. The successful synergy in grain yield increase and GHG mitigation of rice production in China will thus provide potential guidance to develop management regimes in other developing countries. Furthermore, continuous development and adoption of new agricultural practices, particularly the low-emission rice varieties (Su et al 2015), may further suppress GHG emissions from rice paddies in the future.
3.6. Limitations in our estimation
Our study attempted to present a comprehensive examination of effects of the historical changes in several improved agronomic practices on GHG emissions from rice fields in China. We approached our goal through field experiments, meta-analysis and projections from previous information in literature. Yet, several inevitable limitations should be noted. First, our assessments were based on the limited field and literature data, and limited measurements of rice varieties that were assumed to represent the 10 year averages of the varietal improvement impacts. Also, it is unclear whether improved varieties may interact with other improved agronomic practices (e.g. irrigation and fertilizer management) to influence GHG emissions. These interactions represent a knowledge gap that needs to be addressed to determine the mitigation efficiency of the integrated effects of these practices (Khalil et al 2008, Wassmann et al 2019). Second, while our study spanned a variety of rice agronomic practices, the data source did not include nitrogen (N) inputs, which can critically affect rice productivity and GHG emissions (Zou et al 2009, Zhang et al 2011). Although the application of N fertilizers plays a key role in enhancing rice productivity, decades of excessive N fertilization has contributed to large direct GHG emissions from rice paddies mainly in the form of N2O and also caused high indirect carbon emissions in fertilizer production (Zou et al 2009, Zhang et al 2013) that were not considered in our study. However, N fertilization likely raises rice yields more than the GWP of GHG, resulting in a large reduction in yield-scaled GWP (Feng et al 2013), although its impact on direct GHG emissions is less consistent (Zou et al 2005, Cai et al 2007, Linquist et al 2012). In particular, the greatest reduction in yield-scaled GHG emissions likely occurs at a fertilization level of 150–200 kg N ha−1 (Ju et al 2004), which may also facilitate soil C sequestration (Zhao et al 2018). Finally, this study does not consider the possibly significant interactions between GHG emissions and climatic factors such as general warming, elevated CO2 concentration, and precipitation changes. This simplification inevitably brings in some uncertainties to our estimates and future research should integrate the impacts of various interactions through modeling.
4. Conclusions
By integrating multi-site field measurements and meta-analysis, we found that increases in rice yield was concurrent with decreases in total GHG emissions from the 1960s to 2000s, as a result of the historical changes in Chinese rice varieties and agronomic practices. Replacement of rice varieties over the past few decades showed a declining trend in GHG emissions at both area- and yield-scale, and alternative rice breeding strategies and variety selection for high grain yields could further reduce GHG emissions from rice agriculture in the next few decades. Shifts in rice production areas northwards and reduction in double-rice cropping systems have significantly contributed to the mitigation of area-scaled GWP from the 1960s to 2000s, but the mitigation potential appears to be limited in future. Also, WS irrigation have reduced the GHG emissions from rice paddies over the past decades, but further field observations of GHG emissions and rice production among different irrigation methods should be conducted to reduce the uncertainty in our estimates. Together, the improvements in agronomic practices have substantially reduced area- and yield-scaled GHG emissions over the past 50 years, but alternative managements and new varieties are needed for higher yields with lower emissions in the future. The impacts of rice technology innovation was not uniform across China, but are highly dependent on local conditions. To understand how GHG mitigation should evolve over time, it is essential to investigate the interactions among management factors as well as with concurrent climatic and edaphic conditions at the appropriate scale.
Acknowledgments
This work was supported by the National Key Research and Development Program China (2016YFD0300903, 2016YFD0300501, and 2017YFD0300104), Natural Science Foundation of China (NSFC) (31600383), Special Fund for Agro-scientific Research in the Public Interest (201503122), the China Agriculture Research System—Green Manure (CARS-22-G-16), Central Public-interest Scientific Institution Basal Research Fund of Institute of Crop Science, the Innovation Program of CAAS (Y2016PT12, Y2016XT01), the GEF Project of Climate Smart Staple Crop Production in China (P144531), the China Scholarship Council, and the Vice-Chancellor Discretionary Fund (Project ID: 4930744) from The Chinese University of Hong Kong (CUHK) given to the Institute of Environment, Energy and Sustainability.
Data availability statement
Any data that support the findings of this study are included within the article.