

Abstract
Changes in the hydrological cycle are among the aspects of climate change most relevant for human systems and ecosystems. Besides trends in overall wetting or drying, changes in temporal characteristics of wetting and drying are of crucial importance in determining the climate hazard posed by such changes. This is particularly the case for tropical regions, where most precipitation occurs during the rainy season and changes in rainy season onset and length have substantial consequences. Here we present projections for changes in tropical rainy season lengths for mean temperature increase of 1.5 °C and 2 °C above pre-industrial levels. Based on multi-ensemble quasi-stationary simulations at these warming levels, our analysis indicates robust changes in rainy season characteristics in large parts of the tropics despite substantial natural variability. Specifically, we report a robust shortening of the rainy season for all of tropical Africa as well as north-east Brazil. About 27% of West Africa is projected to experience robust changes in the rainy season length with a mean shortening of about 7 days under 1.5 °C. We find that changes in the temporal characteristics are largely unrelated to changes in overall precipitation, highlighting the importance of investigating both separately.
Export citation and abstract BibTeX RIS
Introduction
Anthropogenic climate change is altering the global hydrological cycle. As regional changes in precipitation patterns are strongly dependent on dynamical changes in the climate system, changes in future precipitation are still subject to considerable uncertainty (Collins et al 2013). Climatological analysis of changes in regional precipitation has reported changes on annual or seasonal means or extreme weather events (IPCC 2014). For regions with sharp seasonality such as the tropics, changes in the temporal characteristics of the dry and rainy season may at least be of equal relevance. Even seemingly small changes in temporal characteristics may result in substantial impacts on systems e.g. related to multi-cropping agricultural practices (Naylor et al 2007). Analysis of changes in future monsoon systems is hampered by uncertainty related to model skill, resolution or confounding anthropogenic factors such as aerosol emissions. For example, global monsoon area as well as intensity are in general consistently projected to increase (Christensen et al 2013), however some studies using high resolution climate modeling have suggested otherwise (Ashfaq et al 2009), especially when it comes to regional sectors (Rajendran and Kitoh 2008, Rajendran et al 2012). Changes in temporal characteristics of monsoon systems vary widely between models as a result of competing drivers and complex interactions between them (Dong et al 2016, Almazroui et al 2017). Given these challenges, most analysis has focused on very high emission scenarios in order to identify attributable changes against a background of strong natural variability (Pascale et al 2016, Pohl et al 2017).
Following the adoption of the Paris Agreement in 2015, however, there has been a growing interest for quantifying impacts at discrete levels of global mean temperature (GMT) increase such as 1.5 °C and 2.0 °C above pre-industrial levels (Schleussner et al 2016). Until now, there has been a dearth of research to address this issue because available experiments in the CMIP (Couple Model Inter-comparison Project) and other national and international climate modelling efforts are not specifically designed for informing this report. This HAPPI (Half a degree Additional warming, Projection, Prognosis and Impacts) experiment is an international effort to fill this gap, specifically designed to provide a framework for the generation of climate data describing how the climate, in particular extreme weather, might differ from the present day worlds that are 1.5° and 2.0 °C warmer than pre-industrial conditions (Mitchell et al 2017). The quasi-stationary multi-ensemble design also allows for assessments of climate change signals against a highly variable background. Here, the HAPPI dataset has been utilized for assessing characteristics of the rainy season under anthropogenic climate change.
Changes in the rainy season characteristics (e.g. onset, cessation and length) over the tropical regions have for most parts been focused on the national to regional scale (Liebmann and Marengo 2001), (Iladis and Arvalho 1972), (Marteau et al 2009), (Giraldo Osorio and García Galiano 2012). Different definitions have been used to define the characteristics of the rainy season over different regions depending on the nature of the study (Sivakumar 1988), (Sabeerali and Ajayamohan 2018), (Allen et al 2014), (Diaconescu et al 2015), (Saeed et al 2012). However, in order to assess whether the rainy season is indeed undergoing changes in the whole of tropical region, a generally applicable method of identifying the onset, cessation and length of the rainy season (LORS) is required. Here we adopt a precipitation based approach introduced by (Liebmann and Marengo 2001) and (Liebmann et al 2008) that is applicable over the whole tropics despite different dynamical characteristics of the regional rainy seasons.
In the present study, this method has been applied on the HAPPI dataset to study the changes between the current decade and decades 1.5° and 2.0 °C warmer than pre-industrial levels. After validation of the approach against observations, we assess projected changes in key rainy season characteristics for the tropics on the regional level. The robustness of our projections across the model ensemble is also assessed. The implications of our findings are then discussed with respect to regional vulnerabilities.
Data and methods
Under HAPPI protocols, three time periods (historical, +1.5 °C and +2.0 °C) are considered, each spanning 10 years (Mitchell et al 2017). All the runs are executed under prescribed sea-surface temperatures and sea-ice forcing conditions. For each of the three periods considered, multi-ensemble realizations are provided by the contributing general circulation models (GCMs). The 'historical period' taken through 2006–2015 for HAPPI, is forced by observations that include increasing CO2 concentration (381 ppm to 403 ppm) over this decade and observed values of other anthropogenic and natural drivers. The future scenarios span a hypothetical 2106–2115. The +1.5 °C experiment uses constant radiative forcing, based on RCP2.6, for greenhouse gases, aerosols and ozone. Sea surface temperatures are the same as in the historical experiment but warmed by an appropriate amount and pattern estimated from the multimodel mean of the CMIP5 archive of climate model simulations following the RCP2.6 concentration scenario. CO2 concentration is taken to be constant (at 423.4 ppm) over this decade. For the +2.0 °C experiment, sea-surface temperatures and CO2 are adjusted instead using a linear combination of the CMIP5 RCP2.6 and RCP4.5 simulations, with the CO2 concentration constant at 486.6 ppm; non-CO2 greenhouse gases, aerosol, and ozone forcing in the +2.0 °C experiment is identical to the +1.5 °C experiment.
Here we use a set of four HAPPI GCMs (ECHAM6, MIROC5, CAM4-2degree and NorESM1) that have been bias corrected to improve the representation of regional features using ISI-MIP2b bias correction methodology (Lange 2017). This method corrects the monthly mean of the model data against the reference data, followed by correction of the daily variability about the monthly mean (Hempel et al 2013). Following the modelling protocol of the Intersectoral Impact Model Intercomparison Project (Frieler et al 2017), the resultant projections are re-gridded to a 0.5° × 0.5° regular grid and then bias corrected using the EWEMBI (EartH2Observe, WFDEI and ERA-Interim data Merged and Bias -corrected for ISIMIP) dataset (Lange 2017). In total 20 ensemble members per GCM have been bias corrected.
To determine the onset and cessation at each grid point with an annual regime, the method followed is as in Liebmann et al (2008) (Lieb_meth from here onwards). First of all, the climatological water season must be determined. This is represented by the period of the year when the wet season occurs, and account for those seasons that span calendar years. The climatological mean precipitation for each day of the calendar year, Pi (i: 1 January–31 December), and the climatological daily mean precipitation,  , are computed. Then, the climatological aggregate daily rainfall anomaly on any day d, A(d), is determined as:

where i ranges from 1 January to the (d)-day for which the variable calculation applies. The day of the minimum and maximum in 'A' marks the beginning and end of the climatological water season respectively.
The Lieb_meth is not suitable for Arid areas which are characterized by small amount of annual precipitation (Liebmann et al 2008), therefore arid areas have been masked out from our analysis defined by an annual threshold of 250 mm (Leonhart 2005). Moreover, the robustness of the change in signal is defined as an agreement of at least 66% of the ensemble members on the sign of change. Different methods to find the robustness of climate change signal can be found in the published literature (Jayasankar et al 2015). The definition of robustness used in the present study is adopted from Solomon et al (2007), and this definition was employed in various other studies afterwards (Haensler et al 2013, Pfeifer et al 2015, Almazroui et al 2016).
Results
Figure 1 shows the application of Lieb_meth used for the calculation of onset and cessation using the EWEMBI dataset, as well as the ability of GCMs in capturing these characteristics. The seasonality of tropical climate, characterized by the latitudinal march of the Intertropical Convergence Zone (ITCZ), has been captured by the algorithm in the EWEMBI dataset. The results of GCMs closely follow EWEMBI, both in capturing onset/cessation as well the amount of precipitation during the rainy season. GCMs have also produced rainy season days similar to EWEMBI (figure 1).

Figure 1. Monthly rainy season onset and cessation as well as total annual rainfall (mm) for EWEMBI and four GCMs. The data of each GCM has been plotted after taking the ensemble mean of 20 members. Regions having less than 250 mm climatological rainfall have been masked grey.
Download figure:
Standard image High-resolution imageThe differences in 1.5 °C and 2.0 °C worlds against the historical period as well as between themselves in simulating onset (cessation) are shown in figure 2 (figure S2) where robust changes for each GCM ensemble are indicated by stippling. Changes in the total LORS are presented in figure 3. Not all tropical areas experience robust change at 1.5 °C, but sub-Saharan Africa, in particular West Africa, and parts of Northeast Brazil show a robust delay in the onset and shortening of the rainy season with all the GCMs agreeing on the sign of change (compare figures 2 and 3). Model disagreement over South Asia is apparent with MIROC5 showing a robust advanced onset as well as reduction in LORS, whereas ECHAM6 and NorESM1 show a robust delay in the onset over the same region. Similar agreements and disagreements can also be seen from the cessation plots shown in figure S2.

Figure 2. Median difference (days) in onset results for different GCMs between '1.5 and historical', '2.0 and historical' as well as '2.0 and 1.5' for 20 ensemble members. Stippling represents robust model agreement, which is defined as 66% of all ensemble members (20 for each GCM) agreeing on the sign of change. Positive values indicate a delayed onset.
Download figure:
Standard image High-resolution image
Figure 3. Same as figure 2, but for LORS.
Download figure:
Standard image High-resolution imageProjected changes across the ensemble show a strong model dependency in many regions. ECHAM6 is showing a delayed onset over southern Africa for 1.5 °C, getting further delayed in 2.0 °C (figure 2, top panel). However, for certain other regions this trend is opposite. Over South Asia, ECHAM6 for example has shown a delayed onset for 1.5 °C, but a trend reversal between 1.5 °C and 2.0 °C. Similar behavior can be seen for the rest of the models indicating the increase in temperature may influence the regional climate in a complex manner.
Across the model ensemble, changes in onset, cessation and LORS differ on a regional level (compare figure 4). Earlier onset is limited to some parts of the Western Amazon and Central America under 1.5 °C and 2.0 °C worlds, whereas the rest of the regions generally experience a delay in the onset with north-east Brazil, central Africa, south and south-east Asia showing grids with robust delay (figure 4, top panels). Similarly, apart from Southeast Asia, all the other regions show an earlier cessation of the rainy season with most of the regions of Africa and South America showing a robust signal (figure 4, middle panels). The resulting changes in LORS are depicted in figure 4, lower panel. A tendency towards a shorter rainy season is observed over most of the tropics with certain regions of Africa and north-eastern Brazil exhibiting robust signals. This information is further elaborated in table 1 showing values of LORS over different SREX regions (Seneviratne et al 2012). A higher percentage of robust area is falling under each of the above mentioned African and north-eastern Brazil regions. For the whole tropics, approximately 9% to 11% of the area shows robust signal projecting a decrease in rainy season of about 6 to 7 days for 1.5 °C and 2.0 °C worlds. The results for the onset also represent similar behavior (table S1).

Figure 4. Median differences (in days) of all four GCMs for onset, cessation and LORS. Stippling represents areas having robust values, which is defined as 66% of all ensemble members (80 for four GCMs) agreeing on the sign of change.
Download figure:
Standard image High-resolution imageTable 1. Changes in the LORS in days for different SREX regions as well as whole tropic (between 30°S/°N). Changes are given in days. Robust areas are constituted of grid cells for which more than 66% of all model ensemble members agree on the sign of change.
| 1.5 °C | 2.0 °C | |||||
|---|---|---|---|---|---|---|
| Total land | Robust | %Robust area | Total land | Robust | %Robust area | |
| Tropics | −1.84 | −6.5 | 8.42 | −1.96 | −7.0 | 10.8 |
| Central America | −0.42 | −3.34 | 0.6 | −0.22 | −1.4 | 1.52 |
| Amazon | −1.73 | −8.76 | 7.85 | −2.16 | −9.28 | 12.1 |
| Northeast Brazil | −2.44 | −10.37 | 7.14 | −4.57 | −9.0 | 24 |
| Southeastern S.A. | −0.95 | 2.49 | 1.07 | −1.64 | −10.0 | 0.26 |
| West Africa | −3.38 | −7.21 | 26.6 | −3.80 | −8.24 | 29 |
| East Africa | −1.78 | −6.83 | 12.3 | −1.52 | −5 | 8.12 |
| Southern Africa | −2.35 | −6.29 | 7.09 | −3.26 | −6.94 | 13.6 |
| South Asia | −1.23 | −3.32 | 2.6 | −0.48 | −1.63 | 1.98 |
| East Asia | −0.52 | −8.23 | 0.88 | −0.85 | 3.58 | 3.69 |
| Southeast Asia | −0.72 | 3.0 | 6.74 | 0.03 | 5.18 | 6.7 |
| North Australia | −2.61 | −9.97 | 3.43 | −1.41 | −7.0 | 1.0 |
Spatially averaged over SREX regions (Seneviratne et al 2012), there is a general behavior of delay and shortening of onset and LORS respectively (figure 5). For onset, the onset regions of central America, Amazon and Southeast Asia exhibit a larger area showing robust, but small changes (see table S1). On the other hand, robust signals for eastern Asia, northern Australia and south-eastern South America are limited to a very small land area. African SREX regions as well as north-eastern Brazil are prominent in showing a higher percentage of robustness as well as a higher magnitude of reduction in LORS in 1.5 °C and 2.0 °C world (see together with table 1). It is interesting to note that except for a few (East Asia, Southeast Asia and Central America), all the other SREX regions have shown reduction in LORS both for robust as well as total area for future worlds. Moreover, a delayed onset is observed in robust values of East Africa and South Asia for both 1.5 °C and 2.0 °C world against the historical period. However, a signal of no-change is observed between 1.5 °C and 2.0 °C representing a non-linearity in the change signal.

Figure 5. LORS (top panel) and onset (lower panel) results averaged over different SREX regions over land representing '1.5 and historical', '2.0 and historical' as well as '2.0 and 1.5' worlds over different SREX regions. Violin plots are showing the spatially aggregated probability distributions of median change over the respective land area for all grid cells (blue) or grid cells showing robust change only (yellow, compare table 1). The inner bars denote the interquartile range. The plot at the bottom left of both the panels is for West African SREX region used for the explanation of the rest of the plots.
Download figure:
Standard image High-resolution imageFigure 5 also contains information about the probability distribution functions (pdfs) for each SREX region as well as different warming levels. For the above mentioned SREX regions (African and Northeast Brazil), the shape of the pdf represents less spatial variability in the signal for LORS (figure 5, right panel), whereas for eastern and south east Asian regions a bimodal pdf indicates both robust LORS reduction and robust increase over this region.
Finally, the total precipitation is plotted for SREX regions, separately for each of the four GCMs (figure 6). It is pertinent to mention here that in addition to the changes in LORS, the changes in precipitation are also attributed to dynamical and thermodynamical changes in the overall pattern of precipitation in the warming worlds. The Asian SREX regions, which come under the influence of monsoon circulation, have shown an increase in precipitation in the warming world for all the four GCMs. West and East African regions also show a similar pattern as Asian regions except for ECHAM5, which shows a decrease in precipitation for these regions. With varying magnitudes, the northern Australia and southern African regions show a decrease in precipitation for all the four GCMs for 1.5 °C warmer world, which changes sign for 2.0 °C warming world for northern Australia for most of the models. Other regions show mixed behavior of the mean precipitation signal among the four GCMs with the magnitude of the change remaining less that 5% for most of the models. It is also important to note that at most instances, 2.0 °C warmer world shows an increase in precipitation signal as compared to 1.5 °C world.
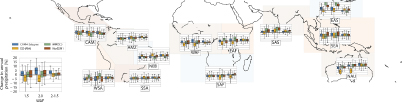
Figure 6. Percentage difference of total rainy season precipitation between '1.5 and historical', '2.0 and historical' as well as '2.0 and 1.5' worlds over different SREX regions for the four GCMs. Boxplots give the interquartile range while the whiskers indicate the full width of the distribution. The plot at the bottom left of this figure is for West African SREX region used for the explanation of the rest of the plots.
Download figure:
Standard image High-resolution image
Figure 7. TAG index for 1.5 °C (left) and 2 °C (right) world, defined as the difference between northern (5°N–25°N) and southern (5°S–25°S) Atlantic equatorial zones. Median values based on 20 Ensemble for each GCM are presented.
Download figure:
Standard image High-resolution image
Discussion
In the present study, a unique dataset targeted at identification of climate changes for worlds that are 1.5 °C and 2 °C degree warmer than pre-industrial world has been analyzed. A robust definition of onset and cessation has been uniformly applied over the whole tropics to assess the changes in the characteristics of rainy season in these warmer worlds in relation to current conditions. All four GCMs used in the analysis ably captured the seasonality associated with onset, cessation and LORS. Over all, the tropics show a decrease in LORS in the warmer worlds, with approximately 10% of the region showing a reduction in LORS of about 6 to 7 days. Our findings are in line with other recent studies based on the CMIP5 model ensemble projecting a delay in the onset and a reduction of rainy season over different tropical regions (Pascale et al 2016, Pohl et al 2017, Sabeerali and Ajayamohan 2018).
At the regional scale, evidence of a delay in the onset as well a reduction of LORS over various tropical regions have been found in the warmer worlds. Although there are differences in the signal among the four GCMs for different SREX regions, the most pronounced signals are found for the African and Northeast Brazil SREX regions. These regions not only show a higher percentage of areas having robust results, but also a higher magnitude of reduction in LORS and delay in the onset of rainy season for both 1.5 °C and 2.0 °C world.
In order to identify the physical mechanism behind these robust changes in African and Northeast Brazil SREX regions, we analyzed surface thermal gradients that are determining factor in the position of ITCZ, in 1.5 °C and 2.0 °C world. Links between Atlantic ITCZ convection and rainfall over Northeast Brazil and African regions are well established (Chiang et al 2002). Here we used a predefined tropical Atlantic gradient (TAG) index, described as the difference between the north tropical SST anomaly averaged over the northern Atlantic region from 5°N–25°N and the southern Atlantic region from 5°S–25°S, and subtracting the later from the former (Chiang et al 2002). This SST pattern is also considered as a dominant pattern of tropical Atlantic SST variability which varies as interannual to decadal and longer time scale. When the TAG index is positive (negative) the TAG points from south (north) to north (south) across the equator, and hence the associated winds. Therefore, the anomalous warm north/cool south SST gradient shifts the meridional location of ITCZ convection towards the north Atlantic region (Mehta 2017). Figure 7 show the annual cycle of TAG index for each model's skin temperature using non-bias corrected data. The result indicate an intensification of warm north/cool south cross Atlantic equatorial gradient, implying an anomalous shift of ITCZ towards the northern equatorial Atlantic region, hence negatively impacting the rainfall in equatorial and southern equatorial land regions of Africa and South America.
Besides the mechanism described above, the changes in seasonality of tropical or monsoonal precipitation have been explained through various processes which include spring inhibition of convective activity due to increased convective stability in the warming world (Seth et al 2011); high-latitude SST phase delay owing to sea ice reduction impacting the tropics (Biasutti and Sobel 2009); change in the annual cycle of SSTs (Dwyer et al 2012); poleward shift of midlatitude storm tracks (Pascale et al 2016); and the effect of other pollutants in the atmosphere, e.g. black carbon aerosols (Meehl et al 2008).
Although robust changes have been identified between warming worlds and the historical period (1.5 °C and 2 °C above pre-industrial corresponds to about 0.7 °C and 1.2 °C above the historical period), changes between 1.5 °C and 2.0 °C are diverging considerably across the model ensemble. Changes in modelled rainy season characteristics, are also influenced by forcings other than CO2, in particular other greenhouse gases, aerosols, ozone concentration as well as land use and land cover; these other forcings are identical for the 1.5 °C and 2.0 °C experiments (Mitchell et al 2017). Thereby, we cannot rule out that a substantial share of the projected changes between the historical period and 1.5 °C and 2.0 °C is also influenced by changes in non-GHG factors (Wang et al 2017, Samset et al 2018). Furthermore, both HAPPI experiments are forced by an end-of-century ocean that may also lead to a northward shift of the ITCZ as the result of northern high latitude warming in a climate with an Atlantic meridional overturning circulation showing signs of recovery (Schleussner et al 2014).
In fact, considering that the degree of warming between the historical and 1.5 °C worlds (0.7 °C) and the 1.5 °C and 2.0 °C worlds (0.5 °C) is comparable, it might be unexpected that the changes in rainy season characteristics between the 1.5 °C and 2.0 °C worlds seen in figures 2–5 are generally smaller than the changes between the historical and 1.5 °C worlds if the rainy season changes were responding only to CO2 or sea surface temperature changes. However, if time-lagged ocean dynamics, aerosols or land use change can strongly influence the rainy season (Christensen et al 2013), (Abiodun et al 2013) then we might expect a stronger historical to 1.5 °C change (with its substantial change in aerosol forcing) than 1.5 °C–2.0 °C change (with no change in aerosol forcing).
Our analysis further indicates that changes in rainy season length, over most of the regions, are independent of changes in overall precipitation. In some regions, like West Africa, a shortening of the rainy season is accompanied by an increased overall precipitation indicating a shift towards fewer rainy days and more extreme rainfall (Pohl et al 2017). Other regions, like South Africa, are projected to see a robust decrease in precipitation and intensifying drought risk under 1.5 °C and 2.0 °C (Lehner et al 2017).
Our results emphasize that robust changes, also to dynamical features of the climate system such as temporal characteristics of the tropical rainy season can be identified between around half-a-degree warming increments. Changes in rainy season characteristics, and thereby seasonal water deficits, can have far reaching consequences for vulnerable ecosystems such as the African tropical rainforest (Hirota et al 2011). A robust delay in rainy season onset together with a shortening of the overall rainy season length will have substantial implications for agricultural practices in affected regions such as West and South Africa.
Conclusion
We have found that parts of the tropics, in particular sub-Saharan Africa and Northeast Brazil, may experience robust delays in onset and shortening of rainy seasons under 1.5 °C and 2.0 °C warming. The difference between 1.5 °C and 2.0 °C is less clear for most of the regions. We have found that changes in the temporal characteristics of the rainy season are largely independent from total precipitation, which is of high relevance for agriculture as well as ecosystem impacts.
Acknowledgments
The authors would like to thank the HAPPI initiative and all participating modelling groups that have provided data. This research used science gateway resources of the National Energy Research Scientific Computing Center, a DOE Office of Science User Facility supported by the Office of Science of the U.S. Department of Energy under Contract No. DE-AC02-05CH11231. CFS and FS acknowledge support by the German Federal Ministry of Education and Research (01LS1613A) and by the German Federal Ministry for the Environment, Nature Conservation and Nuclear Safety (16_II_148_Global_A_IMPACT). NorESM contributions have received support from the Research Council of Norway (261821) and UNINETT Sigma2 (ns9082k). DS was supported by the U.S. Department of Energy, Office of Science, Office of Biological and Environmental Research, under contract number DE-AC2–5CH11231. MIROC5 contributions have been supported by the TOUGOU project of MEXT, Japan and by the Environment Research and Technology Development Fund (2–1702) of the Environmental Restoration and Conservation Agency, Japan.