
Abstract
Wildfires are a natural and important element in the functioning of boreal forests. However, in some years, fires with extreme spread and severity occur. Such severe fires can degrade the forest, affect human values, emit huge amounts of carbon and aerosols and alter the land surface albedo. Usually, wind, slope and dry air conditions have been recognized as factors determining fire spread. Here we identify surface moisture as an additional important driving factor for the evolution of extreme fire events in the Baikal region. An area of 127 000 km2 burned in this region in 2003, a large part of it in regions underlain by permafrost. Analyses of satellite data for 2002–2009 indicate that previous-summer surface moisture is a better predictor for burned area than precipitation anomalies or fire weather indices for larch forests with continuous permafrost. Our analysis advances the understanding of complex interactions between the atmosphere, vegetation and soil, and how coupled mechanisms can lead to extreme events. These findings emphasize the importance of a mechanistic coupling of soil thermodynamics, hydrology, vegetation functioning, and fire activity in Earth system models for projecting climate change impacts over the next century.
Export citation and abstract BibTeX RIS

Content from this work may be used under the terms of the Creative Commons Attribution-NonCommercial-ShareAlike 3.0 licence. Any further distribution of this work must maintain attribution to the author(s) and the title of the work, journal citation and DOI.
1. Introduction
Boreal forests regularly experience wildfires (Stocks et al 2003, Kharuk et al 2008) as a natural element in this ecosystem (Valendik 1996). However, fires with extreme spread and severity can change forests (Kasischke et al 2010), affecting human values, emitting huge amounts of carbon and altering the physical properties of the land surface (McGuire et al 2006). When passing a threshold in frequency or spread, fires could contribute to a dieback of boreal forests as a tipping element in the climate system (Lenton et al 2008). Increasing fire activity has been observed in Canada and Alaska for the period 1959–1999 (Kasischke and Turetsky 2006), likely caused by increasing temperatures (Gillett et al 2004). In light of a projected warming by 2–5 °C in the boreal zone until 2100 (ACIA 2005), a further increase in boreal fire activity is expected (Stocks et al 1998, Tchebakova et al 2009).
Fire activity in Siberian larch forests is characterized by occasional large fire events (individual fires with >200 ha area, Valendik 1996), which typically burn the understory vegetation, while fire-adapted trees, such as Larix sibirica (Ledeb.) survive the fire (Valendik 1996, Korovin 1996, Soja et al 2007). Fire activity is related to large-scale atmospheric circulation patterns (Skinner et al 1999, 2002) which affect regional temperature, precipitation, air humidity and wind conditions. For example, the inter-annual variation in burned area in central Siberia in the period 1992–2003 was explained by the Arctic oscillation index and summer temperatures (Balzter et al 2005), or early summer rainfall anomalies (Jupp et al 2006). However, the occurrence of the most extreme fires in central and southern Siberia in 2003 (Goldammer et al 2005) could not be explained by such relations to atmospheric properties alone (Jupp et al 2006). Beside these fire weather conditions, the spread of wildfires is additionally influenced by land cover type, availability and moisture of fuel, stand structure and topography (Parisien et al 2010).
Permafrost and the associated upper active layer of the soil, which thaws during summer and refreezes during winter, is an important supply for soil moisture in boreal ecosystems (Sugimoto et al 2002). Especially in years with summer drought, larch forests use melting water from the active layer which can store the autumn precipitation during freezing and releases this water in the next spring and summer (Ohta et al 2008). In summer, upper surface moisture is reduced by evaporation and water uptake from the greening vegetation while subsoil water supply is inhibited by the still frozen state of the ground. Thus, the highest number of fires occurs in southern Siberian regions at the beginning of the vegetation period (Korovin 1996). It was shown that surface moisture anomalies differ by permafrost extent and are related to the occurrence of fires (Bartsch et al 2009). Large permafrost regions in eastern Siberia are dominated by deciduous needle-leaf forests (Larix). These trees with their shallow root system in the upper organic and active layer are adapted to permafrost soils. Because of the annual litter fall and low decomposition rates, these forests provide thick organic layers and thus high fuel levels. A process-based ecosystem model (Beer et al 2007) also suggested a combined effect of both soil thermal dynamics and vegetation activity on surface moisture in spring and subsequent increasing fire probability in permafrost-underlain boreal forests.
The objective of this study is to investigate the importance of surface moisture conditions as a potential additional driving factor for extreme fire events in permafrost-underlain larch forests in the Siberian Baikal region based on several large-scale datasets. The Baikal region is defined as the Irkutsk and Chita Oblasts and the Republic of Buryatia (figure 1) and was affected by an extreme fire event in spring 2003.
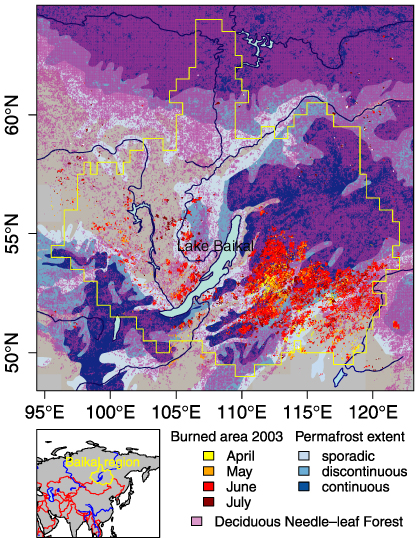
Figure 1. Permafrost extent, deciduous needle-leaf forests and burned areas of the year 2003 in the Baikal region.
Download figure:
Standard image2. Data and methods
To evaluate drivers for the temporal dynamic and spatial variability of burned area in 2002–2009 in the Baikal region, we were using environmental variables from different climate and satellite datasets. Using maximum and minimum temperature and precipitation data, we calculated the Nesterov index (Nesterov 1949) as indicator for fire weather conditions. Further we used satellite observations of burned area (Bartalev et al 2007) and surface moisture (Njoku et al 2003), a digital elevation model, a land cover map (Bartalev et al 2003), and a permafrost map (Brown et al 1998). On the basis of time series decomposition, we separated the effect of drivers for fire activity on different time scales. We next computed cross-correlations to identify potential time lags between weather conditions, surface moisture and fire activity. Finally, we assessed the predictive capability of different combinations of driving variables for burned area using multivariate spatial–temporal regression models.
2.1. Datasets
2.1.1. Surface moisture.
Surface moisture was derived from AMSR-E (advanced microwave scanning radiometer) passive microwave observations and provided by the National Snow and Ice Data Center (NSIDC, http://nsidc.org/data/amsre/), which is a daily, quality filtered, estimate of surface soil moisture (AMSR-E/Aqua L2B surface moisture). The X-band (10.7 GHz) observations of microwaves emitted by the Earth surface are used to retrieve surface moisture by the inversion of a soil–vegetation–atmosphere radiative transfer model (Njoku et al 2003). The retrieval algorithm separates between surface moisture and vegetation water content by a parameter which is derived from the passive microwave observations (Njoku and Chan 2006). Grid cells with surface water bodies, dense vegetation, snow and ice were excluded from the surface moisture retrieval. The AMSR-E surface moisture product (∼ upper 1 cm of soil profile) is mainly sensitive to litter moisture and comprises daily values from an ascending and descending satellite orbit.
We averaged the daily data from June 2002 to December 2009 from both orbits to monthly 0.5° gridded time series. To exclude partially frozen pixels we changed all surface moisture values between November and March to 0, indicating zero surface moisture. Values from April were not changed because the majority of grid cell in the study region show in this month already daily air temperatures above 0 °C. It was shown that rather the anomalies than the absolute values from this dataset are reliable (Rüdiger et al 2009). Therefore we centered each time series to its mean and analyzed only the temporal dynamics of these time series.
2.1.2. Burned area.
Burned area data were taken from the Russian Academy of Sciences Space Research Institute (IKI) product (Bartalev et al 2007), which is based on SPOT (Satellite pour l'Observation de la Terre) and MODIS (moderate resolution imaging spectrometer) satellite data. The original product is based on 10-day SPOT reflectance data and daily MODIS active fire counts. This product was validated against burned area polygons derived from Landsat images and has a high overall agreement (R2 = 0.94, Bartalev et al 2007). An improved product based on the same method uses daily MODIS reflectance instead of SPOT data to derive daily burned area time series. For this analysis the original SPOT-based product was used for the period from 2000 to 2002, while for 2003–2009, the daily MODIS-based product was applied. Both datasets were aggregated to monthly burned area totals and to 0.5° spatial resolution.
2.1.3. Climate data and Nesterov index.
Precipitation, daily maximum and minimum temperatures and wind speed are from the ECMWF ERA-Interim reanalysis product (Dee et al 2011). From this dataset, we calculated the daily Nesterov index NI(d) (Nesterov 1949) which is summed for all days with ≤3 mm precipitation and calculated from daily maximum and minimum temperatures Tmax(d) and Tmin(d) as in Venevsky et al (2002):

We aggregated the daily Nesterov index to monthly values by choosing the quantile 0.9 of the daily values in a month, indicating values of extreme fire danger.
2.1.4. Permafrost, land cover and topography.
The permafrost extent is from the circum-arctic map of permafrost and ground-ice conditions (Brown et al 1998) and was provided by NSIDC (http://nsidc.org/data/ggd318.html). It comprises the continuous permafrost zone (>90% permafrost cover), the discontinuous zone (50–90% permafrost) and the sporadic zone (10–50% permafrost cover). Land cover is based on the GLC2000 land cover map for Northern Eurasia (Bartalev et al 2003). The slope was calculated from the shuttle radar topography mission (SRTM) hole-filled digital elevation model as provided by the Consortium for Spatial Information (http://srtm.csi.cgiar.org/). All datasets were aggregated to 0.5° resolution to ensure the comparability of the different spatial datasets and to match the resolution of the climate data.
2.2. Data analysis
2.2.1. Time series analysis.
We calculated burned area totals and mean annual burned areas stratified by permafrost zones based on the original resolution of the burned area dataset. For precipitation and surface moisture time series we calculated monthly anomalies as the difference of the actual month to the mean monthly value with a baseline 2000–2009 for precipitation and 2002–2009 for surface moisture. To evaluate the temporal dynamics of effects between response variables (log-transformed burned area) and driver variables (precipitation, Nesterov index, surface moisture) on different time scales, the time series of each 0.5° pixel were decomposed in the trend, seasonal and remainder component using the STL algorithm (seasonal time series decomposition by Loess, Cleveland et al 1990). Since not all time series show a monotone trend, the trend component represents the inter-annual variability. The seasonal component represents the monthly dynamic, whereas the remainder component describes the short-term variations (extreme events) from the long-term trend and seasonal dynamic.
Cross-correlation functions were calculated between the burned area time series components and the respective components of the precipitation, Nesterov index and surface moisture time series to identify time lags between driver and response variables. The maximum absolute value of a cross-correlation function indicates the time lag between burned area time series components and the precipitation, Nesterov index and surface moisture components. We used these time lags to calculate lagged versions of these time series components.
2.2.2. Explanatory model for burned area.
To identify the explanatory variables with a relationship to burned area in permafrost-dominated larch forests we calculated multiple linear regressions of burned area against all explanatory variables. We selected only 0.5° grid cells which are located in deciduous needle-leaf forests and in the continuous permafrost zone. For these grid cells we selected the time steps from all time series which have a burned area >10 km2. This dataset contains the log-transformed burned area as the response variable and different explanatory variables (elevation, slope and the time steps from the temperature, wind, precipitation, Nesterov index and surface moisture time series with the respective anomalies, inter-annual variability, seasonal and remainder components and lagged version of these time series components). This remaining dataset represents time steps from June 2002 to July 2009 for 183 grid cells of 0.5° and has 455 records (spatial–temporal sampling points) with 29 explanatory variables. Based on the large burned area in 2003, most of these records (170) are from this year. 101 records are from 2008 and the remaining records (184) originate from the other years.
Based on this dataset we calculated multivariate linear regression models for the response variable log-transformed burned area. The aim was to identify these explanatory variables which can significantly explain the spatial–temporal variability of the burned area. The selection of explanatory variables was performed as following: (1) All 29 explanatory variables were fitted based on linear least squares regression against the log-transformed burned area. (2) In a step-wise selection we excluded single variables from this regression model and calculated Akaike's Information Criterion (AIC). The best explanatory model minimizes the AIC. We selected the model from which no variables can be removed anymore in order not to increase the AIC. (3) From this fitted model all explanatory variables which are not significant (t-test, p ≤ 0.05) were removed and the model was fitted again. Steps 2 and 3 were repeated 4 times until only significant explanatory variables remain in the explanatory model. All spatial and statistical analyses were performed by using the R software (R Development Core Team 2010).
3. Results
3.1. Burned area in relation to precipitation, surface moisture and permafrost in the extreme year 2003
Figure 1 shows the Baikal region with permafrost extent and the burned areas of the year 2003. While the annual average burned area in the Baikal region is approx. 10 000 km2,127 000 km2 burned in 2003 (table 1). During this year, the largest fires occurred in June (approx. 80 000 km2), a month in which only 2500 km2 are burning on average during 2000–2009. A large fraction of these burned areas coincide with the existence of permanently frozen grounds. On average, 19% of the burned area in the Baikal region occurred in the continuous permafrost zone, 18% in the discontinuous, 22% in the sporadic permafrost zone and 41% occurred in regions without permafrost. However, the largest fraction of burned area (33%) occurred in the continuous permafrost zone in the extreme fire year 2003. In the second largest fire year 2008, approx. 30 000 km2 burned.
Table 1. Total burned area in the Baikal region and percentage distribution of the burned area by permafrost extent. The mean is without the extreme year 2003.
| Year | Total burned area (km2) | Continuous permafrost (%) | Discontinuous permafrost (%) | Sporadic permafrost (%) | No permafrost (%) |
|---|---|---|---|---|---|
| 2000 | 17 080 | 39.7 | 23.0 | 15.2 | 22.2 |
| 2001 | 2 077 | 13.6 | 11.1 | 17.3 | 58.0 |
| 2002 | 3 400 | 37.2 | 33.2 | 6.7 | 22.9 |
| 2003 | 127 016 | 32.9 | 19.9 | 26.6 | 20.6 |
| 2004 | 4 834 | 14.2 | 11.2 | 19.5 | 55.1 |
| 2005 | 3 739 | 12.0 | 16.0 | 27.0 | 44.9 |
| 2006 | 15 744 | 14.4 | 12.1 | 37.6 | 35.9 |
| 2007 | 9 018 | 4.4 | 21.5 | 37.8 | 36.3 |
| 2008 | 30 413 | 15.4 | 25.9 | 22.4 | 36.3 |
| 2009 | 7 163 | 17.4 | 9.0 | 17.5 | 56.1 |
| Mean | 10 385 | 19 | 18 | 22 | 41 |
In regions with a maximum burned area in spring (i.e. April–June) 2003, precipitation in these months was approximately 18 mm below the average value in the period 2000–2009 (figure 2(B)). Thus, most fires occurred under below-average precipitation conditions. The average precipitation anomaly in the continuous permafrost zone (−17 mm) is similar to the one in non-permafrost regions (−19 mm). There is no significant difference between the distribution of precipitation anomalies in different permafrost zones and the permafrost-free region. However, there is no relation of the precipitation anomaly to the surface moisture anomaly (figure 2(A)). Especially the continuous permafrost soils showed more highly negative surface moisture anomalies than expected from the precipitation anomaly. The distribution of surface moisture anomalies in the continuous permafrost differs significantly from the permafrost-free region (Kolmogorov–Smirnov test, p = 3E − 06).
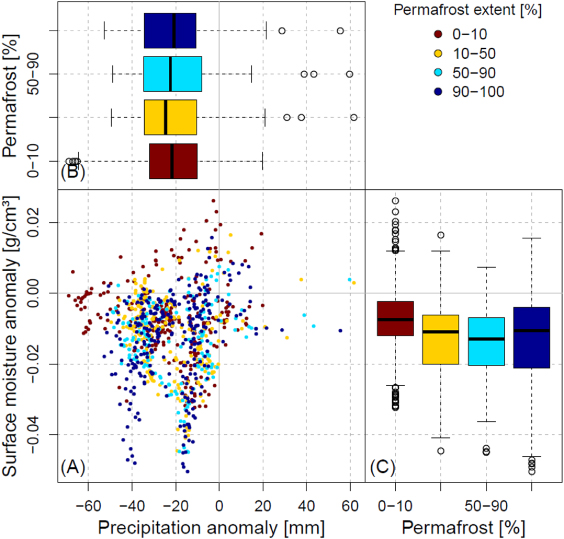
Figure 2. Distribution of spring 2003 (April–June) precipitation and surface moisture anomalies for 0.5° grid cells with a maximal burned area during April–June 2003 grouped by permafrost extent. (A) Scatter plot of surface moisture anomalies versus precipitation anomalies (anomalies as differences to the mean seasonal cycle), (B) boxplot of precipitation anomalies and (C) boxplot of surface moisture anomalies grouped by permafrost extent.
Download figure:
Standard image3.2. Temporal scales and time lags in fire surface moisture relations
To evaluate the temporal dynamics of weather conditions, surface moisture and fire activity, we decomposed the respective time series for each pixel into an inter-annual, a seasonal, and a remainder time series component. Figure 3 shows these time series components for burned area and surface moisture as well as anomalies of Nesterov index and precipitation averaged for grid cells with continuous permafrost, larch forests and a maximum burned area in June 2003. The burned area time series has only a minor seasonality (figure 3(D)) but a remarkable inter-annual variability and strong extreme events (figures 3(C) and (E)). The Nesterov index shows a positive anomaly in June 2003 (figure 3(A)) indicating high fire danger. Precipitation has a negative anomaly in April and May 2003 (figure 3(F)). Surface moisture shows a peak in May under normal conditions (figure 3(I)) but a strong negative value in the remainder component in spring 2003 (figure 3(J)), indicating that this spring moisture peak is missing in 2003. Surface moisture is lower than in other years in late summer 2002 (figure 3(H)).
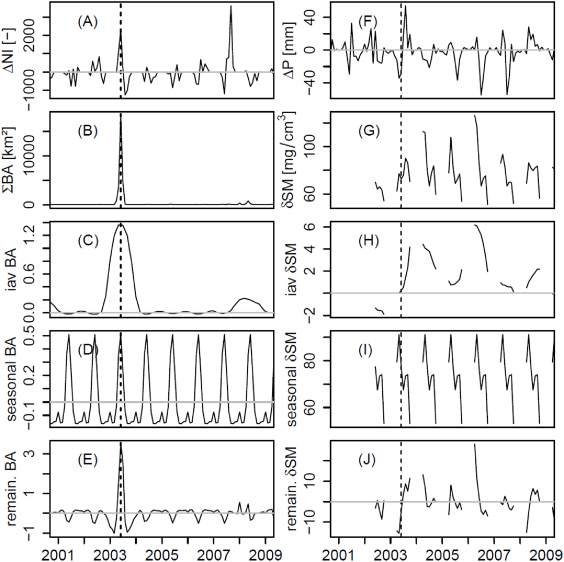
Figure 3. Monthly Nesterov index, burned area, precipitation and surface moisture time series averaged for regions with continuous permafrost and larch forests and for grid cells with a maximum burned area in spring 2003 in the Baikal region. (A) Anomaly of the Nesterov index (anomaly from the mean seasonal cycle). (B) Total burned area. (C) Inter-annual variability and (D) seasonal and (E) remainder component of the logarithmic burned area. (F) Precipitation anomaly from the mean seasonal cycle. (G) Surface moisture deviation as difference to the time series mean. (H) Inter-annual variability and (I) seasonality and (J) remainder component of the surface moisture. The vertical dashed line indicates the date of the extreme fire event in June 2003.
Download figure:
Standard imageInterestingly, the extreme fire event in June 2003 did not temporally coincide with an extreme surface moisture deficit. While the burned area peaked in June 2003, the inter-annual variability time series component of the surface moisture had its minimum already in the late summer 2002, indicating a time lag of approx. 10 months (figure 3(H)). Also, extreme negative surface moisture remainder component conditions occurred already in April and May 2003 while the burned area remainder component peaked 1–2 months later in June 2003 (figures 3(E) and (J)). Based on this observation we were calculating time lags from cross-correlations between burned area time series components and the corresponding time series components of precipitation, Nesterov index and remotely-sensed surface moisture. We found a stronger correlation between the inter-annual variability time series component of surface moisture and burned area at time lags of approx. 10 months in continuous permafrost than in permafrost-free regions (supplementary material 3 available at stacks.iop.org/ERL/7/044021/mmedia). These cross-correlations were used in the next step to account for time lags between explanatory variables and fire activity in spatial–temporal regression models.
3.3. Spatial–temporal explanatory model for burned area
Table 2 shows the slopes, standard errors and test statistics for the best explanatory model for log-transformed burned area which contains only significant variables. This model explains 47% of the spatial–temporal variability of burned area between 2002 and 2009 in the continuous permafrost with larch forests in the Baikal region. The residuals of this regression model (figure 4(A)) are normal distributed (no significant difference to normal distribution found based on Shapiro–Wilk test, p = 0.19) with a median of −0.03. The overall performance of this model is good, even if spatial–temporal points with large burned areas are slightly under-estimated (figure 4(B)). The regionally total burned area time series is well reproduced by this regression model (R2 = 0.984, figure 4(C)).
Table 2. Coefficients, standard errors and test statistics for the best explanatory model of log-transformed burned area based on spatial–temporal multiple linear regression on all grid cells with continuous permafrost, larch forest and for burned areas larger than 10 km2 for the period 2002–2009. Wind is the wind speed, P precipitation, NI Nesterov index, SM surface moisture. 'seas', 'iav' and 'rem' denote the seasonal, inter-annual variability and remainder time series components, respectively. Δ denotes the anomaly as the difference to the mean seasonal cycle, 'lag' indicates a lagged version of the time series. (Note: residual standard error: 0.8087 on 444 degrees of freedom. Multiple R-squared: 0.4697. F-statistic: 39.33 on 10 and 444 DF, p-value: <2.2E − 16.)
| Coefficients | Estimate | Std. error | tvalue | Pvalue (>|t|) |
|---|---|---|---|---|
| (Intercept) | 1.80×100 | 3.35×10⁻¹ | 5.389 | 1.16 × 10⁻⁷ |
| Wind | 2.38×10⁻¹ | 5.39×10⁻² | 4.424 | 1.22 × 10⁻⁵ |
| seas P | 8.66×10⁻³ | 2.28×10⁻³ | 3.797 | 0.000 167 |
| iav P | −1.15×10⁻² | 4.15×10⁻³ | −2.778 | 0.005 698 |
| lag rem P | −4.13×10⁻³ | 1.49×10⁻³ | −2.781 | 0.005 652 |
| seas NI | 3.21×10⁻⁴ | 5.31×10⁻⁵ | 6.040 | 3.27 × 10⁻⁹ |
| lag rem NI | 1.01×10⁻⁴ | 2.50×10⁻⁵ | 4.052 | 5.99 × 10⁻⁵ |
| iav SM | 1.16 × 10² | 1.38 × 101 | 8.418 | 5.33 ×10⁻¹⁶ |
| lag iav SM | −1.30 × 10² | 1.28 × 101 | −10.185 | <2.00 × 10⁻¹⁶ |
| lag rem SM | −1.50×101 | 2.42×100 | −6.184 | 1.42 × 10⁻⁹ |
| Δ SM | −1.70×101 | 4.33×100 | −3.912 | 0.000 106 |
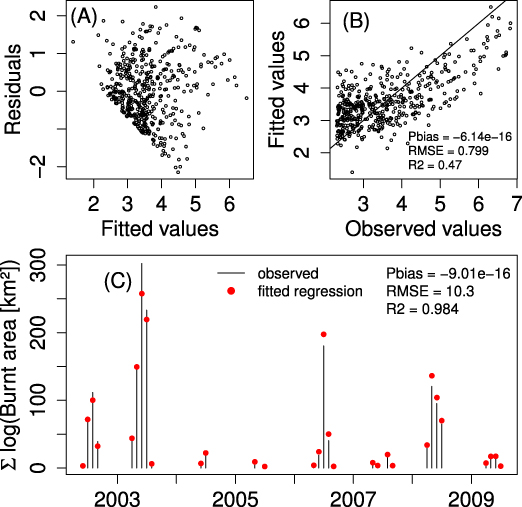
Figure 4. Results of the explanatory model for log-transformed burned area in continuous permafrost regions with larch forests and burned areas >10 km2. (A) Residuals of the multiple linear regression model against the fitted log-transformed burned area values and (B) fitted against observed values. (C) Regionally summed time series of observed and fitted log-transformed burned area.
Download figure:
Standard imageThe most significant variable in this regression model is the lagged inter-annual variability time series component of the surface moisture (table 2), indicating a negative relationship between average surface moisture conditions in the previous summer and burned area in the current year. The second-most significant variable is the inter-annual variability time series component of the surface moisture, followed by the lagged remainder time series component of the surface moisture. This represents a negative relationship between short-term surface moisture conditions in the few previous months and burned area. The seasonal time series components of the Nesterov index and the precipitation have positive relationships with burned area. Thus, the seasonality of both variables agrees with the seasonal cycle of the fire season. The short-term variations of the Nesterov index in the previous months and the surface moisture anomalies and lagged short-term variations of the precipitation show positive and negative relationships to burned area, respectively. This indicates the effect of actual low precipitation and dry air and surface moisture conditions on fire activity. Wind speed is positively related with burned area. The slope of the terrain, the anomaly of the Nesterov index and surface moisture showed positive relationships, whereas elevation, precipitation and the seasonal time series component of surface moisture showed negative relationships in the initial explanatory model including all variables. But including these variables in the explanatory model did not decrease the AIC or they were not significant. Thus they are not included in the final explanatory model.
4. Discussion
Usually, the largest proportion of burned area occurs outside the permafrost zones in the Baikal region. However, a large proportion occurred in the continuous permafrost zone in the extreme fire year 2003. Our data analyses contributed to explaining the reason for this anomaly.
Although the entire region experienced the same precipitation deficit in spring 2003, the continuous permafrost regions had more negative surface moisture anomalies than the permafrost-free regions. The extreme burned areas in spring 2003 were probably initiated by the lack of precipitation, the extreme fire weather and additional dry surface moisture conditions in spring 2003. Usually, surface moisture shows the highest values in spring in permafrost regions. This peak is caused by the release of melting water from the active layer of permafrost soils. But already in the late summer 2002, these regions experienced negative precipitation anomalies. Hence, lower than average surface moisture conditions have been stored in soil during the winter 2002/2003. As a consequence, the melting water source was not available in spring 2003. There is a high agreement in the spatial patterns between dry surface moisture conditions in 2002 and extreme burned areas in 2003 (supplementary material 1 available at stacks.iop.org/ERL/7/044021/mmedia).
The effect of late-summer droughts on surface moisture availability and fire activity in the next spring seems to be a general relationship in permafrost-dominated larch forests in the Baikal region (table 2). The average surface moisture conditions in the previous summer and the short-term surface moisture anomalies in the months before the fire event had the largest effects on burned area for all fire events in 2002–2009 in this region. The short-term variations of Nesterov index and precipitation caused additional spring drought conditions. Wind speed additionally increases the size of burned areas. However, both Nesterov index and precipitation anomalies alone cannot explain the spatial–temporal variation in burned area.
The relationships between permafrost occurrence, surface moisture and burned area can be explained by soil–vegetation interactions in permafrost-dominated larch forests in eastern Siberia (Ohta et al 2008). Larch forests have a root system in the organic soil layer covered by lichen and mosses. Additionally, the annual loss of needles and the low decomposition rates at low temperatures result in thick organic layers. The vegetation can only absorb snow melt water or water stored in the active layer. The permafrost table prevents vegetative water uptake from deeper layers. The organic layer is drying out in summer because of the inhibited water availability for plants from the frozen subsoil, the high transpiration and penetrating wind because of the thin canopy (Sofronov and Volokitina 2010). If only a low amount of water is stored in the active layer from the previous summer, the organic layer will dry out additionally fast. This explanation is supported by our findings that most burned areas in the entire Baikal region occur in larch forests (supplementary material 2 available at stacks.iop.org/ERL/7/044021/mmedia). The average annual burned area is larger in needle-leaved deciduous forests than in needle-leaved evergreen forests. Additionally, we found a positive relationship between permafrost extent and the average annual burned area which is mostly due to the large fraction of 2003 burned areas in continuous permafrost (supplementary material 2 available at stacks.iop.org/ERL/7/044021/mmedia). However, we cannot distinguish from our analysis if the higher fire activity in permafrost regions in 2003 and the time-lagged relationship between surface moisture and fire activity is due to a regulating effect of freezing/thawing on soil moisture or because of the drying effects on the organic layer in larch forests.
Sources of uncertainty in this analysis mainly originate from the precipitation and the surface moisture datasets. Nevertheless, precipitation anomalies of the ERA-Interim dataset highly agree with another dataset (supplementary figure S4 available at stacks.iop.org/ERL/7/044021/mmedia). The AMSR-E surface moisture product is the only consistent and available dataset for this region and time period. We were using only the anomalies of this dataset because they are more reliable than absolute values (Rüdiger et al 2009). We tried to exclude frozen pixels from the analysis based on air temperature data, but we cannot make sure to consider only surface moisture values from un-frozen pixels. Frozen top soils can have the same effect on fuel moisture and fire activity as un-frozen but dry soils, because they are limiting water availability for larch trees in the organic layer. In addition, the distribution of burned area by permafrost extent is only a rough estimate. Permafrost extent is taken from a global map, which is probably too generalized for detailed analyses of relationships between fire activity and permafrost. The use of other datasets, field observations or the application of this analysis to other regions and future fire events with newly available datasets of surface moisture and freezing or thawing, will advance our understanding about effects of organic layers, freezing/thawing and surface moisture conditions on fire activity in Siberian larch forests.
5. Conclusions
In the extreme fire year 2003, a larger proportion of burned area occurred in areas underlain by permafrost in the Baikal region than in average fire years. Fires in spring 2003 were more related to surface moisture conditions than to precipitation anomalies. In 2002–2009, fire activity in permafrost-dominated larch forests is strongly related to surface moisture conditions in the previous summer. In contrast, weather conditions (precipitation anomaly, Nesterov index) are weaker predictors of such events. Permafrost occurrence could have an effect on fire activity by regulating fuel moisture conditions or by supporting the accumulation of thick organic layers as fuel in larch forests which is due to low decomposition rates.
This analysis highlights a more nuanced view on the evolution of extreme fire events in boreal forests, which should not be assessed solely on the basis of weather patterns and climatic indices as in previous studies (Balzter et al 2005, Jupp et al 2006). In contrast, fire models that take into account the effect of surface moisture on burned area (Thonicke et al 2010, Kloster et al 2010) need to be coupled with permafrost-specific hydrology models (e.g., Beer et al 2007). By applying such models, we could be able to better predict fire hazards and more validly project the vulnerability of boreal forests. Such models could be also used to investigate feedback mechanisms between climate, carbon emissions and changing land surface properties due to fire activity, soil properties and forest composition in an integrated assessment.
Acknowledgments
We thank the National Snow and Ice Data Center, Boulder, Colorado for providing the AMSR-E surface moisture data (daily updated AMSR-E/Aqua L2B Surface Soil Moisture, Ancillary Parameters, & QC EASE-Grids V002, data from June 2002 to December 2009 used) and for providing the IPA circum-arctic map of permafrost and ground-ice conditions. Climate data was provided by the European Centre for Medium-range Weather Forecast (ECMWF). Further we thank Paul Overduin (AWI Potsdam) and Trofim Maximov (Institute for Biological Problems of Cryolithozone, Yakutsk) for comments on an early version of the manuscript. We thank the anonymous reviewers for their comments. MF conducted this work partly at the International Max Planck Research School for Global Biogeochemical Cycles. KT was funded by the EU-FP7 large-scale project FUME.