
Abstract
Fish coordinate the motion of their fins and body to create the time-varying forces required for swimming and agile maneuvers. To effectively adapt this biological strategy for underwater robots, it is necessary to understand how the location and coordination of interacting fish-like fins affect the production of propulsive forces. In this study, the impact that phase difference, horizontal and vertical spacing, and compliance of paired fins had on net thrust and lateral forces was investigated using two fish-like robotic swimmers and a series of computational fluid dynamic simulations. The results demonstrated that the propulsive forces created by pairs of fins that interact through wake flows are highly dependent on the fins' spacing and compliance. Changes to fin separation of less than one fin length had a dramatic effect on forces, and on the phase difference at which desired forces would occur. These findings have clear implications when designing multi-finned swimming robots. Well-designed, interacting fins can potentially produce several times more propulsive force than a poorly tuned robot with seemingly small differences in the kinematic, geometric, and mechanical properties.
Export citation and abstract BibTeX RIS

Original content from this work may be used under the terms of the Creative Commons Attribution 4.0 license. Any further distribution of this work must maintain attribution to the author(s) and the title of the work, journal citation and DOI.
1. Introduction
1.1. Background
A fundamental challenge when designing underwater robots that are propelled by flapping fish-like fins is how to arrange and coordinate the fins to create the forces required for effective propulsion and agile maneuvers. This basic locomotory requirement is difficult, in part, because flapping fins do not create a constant thrust, but generate forces that vary in magnitude and direction throughout the fin's undulatory stroke. The forces created by fins are also highly dependent on the fin-fluid interactions that occur as wakes are passed between fins and flow moves along the body [1, 2]. The challenges associated with coordinating multiple propulsors and tailoring forces to the dynamics of the body are not unique to systems driven by fins, but are an underlying issue faced by many classes of robots and vehicles. As examples, the coordination of robot limbs to produce smooth gaits for walking and to dynamically stabilize against external disturbances, and the ways in which forces from multiple driven wheels are used to help maneuver a moving car are enduring areas of research [3–5]. Thus, in underwater vehicles, and more specifically in biologically inspired swimming robots, understanding how to design multiple, interacting fins to produce and shape propulsive forces is key to producing good locomotion and agile maneuvers.
Ray-finned fishes (Actinopterygii) have solved this challenge using a variety of fin morphologies and gaits. Rarely is the entire force that a fish generates to swim created by a single fin, flapping alone. Rather, fin and body motions are coordinated so that component forces add constructively, and so that downstream fins engage beneficially with the wakes shed by the upstream fins and body [6–8]. There is not a single solution to accomplishing this and across fish species different fin coordination strategies have been observed. Nor is there necessarily a single strategy used by an individual fish across its range of swimming speeds. There is great diversity in the sizes and locations of the median fins, and with this, differences in the timing and amplitudes of how each fin is flapped [9–11]. Freshwater sunfish (genus Lepomis), for example, have a symmetrical arrangement of the anal and dorsal fin, whereas the dorsal fins of trout (genus Salvelinus) and salmon (genus Salmo) are located farther forward on the body than the anal fins. Many fish that swim at higher speeds, such as tuna (tribe Thunnini), have caudal fins that are stiff, dorsal and anal fins that are elongated but thin, and finlets along the tail that help guide flow [12]. Additionally, fish can vary the morphology and kinematics of fins depending on the locomotory task, and even modulate a fin's stiffnesses as swimming speeds change [6, 13–16]. Sailfish (genus Istiophoridae), for example, retract much of the dorsal fin nearly flat against the body when swimming over distance, and extend the fin when maneuvering to catch prey so that the fin acts as a large, flexible control surface [2, 17]. Understanding how different fin arrangements, structural characteristics, and kinematic relations affect the flows that move between fins and the resultant forces is critical to adapting these biological strategies to robots.
When fins interact with the time-varying wakes produced by other flapping fins (figure 1(D)), the phasing between fins is among the most critical factors that affect the magnitude, direction and time-course of forces, and the propulsive efficiency of fins. Geder et al [18], Boschitsch et al [19] and Matthews and Lauder [20] found that tuning the phase relationship between a pair of fins can greatly affect thrust production and propulsive efficiency. Mignano et al [21] found, using robotic and 2D numerical models of fins, that the magnitudes of both the mean thrust and the root mean square (RMS) lateral force varied significantly as the phase difference between the dorsal/anal fin and caudal fin was altered. The changes in force were associated with changes in the way the downstream fin interacted with the wake shed by the upstream fins and body. The appropriate phase relationship between fins enabled the downstream fin to align with the wake flow and to entrain vortices produced by the upstream fin, leading to increased thrust production [21–25]. Flammang et al [26] demonstrated, using 3D volumetric flow visualization, that the vortex wake shed by the dorsal and anal fins can be entrained by the tail within a single fin beat. Using 3D computational fluid dynamic (CFD) simulations, Han et al [24] have shown that changing the dorsal/anal fin flapping phase affects the timing of the interaction between the vortices shed by the dorsal/anal fins and the leading-edge vortex of the caudal fin, with appropriate phasing increasing thrust by 25.6%. Similarly, Kurt and Moored [27] have shown with a set of in-line arranged propulsors, that fin spacing and phasing between the fins can significantly affect the timing of vortex impingement and net thrust.

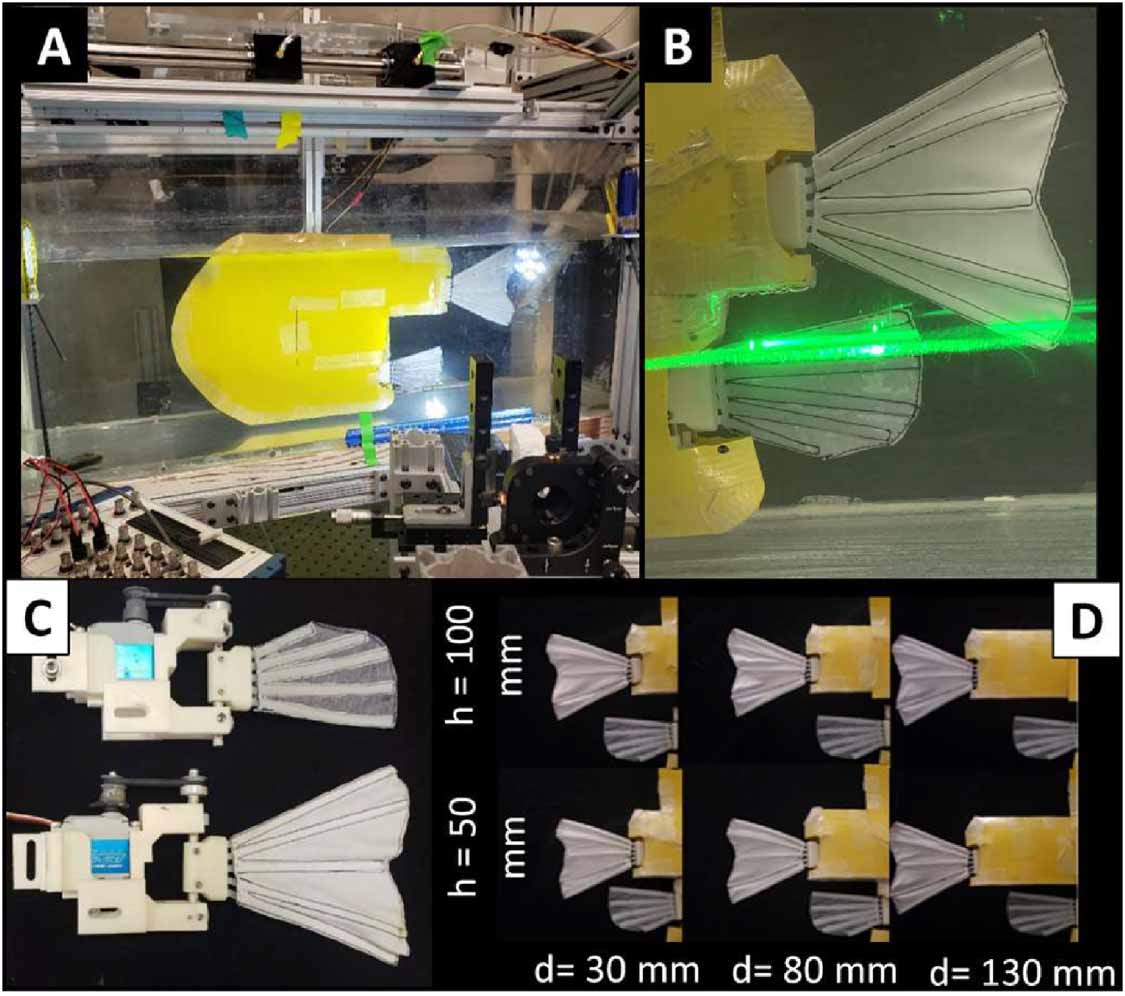
Figure 1. Two bio robotic systems and a numerical model used for experimentation with a characteristic 2D wake shed by a fin. (A) Horizontal, Vertical, Anal, Caudal (HVAC) multi-fin robot. (B) Peduncle, Dorsal, Anal, Caudal (PDAC) multi-fin robot. The PDAC robotic system is positioned upside-down during experiments to allow the body, dorsal and caudal fins to be filmed through the transparent bottom of the flow tank. (C) Numerical model of 2D rigid flapping fins. (D) Characteristic 2D structure of the wake produced by a flapping fin.
Download figure:
Standard image High-resolution imageBased on the importance that the phase-based timing of fins has on the propulsive force; it is reasonable to expect that the kinematic and physical characteristics of fins that impact the timing of the wake will also affect the propulsive forces. These factors include the relative location and compliance of the fins, as well as fin size, shape, speed, and trajectories. Thus, the objective of this study was to understand how the horizontal (d) and vertical (h) spacing of paired, compliant flapping fins affected the propulsive forces produced as the phase difference between fins ( Φ ) was varied from 0 to 360 degrees. These studies contribute to understanding how the median fins of robotic swimmers should be located on the vehicle body and driven to create the forces desired for effective locomotion.
2. Materials and methods
2.1. Three multi-fin systems
The study was conducted using two robotic swimmers–the 'HVAC' and 'PDAC' robots–and a series of CFD simulations (figure 1) to characterize the effect of varying 2D fin spacing and compliance on the relationship between fin phasing and propulsive forces. This work aimed to assess whether the identified trends in propulsive forces due to varying parameters were consistent and applicable to a broader spectrum of engineered systems. The use of multiple robotic platforms allowed for a more extensive exploration of the parameter space. Numerical CFD simulations were used to explore fin spacing with a finer resolution and provide additional insight into the fluidic fin-wake interaction, augmenting the results gathered with robotic experiments. The HVAC robot (figure 1(A)) has two fins (dorsal and caudal), each actuated at its base. The horizontal ( d ) and vertical ( h ) position of the dorsal fin can be adjusted. Studies using the HVAC robot were conducted using two sets of fins of different compliance (c). The PDAC robot has a dorsal, anal, and caudal fin, and an actuated joint at the peduncle or base of the tail (figure 1(B)). In this study the anal fin and peduncle joint were not actuated, being fixed to align with the dorsoventral plane during all trials. The position of the dorsal fin can be varied rostro-caudally to change the horizontal spacing between the dorsal and caudal fin ( d ). Numerical CFD simulations (COMSOL Multiphysics, Comsol Inc., Sweden) modelled the flapping fins as 2D rigid foils and enabled forces to be predicted and flows to be visualized as the phase difference and horizontal separation between fins were changed (figure 1(C)). For all pairs of fins, the horizontal distance between the fins ( d ) was measured in the horizontal plane, from the aft-most edge of the dorsal fin to the leading edge of the caudal fin. The vertical distance between the fins ( h ) for both robots was measured from the midline of the dorsal fin to the midline of the caudal fin.
The HVAC is a two-finned system that enables both the horizontal ( d ) and vertical spacing ( h ) of the compliant fins to be adjusted (figure 2(A)). It was designed as a complementary platform to the PDAC, having fins of similar size, actuated to produce similar fin motions, and attachments that allow the system to be tested using the same air-bearing carriage as the PDAC. The HVAC is comprised of three main subsystems: (1) a fish-shaped shell, (2) two actuated fins, the dorsal and the caudal, and (3) a control and power module. The external shell smooths and directs oncoming flow around the internal support structure and towards the median fins. It is fabricated from polyethylene terephthalate glycol sheets, and its size and shape can be adjusted by adding or removing panels as fin spacing is changed. This allows the location of the caudal fin to be adjusted by adjusting the length, and attachment point of removable tail beams. Each of the median fins is made using five compliant fin rays enclosed in an 84% polyester/16% elastane webbing (Under Armour, Inc., Baltimore, MD, USA) (figure 2(C)). The fin rays are manufactured using SLA (Durable Resin, FormLabs, Somerville, MA, USA) and have rectangular cross sections that taper from base to tip so that the fins are more flexible near the tip than at the base. Details of fin ray shapes and taper are described in [21] and were tuned such that the fins of both robots exhibited the same curvature when flapped. For the HVAC system, two distinct sets of fin rays were developed: one mirroring the fin compliance of the other robotic system (PDAC), and a second set designed for greater compliance. The augmentation of compliance in the latter set was achieved by reducing the thickness and taper of the fin rays. This adjustment's effectiveness was experimentally validated by measuring the tip deflection of each set when a calibrated load was applied at their tips. The results showed a 30% increase in tip deflection for the more flexible set relative to the baseline fin. Each fin is driven at its base using a waterproof servomotor (WR-4401, Xpert-RC USA, Bellevue, WA, USA). Servomotor trajectories are defined using an external PC and commanded using an 8-bit AVR microcontroller (Arduino UNO, Arduino LLC, Italy).

Figure 2. Detailed view of the HVAC robot. (A) HVAC robot with yellow, flow-smoothing fairing with the lateral view of the dorsal and caudal fins. (B) Close up view of the particle image velocimetry plane used to observe flow interchange between fins. (C) Motor modules for upstream and downstream fin. (D) The 6 fin distance configurations of the HVAC robot.
Download figure:
Standard image High-resolution imageThe PDAC system is a robotic experimental platform developed to investigate multi-fin and body propulsion (figure 1(B)). The PDAC robot is comprised of three main subsystems: (1) a fish-shaped body with an actuated peduncle; (2) three fins (dorsal, anal and caudal); and (3) a support structure that suspends the system in a flow tank and that houses the actuators and control electronics. A detailed description of the PDAC robot is presented in [21].
The 2D CFD simulation of a pair of interacting rigid fins was developed (COMSOL
Multiphysics, Comsol Inc., Sweden). The two, 2-dimensional rectangular fins were 90 mm and 107.5 mm long and 2 mm wide and flapped in a simulated flow tank. A turbulent k-ε model with Reynolds-averaged Navier–Stokes formulation was used to calculate flows and forces [28]. Details of model approach and development are described in [21].
2.2. Experimentation
Experimental trials were conducted using the robotic and numerical systems to investigate the impact of fin spacing and compliance had on the net forces produced by and flows surrounding the fins (table 1).
Table 1. Tested fin spacing and compliance configuration for all systems.
| System | Horizontal distance between Fins, d (mm) | Vertical distance between Fins, h (mm) | Relative Fin Compliance, c |
|---|---|---|---|
| HVAC Robot | 30, 80, 130 | 50, 100 | 1.0, 1.3 |
| PDAC Robot | 48, 88, 128 | 50 | 1.0 |
| Numerical simulation | 40, 60, 80, ..., 240 | N/A | RIGID |
In the PDAC robot, the horizontal spacing between the dorsal and caudal fins ( d ) can be varied continuously between 48 and 128 mm, with tests conducted for d = 48, 88 and 128 mm (table 1).
The HVAC robot was tested with three horizontal fin spacings ( d = 30, 80, 120 mm) and two vertical fin spacings ( h = 50, 100) for a total of six geometric configurations (figure 2(D)). To test the impact of fin compliance, forces were measured and flows were recorded using the HVAC robot using two sets of fins of different compliance, described in the previous section.
Numerical simulations were conducted as the distance between the dorsal fin and the caudal fin was increased incrementally by 20 mm from 40 mm to 240 mm (table 1).
For all tests, with both robots and the numerical simulations, the fins were flapped at 1.0 Hz with an amplitude of ±22°, with an oncoming flow velocity of 200 mm s−1. These flow conditions correspond to a Strouhal number of approximately 0.5 with a Reynolds number of 105 660 and consistent with conditions observed with swimming fish [29]. For each configuration of different fin spacings, net forces and flows were measured for all systems as the phase relationship between the fins was varied from 0° to 360° (table 1).
2.3. Data collection and analysis
The robotic systems were attached to an air bearing carriage (New Way Air Bearings, Aston, PA, USA) that suspended the robots underwater in a recirculating flow tank for testing. Net thrust and lateral forces produced by the robots were measured with a sample frequency of 250 Hz using two load cells (LSB200, Futek Inc., Irvine, CA, USA). High-speed videos (fps = 500, resolution = 1024 × 1024) of the ventral and lateral views were captured simultaneously with forces measurements. Digital particle image velocimetry was used to image and analyze the wakes produced by the robotic fins, as described in previous research [21, 30–32]. The laser-excited light sheet was projected orthogonally to the plane of the fins and aligned with the region where the wake shed by the upstream fin would interact with the downstream fin (figure 2(B)).
From each experimental trial, the force measurements from ten consecutive fin beat cycles were processed to produce force traces, force-phase curves, and averages for further analysis. After discarding the measurements from the first three fin beat cycles to minimize the inclusion of transients, measurements of the subsequent ten cycles in each trial were extracted and aligned using a synchronization signal generated by each robot's microcontroller. The raw force recordings were processed with a median filter with a five-sample window, followed by a low-pass filter which used a Kaiser window with a passband frequency of 9 Hz, as stopband frequency of 12 Hz and a peak error of 10−3 [33]. Mean net forces were then calculated from these force recordings for each tested condition. Since the mean of the lateral force over each fin beat was approximately zero, the RMS rather than the mean is used to quantify the net lateral forces. A 2nd order sinusoidal model was fit to the force-phase relationship data to facilitate comparison between data from each system and the various fin configurations and calculate phases at which the maximum mean thrust (ΦTHR) and minimum RMS lateral forces (ΦLAT) occurred.
The 2D computational fluid dynamic model was used to better understand flow dynamics with analysis focusing on characteristics of the flow in the region at and around the leading edge of the downstream fin. Specifically, the vorticity of the wake shed by the upstream fin and the angle-of-attack (AoA) of the downstream fin were computed across a fin beat. At every tested distance, the amount of time spent by the downstream fin at low angles-of-attack, specifically [−25°, 25°], were computed. Estimates of net force were calculated by integrating the total stress of both fins in each direction. Similar to the experimentation using robots, each numerical simulation was run for ten consecutive fin beat cycles. To reduce the effect of transience, the initial three fin beat cycles were disregarded.
3. Results
3.1. Overview
The range of forces that could be achieved by adjusting the phase difference between fins was highly dependent on fin spacing ( d , h ) and compliance (c) . The maximum and minimum mean thrust and the RMS lateral force that could be achieved were altered, and the phase differences at which the maximum and minimum mean forces occurred were shifted as these experimental factors were varied. Importantly, the underlying relationship between force and phase difference–where the mean thrust, and the RMS lateral force moved between a peak and trough as the phase difference between fins was modified–was preserved across all experimental conditions. No matter the combination of physical settings, a wide range of propulsive forces could be created by adjusting the phase between fins.
In conjunction with affecting the propulsive force, changes made to the experimental factors ( d, h , and c ) altered the timing, direction, and strength of the time-varying wake that was encountered by the downstream fin. None of the factors had a strong effect on the undulatory structure of the wake as it left the upstream fin, but the upstream fin's compliance did affect the direction and vorticity of the wake as the wake was shed. The major impacts of changes in fin spacing were on the engagement of the downstream fin with the oncoming flow.
3.2. Definitions
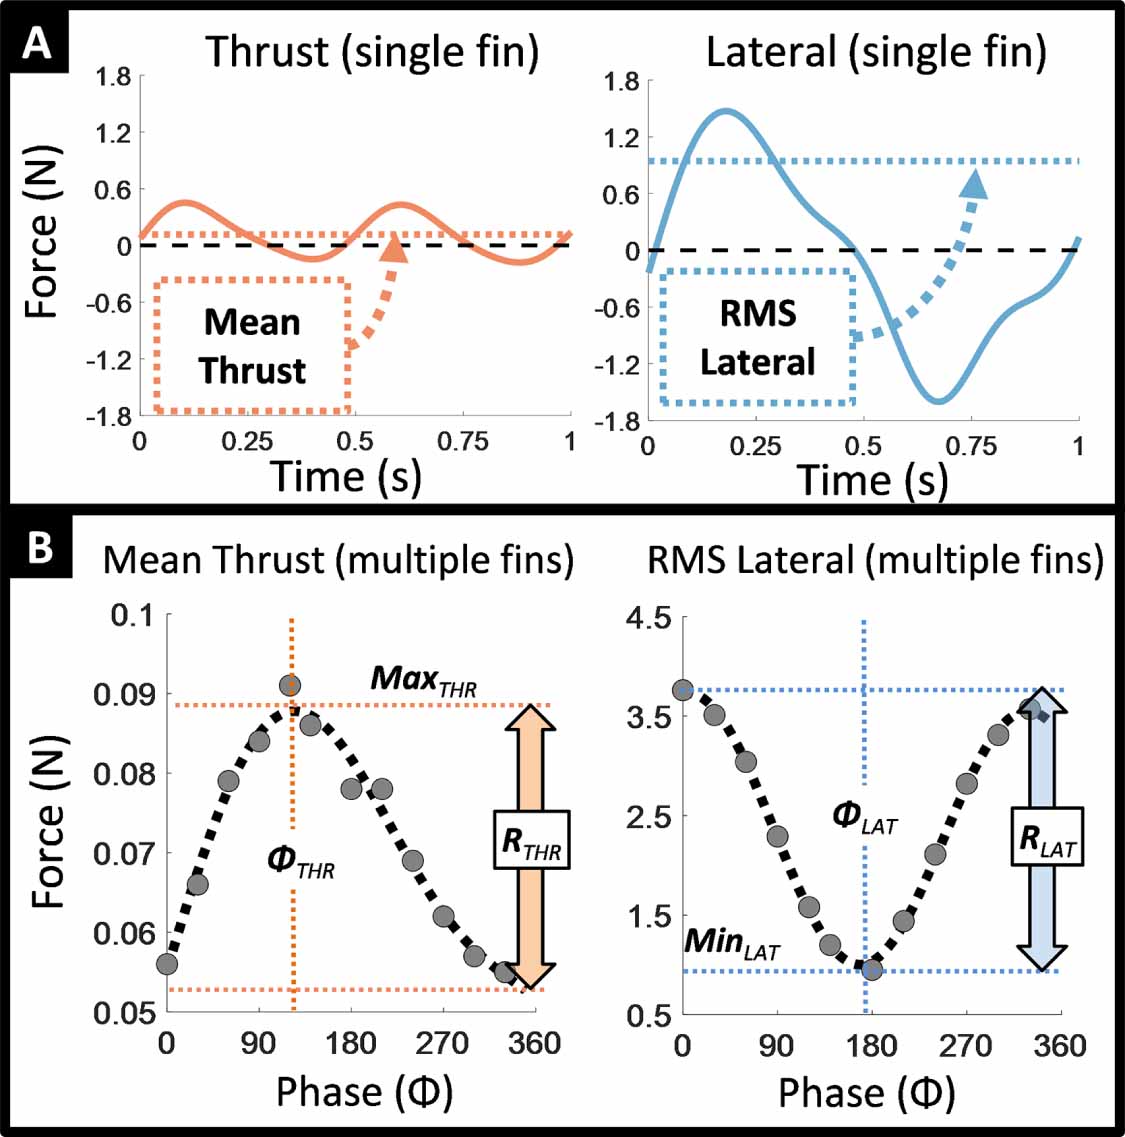
The impact that each factor had on thrust (as it varied with phase difference) will be described using the maximum mean thrust ( Max THR ) that was attained, the phase difference at which the maximum mean thrust occurred (ΦTHR), and the range over which the magnitude of the mean thrust varied as the phase difference between fins was cycled from 0° to 360° ( R THR) (figure 3(B), left). Similarly, the impact each factor had on the lateral force will be described using the minimum RMS lateral forces (MinLAT), the phase difference at which MinLAT was observed (ΦLAT), and the range over which the RMS lateral forces varied ( R LAT) (figure 3(B), right). RMS lateral force, rather than mean (figure 3(A), left), is used because the lateral force exhibits two opposing peaks during a fin beat, with a mean net of approximately zero (figure 3(A), right).

Figure 3. Metrics used to characterize swimming performance (A)Typical time-dependent force trace of net thrust and lateral forces produced by a single flapping fin. (B) Characteristic forces vs phase curve of net mean thrust, and root-mean-square (RMS) lateral forces produced by multiple oscillating fins across varying phase differences.
Download figure:
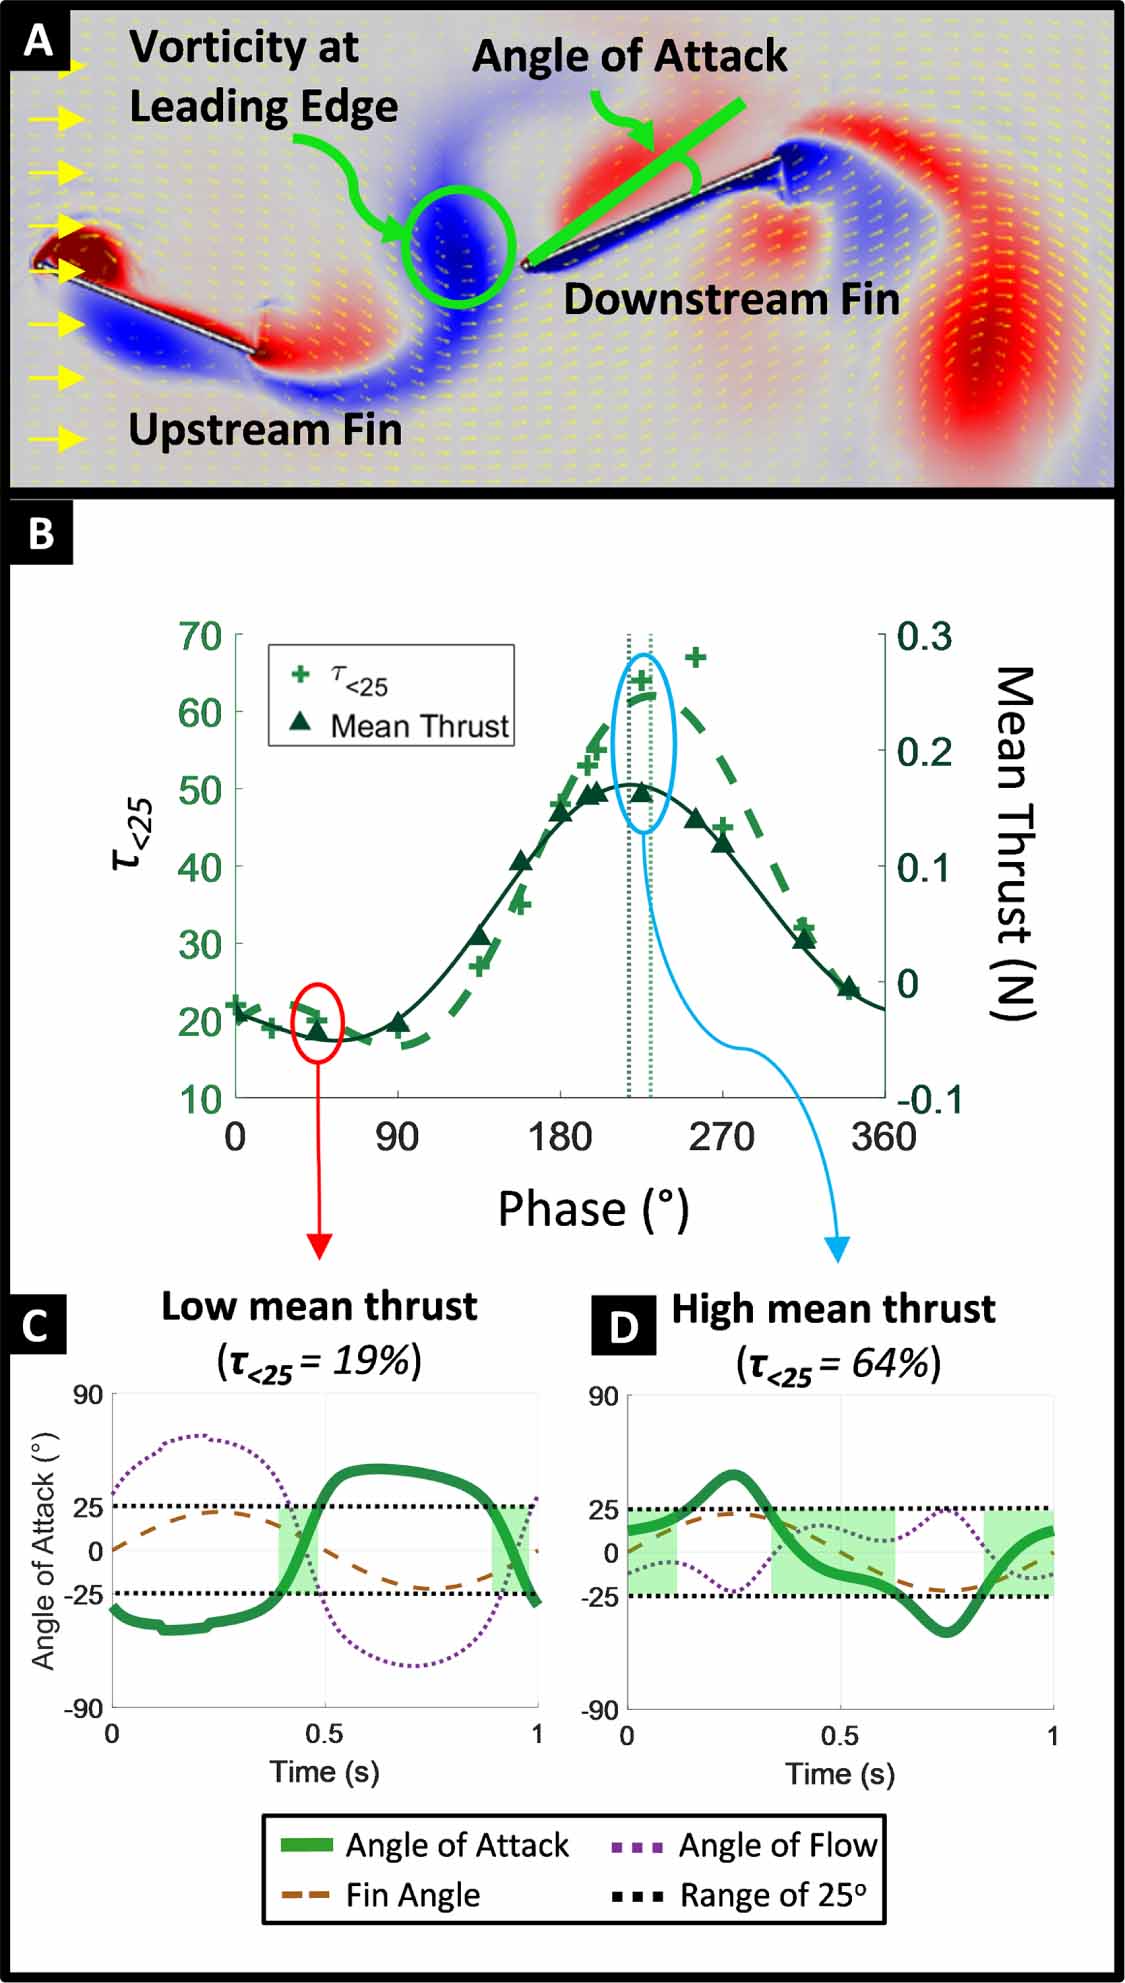
Standard image High-resolution imageThe engagement of the downstream fin with the undulatory wake shed by the upstream fin will be characterized using two parameters; the peak vorticity ( ω ) of the flow measured at the leading edge of the downstream fin (figure 4(A)), and by the proportion of the downstream fin's flapping period, as a percentage, during which the AoA between the fin's leading edge and the oncoming flow was less than 25° ( τ<25 ) (figure 4(B)). Angle-of-attack(AoA) provides an insight into how the flow interacts with the fin. In this study, we consider the AoA to be low when it is under 25 degrees. τ<25 served as a good indicator of a favorable interaction of the downstream fin with the wake shed by the upstream fin. Different values of τ<25 was calculated when the phase difference between the fins was varied at each fin spacing. These values followed a similar trend as net mean thrust forces when the phase was altered (figure 4(B)). For example, at a particular distance, when net mean thrust was high, the angle of attack of the downstream fin remained low for majority of the fin beat ( τ<25 = 64%) (figures 4(B) and (D)). In contrast, when net mean thrust was low, the angle of attack of the downstream fin remained high for majority of the fin beat ( τ<25 = 19%, figures 4(B) and (C)).

Figure 4. Metrics used to characterize fin-fluid interaction (A) Characteristic flow field and vorticity being exchanged between a pair of rigid 2D oscillating fins in numerical simulation. (B) Net mean thrust and τ< 25 (percentage of fin beat when the downstream fin's angle of attack was less than 25°) as phase is increased from 0° to 360°. Angle-of-attack over a fin beat cycle of the downstream fin derived from the numerical simulation under conditions that produce (C) low net thrust and (D) high net thrust forces.
Download figure:
Standard image High-resolution image3.3. Effect of horizontal distance (d)
3.3.1. On net thrust
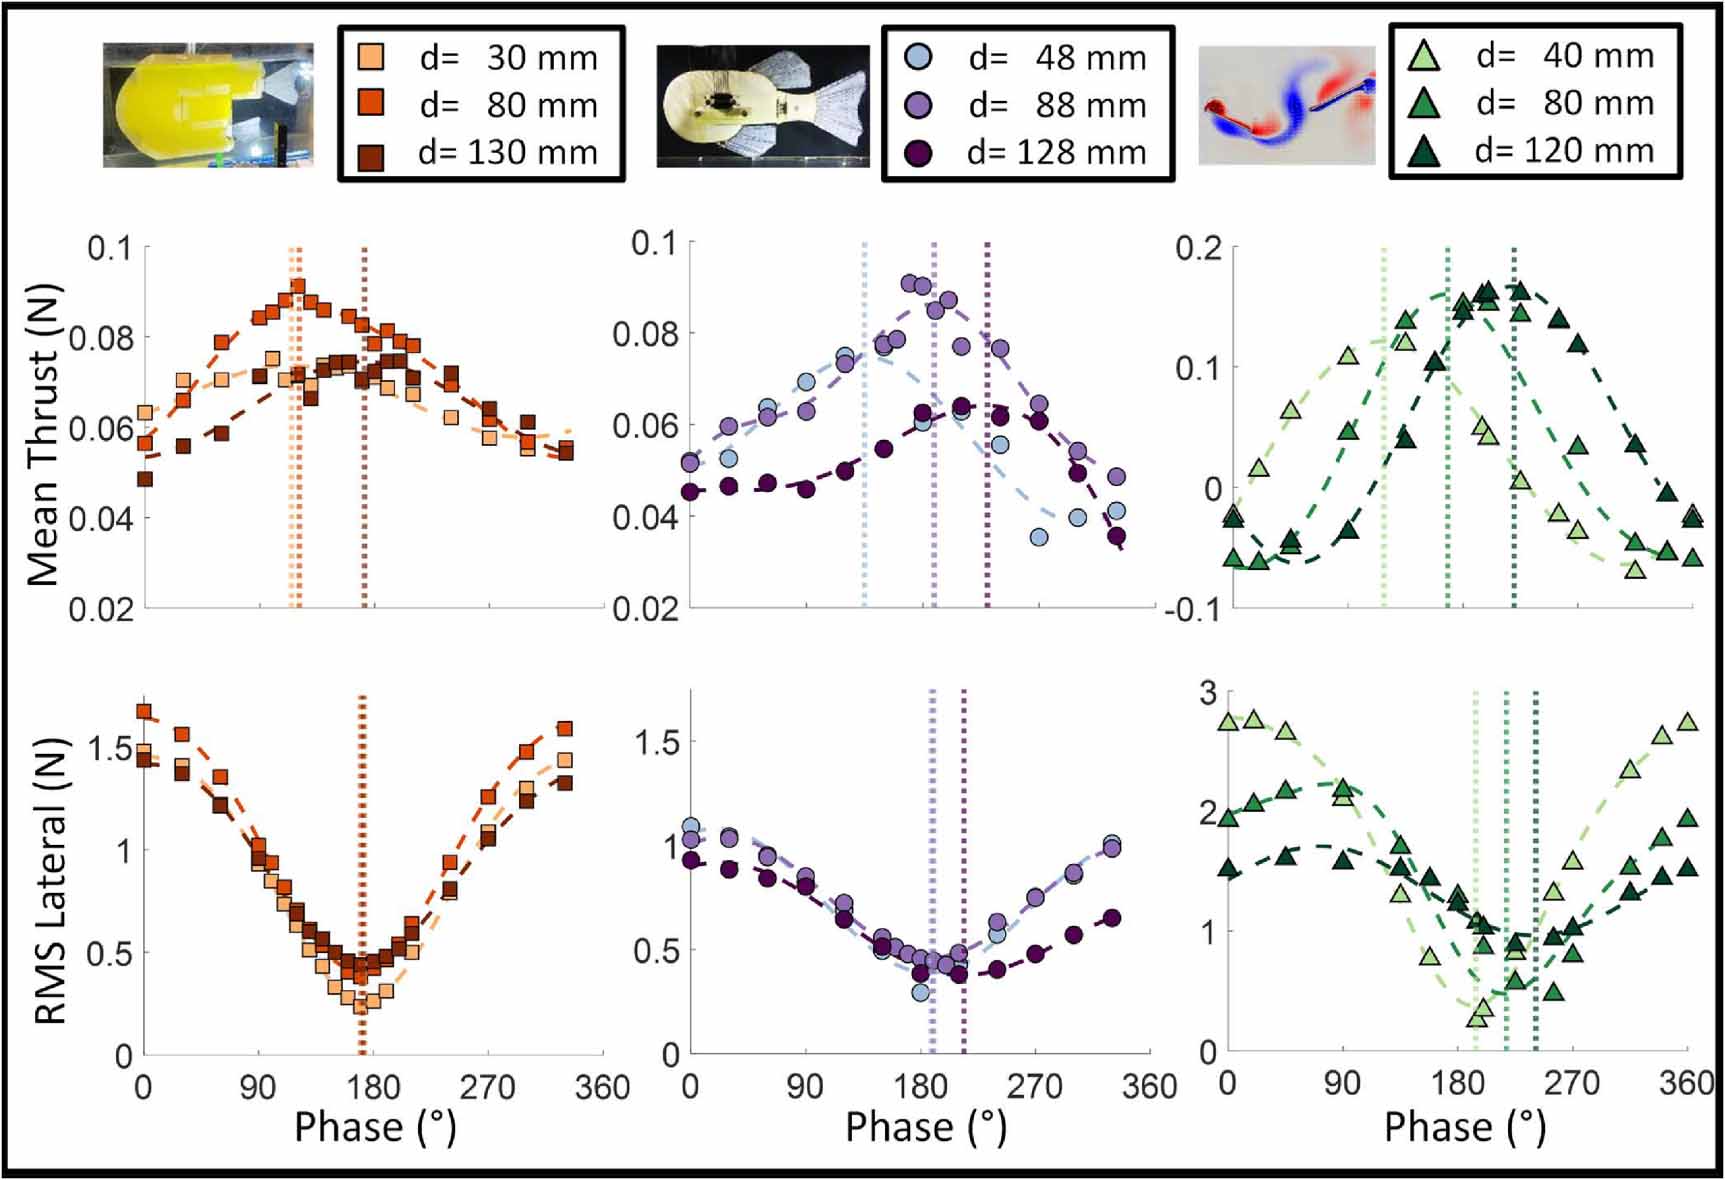
As the horizontal distance between fins ( d ) was increased, the range of forces that could be achieved by modulating phase changed steadily, albeit not monotonically (figures 5 and 6(A)) and the phase differences at which the maximum and minimum net thrust occurred increased nearly linearly (figures 5 and 6(B)). Patterns in the force-phase curves were consistent between the numerical and robotic models (figure 5). Magnitudes differed between systems, but the ranges and percent changes in force were similar. In the simulation of the two-fin system, the notable escalation in net force magnitude and range is likely attributed to the employment of rigid fins. Rigid fins, even when sharing identical areas and kinematics, outperform compliant fins in total force generation. Although the simulated forces are more pronounced, the fundamental trends, especially in relation to fin spacing, exhibit remarkable consistency with those observed in robotic implementations. When the fins were positioned closely ( d ∼ 40 mm), the numerical and robotic models produced relatively low maximum mean net thrusts (MaxTHR) and could achieve a small range of net thrust ( R THR) when the phase difference between the fins was modulated (figure 6(A)). The numerical model produced a maximum mean thrust of MaxTHR = 93 mN with R THR= 142 mN. The PDAC produced a MaxTHR = 77 mN and the HVAC produced MaxTHR = 74 mN with R THR of 42 mN and 16 mN, respectively. In all tests, the HVAC system produced the smallest range of forces.

Figure 5. Impact of changes to horizontal fin spacing (d) on net Force vs Phase curves with three systems (HVAC, PDAC and Numerical Model). Net mean thrust and RMS lateral forces change with phase as d in increased for each system.
Download figure:
Standard image High-resolution image
Figure 6. Impact of changes to horizontal fin spacing (d) on net Force vs Phase curves with three systems (HVAC, PDAC and Numerical Model). (A) The range of net thrust force achievable by varying phase (RTHR) and maximum net mean thrust force (MaxTHR) as d increases (B) the phase at which MaxTHR occurs (ΦTHR) as d increases (C) The range of lateral force achievable by varying phase (RLAT) and minimum RMS lateral force (MinLAT) as d increases (D) the phase at which MinLAT occurs (Φ LAT ) as d increases.
Download figure:
Standard image High-resolution imageAs the horizontal separation between fins was increased, the maximum mean net thrust and range of net thrust that could be produced increased until reaching their highest values at a fin separation of d = 80–120 mm (figure 6(A)). The numerical model reached MaxTHR of 128 mN and a RTHR of 176 mN at d = 120 mm. This was a 27% increase over MAXTHR when the fins were at their smallest separation ( d = 40 mm). The improvements for the two robot systems were similar. Maximum mean net thrust for the PDAC and HVAC reached 90 mN and 87 mN, a 17% and 15% improvement, respectively. The R THR produced by the PDAC remained nearly the same but R THR doubled to 23 mN for the HVAC robot.
MaxTHR and R THR for each system decreased steadily after their peaks until reaching their smallest values when fin separation was greatest. At d = 240 mm, the numerical model produced a maximum mean net thrust MaxTHR= 88 mN and a range R THR = 116 mN. Although MaxTHR was similar to the values produced when d ∼ 40 mm, the range of net thrust was smaller by approximately 30 mN, and much smaller than at the peak. At a separation of d ∼ 130 mm, the PDAC system produced MaxTHR = 64 mN with R THR = 27 mN, and the HVAC robot produced a MaxTHR = 75 mN with R THR = 20 mN. These values were similar to, but smaller than, the R THR and MaxTHR that occurred when the fins were at their closest spacing.
Coupled to the changes that occurred in mean net thrust were changes to the phase difference between fins that was required to produce a desired net thrust. Essentially, as fin separation increased the curve representing mean net thrust versus phase difference shifted to the right (figure 5 top row). Specifically, there was a linear increase in the phase difference at which the maximum mean net thrust forces occurred as fin separation increased (figure 6(B)). For the HVAC and PDAC robots, the phase at which the maximum mean net thrust (MaxTHR) occurred changed at rates of 0.64 °/mm (R2 = 0.83) and 1.24° mm (R2 = 0.95), respectively. For the numerical simulation, MaxTHR increased linearly with distance at a rate of 1.64 °/mm (R2 = 0.99). The increase in MaxTHR with distance occurred for all distances tested with no indication that the change in phase would stop until phase difference had completed a full cycle.
3.3.2. On lateral force
In contrast to the relatively large changes that occurred in mean net thrust and phase, the RMS lateral force and its relationship to phase difference did not change as significantly with changes to d . There was also less consistency between the results for the robotic systems and for the numerical simulation (figure 5 bottom row) than there was in the net thrust data. The range of RMS lateral forces created by the robotic systems did vary with d (figure 5 bottom row). In all cases, the lowest possible RMS lateral force (MinLAT) was significantly smaller than the largest RMS lateral force that could be produced by adjusting phase. Minimum RMS lateral forces (MinLAT) for the HVAC increased from 270 mN at d = 30 mm to 400 mN at d = 130 mm, while the maximum RMS values that occurred remained above 1400 mN at all distances. Minimum RMS for the PDAC remained between 400 and 470 mN, with maximum values greater than 700 mN.
Whereas the phase difference at which the maximum mean net thrust was produced (ΦTHR) increased linearly with fin separation (figure 6(B)), the phase at which the robotic systems produced minimum RMS lateral force (ΦLAT) did not vary as much or as consistently (figure 6(D)). In the HVAC, the minimum RMS forces occurred at a phase difference of ΦLAT = 180° ± 3° at all distances, while the maximum RMS force occurred when the fins were flapped in phase (0°). In comparison, the phase at which the maximum mean net thrust was produced changed by 58° over the same distance. Similarly, ΦLAT varied by only 15° for the PDAC robot, while ΦTHR changed by 90° as horizontal separation increased.
For the numerical simulation, the changes in RMS lateral force and phase difference were more apparent and patterned (figure 5 bottom row right) than for the robotic systems. As the distance between fins increased from 40 mm to 140 mm, the minimum RMS lateral force increased, and the maximum RMS lateral force decreased (figure 6(C)). At a separation of 140 mm, the range of RMS lateral force was less than 20% of the range when the fins were positioned closely. This translates into the numerical simulation indicating that there was little potential to alter the RMS lateral force by changing fin phase at this middle distance. The pattern reversed as the horizontal distance between fins increased beyond 140 mm. The minimum RMS lateral force decreased, and the maximum RMS lateral force increased until reaching values at a separation of d = 240 mm that were similar in magnitude those that occurred when fin separation was smallest.
In contrast to the robotic systems which exhibited little change with increasing fin separation, the phase difference at which minimum lateral forces occurred, ΦLAT, behaved differently for the numerical model. As the distance between fins increased from 40 mm to 140 mm, ΦLAT increased approximately linearly from 190° to 240°. Phase dropped to 140° as fin separation was increased past 140 mm and then increased approximately linearly, again, to 190° as separation increased to 240 mm. The piecewise change in phase from 240° to 140° occurred concurrently with the shift in the range of RMS lateral force from decreasing to increasing (figure 6(D)). The overall 50° change in phase that occurred in MinLAT was much smaller than the nearly 320° phase shift experienced by the net thrust force, MaxTHR. As for the robotic systems, the results from the numerical simulations indicate that the phase difference for minimum RMS lateral force is less sensitive to horizontal fin separation than the phase difference for maximum net thrust forces.
3.3.3. On flows
Direction and AoA-An increase to the horizontal distance between fins, with no change to the fins' phase difference, changed the time-varying alignment of the downstream fin with the wake that was shed by the upstream fin. The new alignment altered how the AoA of the flow relative to the fin varied through the flapping cycle (figures 7(A) and (B)). The highest mean net thrust forces were produced when the downstream fin maintained a low AoA (<25°) with the oncoming flow during most of the fin beat (figure 7(D)). This resulted in minimal flow separation around the fin's leading edge. In contrast, low mean net thrust forces were produced when the AoA between the flow and fin remained high (>25°), and flow separation was significant, for much of the fin beat (figure 7(D)). In both good and bad cases, the AoA often exceeded 40° when the fin was at its most lateral position in the fin beat. In high net thrust cases, the AoA dropped quickly, while in low net thrust cases the high AoA was sustained.

Figure 7. Effect on the wake encountered by the downstream fin as d increased. (A) Particle Image Velocimetry (PIV) of the PDAC robot at two different d values and two different phase differences showing the flow characteristics associated with good and bad thrust production (B) View of the numerical model with the vorticity highlighted at two different d values showing the vorticity characteristics associated with good and bad thrust production (C) Peak vorticity of the flow at the leading edge of the downstream fin as d was increased. (D) τ< 25 at the phase at which maximum net mean thrust occurs and the phase at which minimum net mean thrust occurs.
Download figure:
Standard image High-resolution imageAcross all distances, when the fins were flapped with a phase difference that maximized mean net thrust, the percentage of the period during which the fin's angle-of-attack remained below 25° ( τ < 25) was maximized. For example, when the fins were 100 mm apart and flapped at ΦTHR = 195°, the phase at which maximum mean net thrust was produced, the τ < 25= 55% (figure 7(D)). When the distance between the fins was increased from 100 mm to 200 mm while keeping the phase relationship constant (Φ= 195°), the lowest mean net thrust forces were produced and the τ < 25 decreased by approximately 2.4 times to 22% (figures 7(B) and (D)). When the phase relationship between the fins was increased ( d = 200 mm, Φ= 360°) such that maximum mean net thrust forces were produced, the τ < 25 increased to 66% (figure 7(D)).
Speed and vorticity-As horizontal spacing increased, there was an exponential decrease (R2 = 0.93) in the peak vorticity of the wake ( ω ) where it reached the leading edge of the downstream fin (figure 7(C)). For the numerical model, when d = 100 mm at ΦTHR, the peak vorticity of the flow at the leading edge of the downstream fin was approximately 19 s−1. When the horizontal distance of the fins was increased to 200 mm, the vorticity of the flow nearly halved to 11 s−1. Even though vorticity of the wake at the leading edge of the downstream fin always decreased as the horizontal distance between the fins increased, mean net thrust force may increase or decrease with the same increase in d , depending on initial force-phase condition.
3.4. Effect of vertical distance (h)
Experiments in which the vertical fin spacing was varied were conducted exclusively with the HVAC robot, the only system with the ability to alter vertical fin separation. Wake flows were visualized using particle image velocimetry (PIV).
3.4.1. On net thrust
Increasing the vertical separation ( h ) between the fins resulted in changes to net thrust and phase that were qualitatively similar to the changes that occurred when the horizontal separation ( d ) was changed (figure 8(A)). The maximums of Max THR and R THR did not occur when the fins were closest ( d = 30 mm, h = 50 mm) and nearly aligned, but occurred when the vertical separation was increased by approximately 50 mm ( d = 30 mm, h = 100 mm). At this separation, mean net thrust reached a maximum of MaxTHR = 87 mN and the range of achievable forces R THR = 30 mN (figure 8(B)). These values were similar to those that occurred when the fins were more closely aligned ( h = 50 mm) but separated horizontally by an additional 50 mm ( d = 80 mm, h = 50 mm), MaxTHR = 85 mN and R THR = 35 mN (figure 8(A)). When either the vertical or horizontal separation was increased further, MaxTHR and RTHR generally decreased. This suggests that there is a 2D separation between interacting fins that maximizes the achievable net thrust.

Figure 8. Effect of increasing vertical distance between the fins on the force-phase curve and associated fin-wake interaction using the HVAC Robot. (A) Effect of increasing h on the shape and magnitude of the force-phase curves across multiple horizontal distances ( d ). (B) Effect on increasing h on the R THR (C) Particle Image Velocimetry (PIV) images in a fixed plane with the downstream fin as the vertical distance between the fins was increased by lowering the upstream fin.
Download figure:
Standard image High-resolution imageSimilar to the observed relationship between phase and horizontal separation, the phase at which the maximum net thrust occurred (ΦTHR) increased consistently with vertical separation. The total change was not the same at all horizontal positions, nor did it vary consistently. For example, when the fins were close to each other horizontally (d = 30 mm) ΦTHR increased by 15°, at the middle location ΦTHR ( d = 80 mm) increased by 36° and at the furthest distance ( d = 150 mm) there was an increase of only 3°.
3.4.2. On lateral force
Increasing the vertical separation between fins affected the RMS lateral forces (RMS) less significantly than it had affected net thrust forces. The shape, magnitude and position of the lateral force-phase curve stayed relatively unchanged as the vertical separation between fins increased (figure 8(A) bottom row). ΦLAT was relatively unchanged and remained at approximately 170° as the distance between fins increased (figure 8(A) bottom row). There was one minor outlier, when the fins were close together and at a vertical separation of h = 100 mm, which resulted in a low ΦLAT of 154°.
3.4.3. On flows
As the vertical separation between fins ( h ) increased from 50 mm to 100 mm, there was less visible interaction between the downstream fin and the wake shed by the upstream fin (figure 8(C)). When the fins were closest ( h = 50 mm), much of the ventral lobe of the downstream fin intersected the wake and engaged with strong vortex streams. When the vertical fin spacing was greatest, the downstream fin encountered only the periphery of the wake where the intensity of the vortices was low. The engagement of the fin with the wake did not, however, change directly with vertical position at all horizontal locations. Although the bulk of the wake moved horizontally with the free stream, the wake also had a vertical component that caused the wake to be angled relative to the downstream fin. This is described and illustrated in [30]. Depending on the horizontal spacing of the fin, and the strength of the vertical flow component, the portion of the downstream fin that intersected the wake, could move out of, or into, the wake as separation was increased.
3.5. Effect of fin compliance (c)
Experiments were conducted using the HVAC robot and two pairs of fins. One pair had a baseline compliance and the other was 30% more compliant. Sets of comparative trials were conducted at three fin separations: ( d , h ) = (30 mm, 50 mm), (80, 50), and (30, 100).
3.5.1. On net thrust
Increasing fin compliance decreased the overall magnitude and range of net thrust forces that were produced (figure 9(A) top row). The decrease in net thrust was significant at all phase differences and was largest at, or very near, the phase at which Max THR occurred. For the closest configuration, ( d , h ) = (30 mm, 50 mm), mean net thrust produced by the more complaint fins was 20%–32% lower than for the stiffer fins, and the range of net thrust ( R THR) was 59% lower. The difference was even greater when fin separation was increased. When the fins were separated by an additional 50 mm horizontally and vertically, ( d , h ) = (80 mm, 100 mm), MaxTHR decreased by 42% and 43%, and R THR by 60% and 69%, respectively. Taken together, the decreased maximum and range of net thrust resulted in the net thrust produced by the more compliant fins to change less with horizontal ( d ) and vertical distance ( h ), than did the net thrust produced by the stiffer fins.

Figure 9. Effect of increasing compliance of fins on the Force-Phase curve and associated fin-wake interaction with the HVAC robot. (A) Effect on increasing fin compliance on the shape and magnitude of the force-phase curves at three different fin locations. (B) Particle Image Velocimetry images in plane with the downstream fin as the compliance of the fins was increased.
Download figure:
Standard image High-resolution image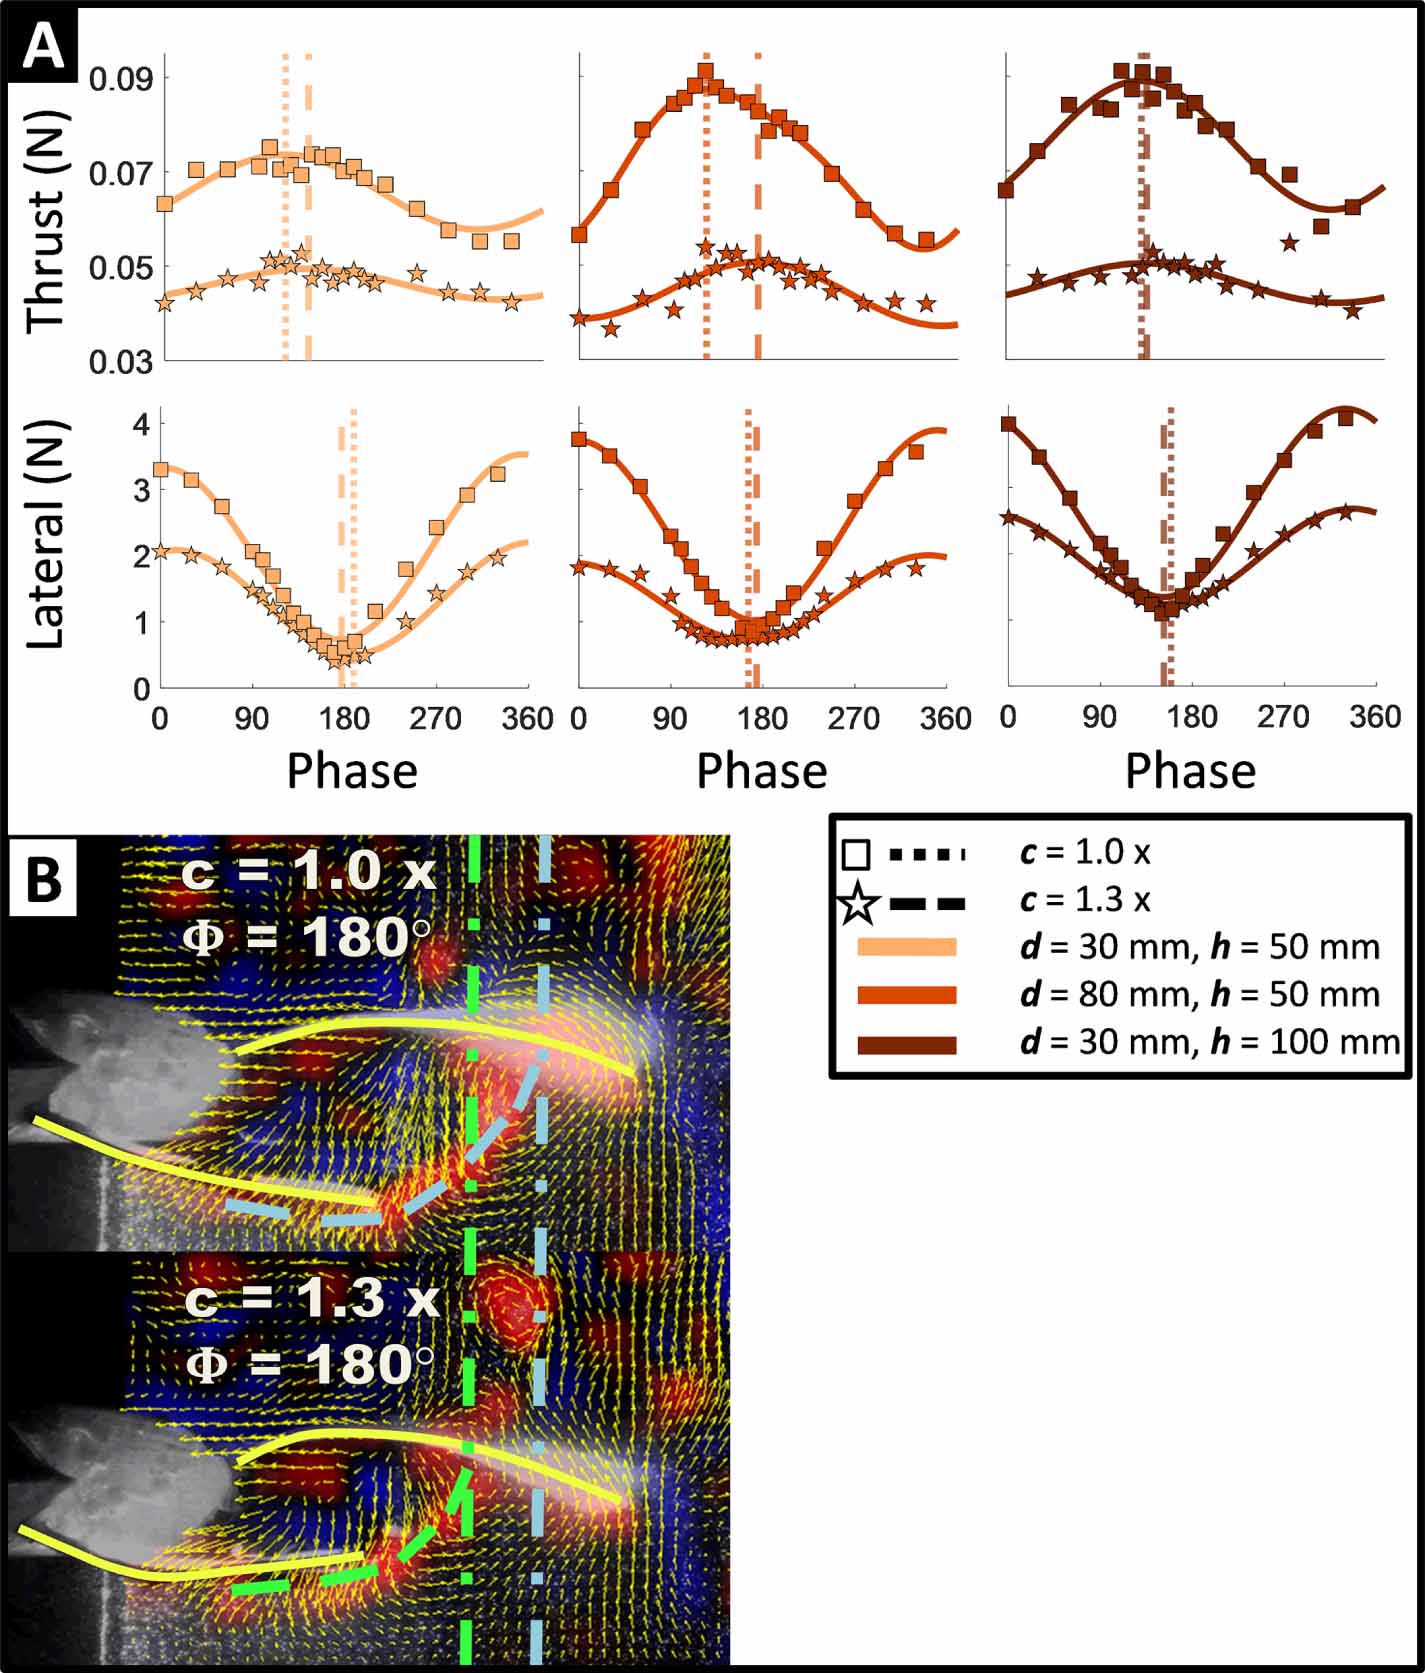
Increasing compliance increased the phase differences at which the maximum and minimum mean net thrusts were created, albeit not uniformly for the three fin configurations for separation. The increase in fin compliance produced a 20° increase in ΦTHR for the closest fin configuration. Increasing the fin separation by 50 mm in either the horizontal or vertical separation increased ΦTHR, by 50° and by only 7°, respectively with the increase in fin compliance.
3.5.2. On lateral force
Fin compliance affected the maximum and range of RMS lateral forces but had little effect on the minimum RMS lateral force ( R LAT) or on the phase differences at which peak (or minimum) RMS lateral forces occurred. (figure 9(A), bottom row). For all three fin configurations, peak RMS lateral force decreased by over 1000 mN when fin compliance was increased. In contrast, the minimum RMS force was approximately the same for the compliant and stiffer fins. The largest difference, which occurred at ( d , h ) = (30 mm, 50 mm), was only 400 mN (figure 9(A) bottom row, left). The phase difference at which peak and minimum RMS lateral forces occurred also changed little. In all three configurations, the phase differences at which the maximum or minimum RMS lateral forces occurred changed by less than 10° when compliance was increased. As occurred for net thrust, increasing fin compliance reduced the impact that the horizontal and vertical fin separation had on fin forces and on the relationships between fin forces and phase difference.
3.5.3. On flows
Based on PIV visualization of the wake, increasing the compliance of the fin did not appreciably change the undulating movement of the wake from the perspective of the downstream fin, but did lower the vorticity of the wake as it reached the downstream fin.
Importantly, PIV enabled a visualization of the upstream fin's bending as the wake was released from the fin's tip. The more compliant fins, naturally, bent more as they moved through the fin beat (figure 9(B)). This caused there to be more of a positional difference between the compliant fins' base and tip, than for the stiffer fins. Thus, even if the downstream fin engaged with a wake that did not change significantly with fin compliance, the measured phase difference between the bases of the upstream and downstream fins was larger for the compliant fins than for the stiffer fins when there was a similar engagement of the fin with the wake flow.
4. Discussion
The results from this study confirm that the horizontal and vertical spacing of paired, compliant fins have significant impacts on the propulsive forces that can be produced by interacting fins. This impact must be considered when designing underwater systems so that there is access to a large range of propulsive forces, and so that the balance between lateral and thrust forces can be tuned to generate effective locomotion and maneuvering. Although it is generally possible to access the forces from fins operating individually, it is much more advantageous to design a system so that fin-fin interactions occur, are beneficial, and can be exploited.
For all three of the experimental systems–two robotic and one numerical–the maximum mean net thrust (MaxTHR), the minimum RMS lateral force (MinLAT), and the ranges of forces ( R THR, R LAT) that could be achieved by modulating the fins' phase difference varied considerably as the separation between fins was changed (figures 5, 6 and 8). For the PDAC system, for example, MaxTHR varied between approximately 60 and 90 mN as the horizontal separation was increased 80 mm, a distance less than one fin length (figure 6(A)). The range of net thrust ( R THR) that could be produced by modulating the fins' phase also varied greatly over this distance, between a minimum of 20 mN and a maximum of nearly 50 mN, more than doubling. The propulsive forces varied by similar amounts when the vertical separation between fins was increased. Relatively large net thrust forces are produced when the fins are spaced closest together. As the vertical and horizontal fin separation increased, maximum net thrust and the range of net thrust that could be achieved increased, to a point, and then decreased. This effect occurred with increases of both the horizontal and vertical separation, with a more apparent pattern being observed for the horizontal separation, where there were more trials and at smaller increments. It was observed in all systems that fins starting at the closest horizontal fin spacing ( d ) and increasing, MaxTHR and R THR are both were initially relatively small, increased to a peak value and then decreased as the fins moved further apart. There appeared to be a similar trend for vertical spacing ( h ), an initial increase and then decrease in both MaxTHR and R THR, as the vertical fin spacing ( h ) is increased. When the fins were very close together, maximum forces were relatively low, with forces increasing as the fin separation was increased either in the horizontal or vertical direction (figure 8(A)). Forces then decreased again as 2D separation between the fins continued to increase. The distinct vertical and horizontal fin spacings where the peaks of MaxTHR and RTHR were found may correspond to the radius of a 2D arc at which the downstream fin should be located relative to the upstream fin such that MaxTHR and R THR are maximized. Similar experiments across a wider range and higher resolution of 2-dimensional fin spacings are needed to confirm if this is the case.
In addition to altering the magnitudes of the net thrust and lateral forces, the separation between fins changed the phase differences at which the maximum mean net thrust, and the minimum RMS lateral force were produced (figures 5 and 8). This condition is desirable because it helps maximize forward acceleration and speed and simultaneously minimize the lateral body oscillations that occur with each fin beat. The phase difference at which MaxTHR was produced increased nearly linearly with distance (figure 6(B)). For the PDAC, the phase difference changed by 1.24 °/mm, from 130 o when the fins were 48 mm apart to 230° when the fins were 128 mm apart. The change in phase difference was even greater for the numerical simulation, for which phase increased at a rate of 1.64 °/mm. The phase difference at which the minimum RMS lateral forces occurred changed with fin separation, too, but less, and less consistently than the phase difference for net thrust. For the PDAC, the phase difference for the minimum RMS lateral force remained between 180° and 200°, while the phase for the HVAC was nearly constant at 170°. Phase changed most for the numerical simulation (figure 6(D)), but the rate of change for the lateral phase (0.7 °/mm) was still much smaller than for the net thrust phase (1.64 °/mm).
Changes to fin spacing affected the relationship between phase and net thrust differently than the relationship between phase and lateral forces; revealing that fin spacing might be an effective means to adjust the balance of net thrust and lateral forces produced by fins with a certain phasing. As shown using all three systems, when the fins were spaced closely, maximum net thrust was accompanied by an RMS lateral force that was relatively high (figures 5 and 8). When the spacing between fins was increased, either horizontally or vertically, peak net thrust could be moved to occur near the phase at which the RMS lateral forces were minimal-a better force balance for smooth, rectilinear swimming. It was also the case that as the separation was increased to this distance, a wider range of forces could be achieved by adjusting phase. This means that acceleration and swimming speeds can be modulated by tuning phase, just as they can by adjusting flapping frequency. Thus, defining the appropriate fin spacing is paramount to optimizing the magnitude and quality of forces available to propel an underwater fish-based system.
Underpinning the changes to the propulsive forces and their relationship to fin phase, were changes in how the downstream fin engaged with the wake shed by the upstream fin. Peak forces consistently occurred when the downstream fin was well-aligned with upstream fin's wake; with the leading-edge of the downstream fin maintaining a low AoA–generally less than 25 degrees-with minimal flow separation throughout most of the fin beat. When net thrust was high, fluid at the leading edge of the downstream fin smoothly transitioned from the space between the fins to the surface of the fin before being accelerated by the downstream fin's flapping. These flow characteristics were observed at all peaks of the thrust-phase curves regardless of the phase at which the peak occurred (figures 7(A) and (B)). Although the structure of the wake shed by the upstream fin did not change visibly as the vertical and horizontal spacing was increased, the time required for a component of the wake to reach the downstream fin increased, and the wake's vorticity decreased (figure 7(C)). The greater transit time translated into needing a greater phase difference between fins to create similarly good angles of attack throughout most of the fin beat. Additionally, the lower vorticity altered the energy and local speed of the wake as it interacted with the downstream fin. Although the flow's vorticity, and the engagement of the downstream fin with vortices, have been identified as critical to enhancing thrust, it is clear from these data that force enhancement is affected by factors in addition to vortex strength.
The angle that the upstream fin's wake is shed relative to the horizontal plane may help explain why net thrust reached a maximum, in both magnitude and range, at a moderate distance and then decreased with further separation, rather than peaking when fins were closest together and the vorticity at its strongest. As illustrated in Esposito et al [30], the wake shed by a median fin does not necessarily travel in-line with the free stream flow, horizontally in these experiments. Due to the dorsal-ventral curvature of a compliant fin as it is flapped, the wake may be directed upwards or downwards. It has been hypothesized that the dorsal/anal fins and finlets may have a beneficial impact on force production by conditioning flow and directing it toward the caudal fin [22, 34]. This may contribute to the fins interacting most effectively when they were not aligned too closely horizontally but were offset so that the leading edges and lobes of the downstream fin engage with the 2D undulatory wake.
In addition to fin spacing, fin compliance can be used to modulate the relationship between fin phases and propulsive forces. While fin spacing influenced the timing and intensity of the downstream fin's interaction with the wake, the compliance of the fin affected the manner in which the upstream fin shed the wake. Along with the expected reduction in the magnitude and range of forces that were created by the paired fins, increasing compliance by 30% increased the phase difference at which the maximum net thrust occurred by as much as 80° (figure 9). It is believed that the increase in the net thrust's phase difference was due largely to the additional bending of the upstream fin, as opposed to how the wake travelled the gap between fins. The PIV analysis did not show clear differences in the wake structures created by the two sets of fins, despite there being a significant difference in force production at all phases. It was, however, clear that when the trailing edges of the upstream fin passed the midline of the fin beat, the base of the more compliant fin was rotated further than for the stiffer fin. This additional rotation resulted in there being greater phase difference between the driven motions of the compliant fins than for the stiffer fins. In this way, fin compliance directly affects the timing and intensity of vortex shedding and wake production at the trailing edge of the fin, subsequently impacting the wake interaction with a downstream fin. It is reasonable to expect that the additional bending of the downstream fin would alter the angle of its leading edge, but this was not clearly visible in our study, as most of the fin's bending occurred closer to the trailing edge. Although the results of our experiments were presented from the perspective of reducing compliance, it may be useful to stiffen a fin to increase the overall force production and to reduce the phase at which maximum net thrust occurs.
Further investigations of the impact of each of these factors on forces, and particularly the extent to which they are coupled, will further clarify how to best design fin-based robotic systems. Additionally, the flows observed in this study are only a 2D slice of the entire fluidic interaction that occurs between the fins. In 3D, the wake shed by the fins includes a series of alternating, connected vortex rings [26, 32]. Accounting for the interaction of this complex 3D wake with the downstream fin, may necessitate a shape of the fin that brings the leading edge into alignment with the wake in 3D. Perhaps a fin with an angled leading edge allows for the downstream fin to remain well-aligned with the oncoming flow as it travels downstream. It is also unclear if the trends observed in this study can be generalized to include cases with more than two fins. It is possible that more fins with the wake flow passing along them in series would result in a compounded effect on propulsive forces. Understanding the interdependency and trade-offs when choosing different combinations of fin phasing, spacing and compliance is critical when designing and controlling finned robotic systems if they are to effectively use multiple fins to swim and maneuver underwater.
5. Conclusions
Studies conducted with robotic fish-like propulsive platforms and numerical models clearly demonstrated that the propulsive forces created by pairs of fins that interact through wake flows are highly dependent on the fins' spacing and compliance. Changes to fin separation of less than one fin length had a dramatic effect on forces, and on the phase at which the desired forces would occur. Although 'good' propulsive thrust could almost always be produced by the experimental systems by tuning the phase difference between fins, thrust would not always be paired with a desired lateral force. However, by adjusting fin spacing and compliance, desirable thrust and lateral force could be made to occur at the same phase difference. Effectively incorporating these findings when designing multi-finned swimming robots would substantially enhance the robot's ability to manipulate and tune propulsive forces. Well-designed, interacting fins can potentially produce several times more propulsive force than a poorly tuned robot with seemingly small differences in the kinematic, geometric and mechanical properties.
Acknowledgments
The authors would like to thank the members of the Lauder Lab at Harvard University for the use of their laboratory facilities and help while conducting robotic experiments. The authors are grateful to Tom McKenna for his continued support and guidance. The authors would also like to thank the COMSOL technical support for their help in model development.
Data availability statement
The data cannot be made publicly available upon publication because they are not available in a format that is sufficiently accessible or reusable by other researchers. The data that support the findings of this study are available upon reasonable request from the authors.
Funding
Office of Naval Research (Tom McKenna, Program Manager, ONR 341), Grant Number N00014-21-S-B001.