


Abstract
Percolation transition in networks as edges are gradually added, can generate a variety of critical and supercritical behaviors. Here we report a percolation transition model with two parameters α and β, in which by decreasing the value of α from 1 to 0 the phase transition could change from continuous to multiple discontinuous and finally to discontinuous without supercritical region, and that the corresponding tricritical points could be tuned by changing the value of β. In order to find out the tricritical point from continuous to multiple discontinuous, by investigating the cluster merging dynamics we find that it belongs to an interval and becomes larger with increasing value of β, and this result is verified by the distinctly different relative variance behaviors of the order parameter at the two endpoints of the interval. On the other hand, the tricritical point from multiple discontinuous to discontinuous is β/(1 + β), which also becomes larger when increasing the value of β. Our results might be helpful in controlling the width of phase transition region in random networks.
Export citation and abstract BibTeX RIS
1. Introduction
Percolation serves as a typical paradigm in statistical physics and probability theory, due to its wide applications in a large variety of natural and technological and social systems [1–12]. As one of the most classical percolation models, the Erdös–Rényi (ER) random graph undergoes a continuous phase transition at the critical point 0.5 in the thermodynamical limit [13]. In 2009, a seemingly discontinuous percolation transition, called explosive percolation [14], is found in an edge competitive percolation process where two candidate edges are considered and only the edge connecting two clusters with smaller product of their sizes is added. Inspired by this work, to achieve explosive percolation phenomena, various competitive percolation models [15–26] are proposed, as well as some weighted rules [27–36] choosing occupied edge according to a certain probability are introduced. Later, Riordan and Warnke [37] mathematically showed that any rule with fixed number of random vertices leads to a continuous phase transition in the thermodynamical limit, and that discontinuous phase transition indeed can occur if the number of the competitive edges grows with the system size.
Rather than minimize the size of the largest cluster, Nagler et al considered a three-vertex rule [38], where the edge connecting two clusters with most similar sizes is added. The percolation process of this rule exhibits a continuous phase transition at the first critical point but infinitely many discontinuous jumps follow in the right neighbourhood of the first critical point. Schröder et al generalized the above model with a tunable parameter, by tuning which the percolation process can exhibit infinitely discontinuous jumps in the supercritical region and is called fractional percolation [39]. Moreover, the percolation process is non-self-averaging [38–41], which is characterized by nonzero relative variance of the order parameter in the supercritical region. Non-self-averaging phenomena in network percolation, refers to that in the thermodynamical limit the order parameter does not converge to a well defined function of the occupied edge density and instead exhibits large fluctuations from one realization to another in the supercritical region, is also reported in three-vertex rule [38], Nagler–Gutch (NG) model [40], the modified ER (mER) model [40] and multiple-time-scale aggregation model [34]. Although anomalous critical [42–45] and supercritical [38–41] properties are found in network percolation, a comprehensive understanding for these behaviors should be further investigated.
In analysis of random networks with explosive percolation, Friedman and Landsberg [16] proposed a concept of powder keg which is a collection of sublinear clusters containing cN (c is a constant and N is the system size) nodes. If the clusters in powder keg have high probability of being chosen, the percolation process will produce a giant cluster with linear size. From this thought, a nonlinear weighted function percolation model was proposed, in which the chosen probability of the clusters with sizes on the interval [Nα, N] (α is a tunable parameter) can be tuned and the resulting phase transition can change from continuous to multiple discontinuous to discontinuous [27]. Inspired by this work, based on a piecewise function with two parameters α and β we study a percolation model. When decreasing the value of α from 1 to 0, similar to the model [27], the phase transition type also can change from continuous to multiple discontinuous and finally to discontinuous without supercritical region. But distinctly different from the work [27] where the two tricritical points (from continuous to multiple discontinuous as well as from multiple discontinuous to discontinuous) of α are not tunable, in this paper the two tricritical points of α can be tuned by changing the value of β and finally we obtain how two tricritical points of α depend on β, which provides insights into controlling the width of phase transition region in random networks.
2. Model
The percolation model starts an empty graph with N isolated nodes. At each time step an edge is added until the graph becomes connected, and the intracluster edges are excluded in the adding-edges process. To add an edge, two nodes are sequentially selected and they belong to two different clusters. Let i-node cluster denote the cluster of size of i, and the number of i-node clusters is recorded as ni. Thus the selected probability of the node residing in i-node cluster can be expressed as nif(i)/∑i nif(i), in which f(i) is the weighted function that reflects the impact of the cluster sizes. Here f(i) is denoted as
where α is a continuously tunable parameter on the interval [0, 1] and β is another parameter with value larger than zero. As seen in equation (1), f(i) has a rising edge on the interval [1, Nα] (a falling edge on the interval [Nα, N]), and the exponent β controls the falling extent of f(i) on the interval [Nα, N]. By changing the value of α and β, the model can tune the selected probability of the clusters with sizes on the interval [Nα, N], which will impact on the percolation phase transition type. In the percolation process the occupied edge density t is defined as L/N (L is the number of the occupied edges), and the order parameter c1 is denoted as C1/N where C1 indicates the size of the largest cluster in the graph.
3. Results and analysis
When α = 1, the percolation model becomes the ER random graph with a continuous phase transition [29]. In order to investigate the impact of α and β on the percolation transitions, the evolution of the order parameter with different α is presented in figure 1 for β = 0.5, β = 1 and β = 2. In figures 1(a)–(c), as the value of α decreases from 1 to 0, the percolation transitions can change from continuous to multiple discontinuous and finally to discontinuous without supercritical region. The difference is the range of the tricritical points (from continuous to multiple discontinuous as well as from multiple discontinuous to discontinuous), which will be discussed in detail later. In figure 1(a) with β = 0.5, the percolation phase transition with α = 0.7 is fact continuous in the thermodynamical limit though with discrete jumps in the supercritical region with N = 220, and the phase transition with α = 0.65 is multiple discontinuous even in the thermodynamical limit. Similar phenomena is also found in figure 1(b) with β = 1 (continuous phase transition at α = 0.75 and multiple discontinuous phase transition at α = 0.7) and figure 1(c) with β = 2 (continuous phase transition at α = 0.8 and multiple discontinuous phase transition at α = 0.75).
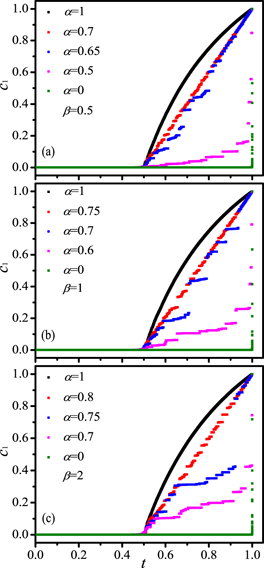
Figure 1. Typical evolution of the order parameter c1 with different values of α, for β = 0.5 (a), β = 1 (b) and β = 2 (c), respectively. When decreasing the value of α from 1 to 0 in (a)–(c), the percolation phase transition can evolve form continuous to multiple discontinuous, and finally a first order phase transition is exhibited at the very end of the adding-edges process. The system size is fixed at N = 220.
Download figure:
Standard image High-resolution imageIn the following, we show that for α = 0 the phase transition is discontinuous without supercritical region. According to equation (1), f(i) = 1/iβ, and thus the occupied weight of i-node clusters is ni/iβ. When a i-node cluster merges with a j-node cluster at each time step, one can get the following property: if j > k1/βi (k is a constant number with value larger than one), ni/iβ > nj/jβ by assuming nj = kni. It means that the clusters with small sizes are preferentially selected in the percolation process. As the occupied edge density t grows from zero, the clusters size heterogeneity [46] (the number of distinct cluster sizes) becomes large until the lower pseudotransition point, when the clusters size heterogeneity obtains maximum. Starting from the lower pseudotransition point, the clusters asymptotically merge according to the sizes from small to large, which means that the percolation process generates a first order phase transition at the very end of the adding-edges process. Figure 2 plots the cluster size distribution at the lower pseudotransition point for β = 0.5, β = 1 and β = 2. As seen in figure 2, the cluster size does not display power law distribution, indicating discontinuous phase transitions.
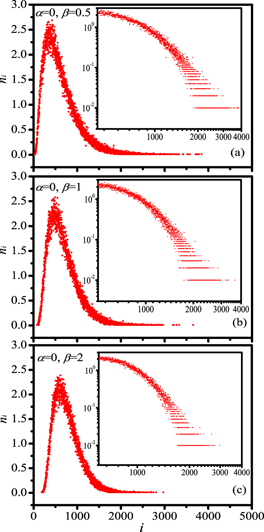
Figure 2. For α = 0 the cluster size distribution at the lower pseudotransition point with β = 0.5 (a), β = 1 (b) and β = 2 (c), respectively. All of them do not meet power law behaviour, indicating discontinuous phase transitions. The system size is fixed at N = 220 and each data point is an average of over 100 realizations.
Download figure:
Standard image High-resolution imageWith regard to how the phase transition type switches from continuous to multiple discontinuous with different values of β, we focus on the clusters merging dynamics. Every time one edge is added at each time step, two different clusters merge together. According to equation (1), the sizes of two selected clusters have the following three cases: (i) both sizes are not larger than Nα. (ii) Both sizes are larger than Nα. (iii) One of the sizes is not larger than Nα, and the other is larger than Nα. Among the three cases, only case (ii) can induce jump of the order parameter in the thermodynamical limit. The relation between case (ii) and the corresponding occupied edge density t describes clusters merging dynamic (with sizes larger than Nα), which may indicate the genuine discontinuities of the order parameter in the thermodynamical limit. Figure 3 depicts the clusters merging dynamics (with sizes larger than Nα). In figures 3(a), (c) and (e), with the increase of the value of t the larger one of two selected clusters sizes (red solid squares) has distinct declining moments when it stops growing and another large cluster starts to grow. At later certain occupied edge density t they necessarily merge together, which induces genuine gaps of the order parameter and thus multiple discontinuous phase transitions. Whereas in figures 3(b), (d) and (f), the larger one of two selected clusters sizes (red solid squares) becomes larger and larger when the value of t increases, which means the largest cluster continuously absorbs the remaining small clusters including clusters with sizes larger than Nα and thus the phase transitions are continuous. From the clusters merging dynamics (with sizes larger than Nα) in figure 3, it indicates that for β = 0.5 and β = 1 and β = 2 the tricritical points from multiple discontinuous to continuous lie in the intervals (0.65, 0.7), (0.7, 0.75) and (0.75, 0.8), respectively.
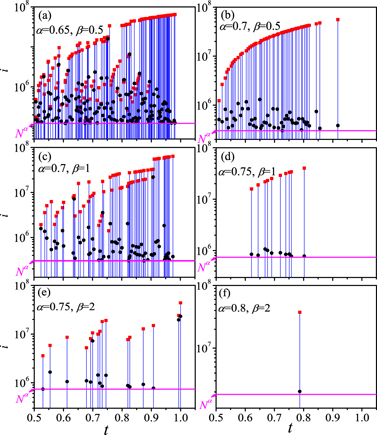
Figure 3. Clusters merging dynamics (with sizes larger than Nα) in the percolation process with different values of β and α. The red solid squares and black solid circles indicate the larger and smaller size of two chosen clusters (with sizes larger than Nα) respectively, and the blue lines represent the merging moments corresponding to the above two chosen clusters. The magenta line indicates the cluster sizes (equal to Nα). Panels (a), (c) and (e) show that the phase transitions are multiple discontinuous. Panels (b), (d) and (f) indicate that the phase transitions are continuous. The system size is fixed at N = 226 and a single realization is shown for each percolation process.
Download figure:
Standard image High-resolution imageTo verify the range of tricritical points from multiple discontinuous to continuous with different values of β, we further investigate the relative variance of the order parameter, which is defined as

where the brackets denote ensemble averaging. Figure 4 plots the relative variance Rv of the order parameter as a function of the occupied edge density t. With enhancing system size in figure 4(a) (α = 0.65 and β = 0.5), Rv is converging to zero at the end of the occupied edge density t, but asymptotically becomes larger on an extended supercritical region. In figure 4(c) (α = 0.7 and β = 1), Rv becomes larger almost on the whole supercritical region when the system size increases. In figure 4(e) (α = 0.75 and β = 2), there exists a supercritical region where Rv becomes larger with increasing system size. From figures 4(a), (c) and (e), it shows that the corresponding systems are non-self-averaging characterized by non-vanishing relative variance Rv of the order parameter on a certain supercritical region. Nevertheless when the value of α increases 0.05 in figures 4(a), (c) and (e), non-self-averaging switches to self-averaging because increasing the system size makes Rv rapidly converge to zero in the supercritical region, as presented in figures 4(b), (d) and (f). For continuous phase transition, large fluctuations of the relative variance Rv are only observed in the critical window, and collapsed into a singular peak at the critical point in the thermodynamical limit [9, 12]. Therefore the supercritical behaviors in figure 4 also show that the tricritical point from multiple discontinuous to continuous lies in the interval (0.65, 0.7) with β = 0.5, (0.7, 0.75) with β = 1 and (0.75, 0.8) with β = 2, respectively.
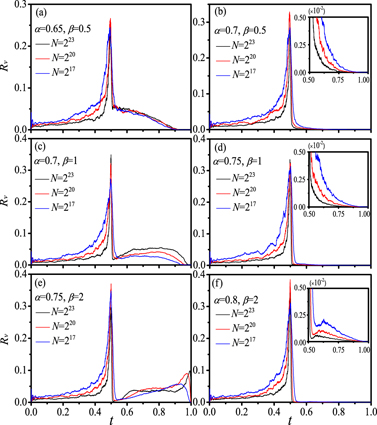
Figure 4. Relative variance Rv of the order parameter in dependence on the occupied edge density t. For (a), (c) and (e), there clearly exists a supercritical region where Rv is not equal to zero even in the thermodynamical limit, indicating multiple discontinuous phase transitions. While for (b), (d) and (f), increasing the system size makes Rv rapidly converge to zero in the supercritical region, implying continuous phase transitions. Therefore for the phase transitions from multiple discontinuous to continuous with β = 0.5, β = 1 and β = 2, panels (a)–(f) indicate that the tricritical point lies in the intervals (0.65, 0.7), (0.7, 0.75) and (0.75, 0.8), respectively. The processes for (a)–(f) are an ensemble of 500 realizations.
Download figure:
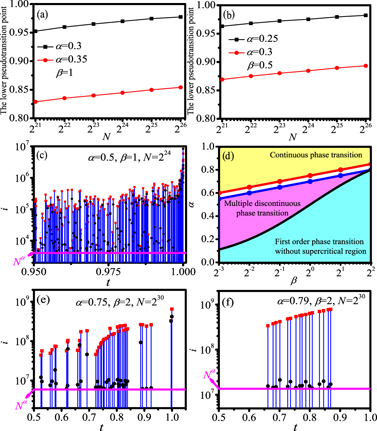
Standard image High-resolution imageFrom equation (1), f(i) has a rising edge in the interval [1, Nα] and a falling edge in the interval [Nα, N], and it is easy to obtain that f(1) = f(Nα(1+β)/β). Therefore if Nα(1+β)/β < N (i.e., α < β/(1 + β)), the selected probability of the cluster (with size in the interval [1, Nα(1+β)/β]) is larger than that of cluster with size in the interval (Nα(1+β)/β, N). Notice that the order parameter c1 is zero below the critical point and becomes a nonzero number after the critical point in the limit N → ∞ [46]. So if α < β/(1 + β), Nα(1+β)/β is sublinear to N, and thus all the clusters (with sizes in the interval [1, Nα(1+β)/β]) vanish before the critical point. When all the clusters sizes are larger than Nα(1+β)/β, the clusters asymptotically merge according to the sizes from small to large because f(i) > f(j) if j > i > Nα(1+β)/β. Thus for α < β/(1 + β) the percolation process leads to a first order phase transition at the very end of the adding-edges process. In the above argument, Nα(1+β)/β is required to be sublinear to N, which means that Nα(1+β)/β ≪ N in the limit N → ∞. As an example with β = 1, we have N2α ≪ N. Assuming that N2α ∼ γN (γ is a positive number approximating to zero), one can obtain that N ∼ γ1/(2α−1). For α = 0.45 and α = 0.4 (γ = 0.001), the respective system size N is the order of 1030 and 1015, which is far beyond our numerical computation ability. Moreover, the corresponding system size becomes larger if α is slightly less than 0.5 (β = 1), which signifies that it is very hard to ascertain the phase transition type by resorting to numerical method. In order to indicate the discontinuity of the phase transition without supercritical region for different pairs of (α, β) near α = β/(1 + β), figures 5(a) and (b) present the relation between the lower pseudotransition points and the system size N. In figure 5(a) with β = 1, the value (slightly less than 0.5) of α is not considered because the needed system size is far beyond our numerical computation ability to make the lower pseudotransition point be close to 1. As seen in figures 5(a) and (b), it is clear that the lower pseudotransition points would increase towards 1 when the system size becomes large, implying discontinuous phase transition without supercritical region.
Figure 5. (a) and (b) The lower pseudotransition points are plotted as a function of the system size N with different pairs of (α, β) near α = β/(1 + β) and each data point is an average of 50–200 realizations. It is clear that with enlarged system size the lower pseudotransition points are increasing towards 1 implying discontinuous phase transition without supercritical region. (c) Same plot as figure 3 but for β = 1 and α = 0.5, indicating multiple discontinuous phase transition. (d) Phase diagram of α versus β. In the cyan region the percolation process leads to a first order phase transition without supercritical region. In the magenta region and the yellow region, the phase transition is multiple discontinuous and continuous, respectively. The blank region (between the magenta and yellow regions) indicates the transition region where the phase transition changes from multiple discontinuous to continuous. (e) Same as figure 3(e) but for N = 230. (f) Same as (e) for β = 2 and α = 0.79.
Download figure:
Standard image High-resolution image
For α = β/(1 + β), based on equation (1) one can get f(γN) = f(1/γβ) where γ is a constant on the interval (0, 1), and thus the selected probability of the cluster (with size in the interval (1/γβ, γN)) is larger than that of other clusters. When the largest cluster with linear size γN generates in the supercritical region, it stops growing and then the clusters (with sizes in the interval (1/γβ, γN)) merge into a new cluster with linear size at a certain occupied edge density. At the following another occupied edge density, the above two macroscopic clusters merge together inducing a multiple discontinuous phase transition. As an example with β = 1 and α = 0.5, in figure 5(c) we depict the cluster merging dynamics (with sizes larger than N) over the occupied edge density from 0.95 to 1. It is clear that the growth of the larger one of two selected clusters sizes (red solid squares) has similar characteristic of figures 3(a), (c) and (e), indicating multiple discontinuous phase transition.
From the phase transition characteristic of α < β/(1 + β) and α = β/(1 + β), it shows that the tricritical point of α is β/(1 + β) for the phase transition from multiple discontinuous to discontinuous without supercritical region. In order to investigate the impact of β (with value in a wide range) on the tricritical point of α from continuous to multiple discontinuous, similar to figure 3, the transition region of α with more values of β is estimated by the clusters merging dynamics (with sizes larger than Nα), which is presented in figure 5(d). At the same time, figure 5(d) also gives the tricritical line for the phase transition from multiple discontinuous to discontinuous without supercritical region, and thus it depicts the phase diagram of α versus β. From figure 5(d) increasing the value of β makes two tricritical points (from continuous to multiple discontinuous as well as from multiple discontinuous to discontinuous) become large, which provides help for controlling the width of phase transition regions in random networks.
As for the size of the transition region (the blank region in figure 5(d)) from multiple discontinuous to continuous, similar to the boundary between regions for multiple discontinuous phase transition and discontinuous phase transition without supercritical region, in the limit N → ∞ it also will become a tricritical line. Due to randomness and finite size effect, finding a clear numerical criterion which can distinguish multiple discontinuous and continuous in a narrow interval is very hard, and instead we give a transition region (the blank region in figure 5(d)) with width 0.05. In order to analyze the impact of system size, as an example with β = 2 and α = 0.75, same plot as figure 3(e) for enlarged system size N = 230 is presented in figure 5(e), which indicates that increasing the system size makes the graph become dense and the conclusion of multiple discontinuous phase transition is not changed with increasing system size. In addition, from figures 3(b) to (d) to (f), the graph becomes more and more sparse and especially in figure 3(f) there is only one times mergence of the clusters with sizes larger than Nα, which means that the value of α in figure 3(f) with α = 0.8 and β = 2 can be further reduced and the resulting phase transition type remains to be continuous. In figure 5(f) (the same plot as figure 3(f) with the same β), the value of α is reduced to 0.79 and the system size is increased to N = 230, and we can see that the growth of the larger one of two selected clusters sizes (red solid squares) has similar characteristic of figure 3(d) indicating continuous phase transition. Therefore the transition region width will become narrower with increasing value of β.
4. Conclusion
In conclusion, a percolation model with two parameters α and β is presented. Similar to the work [27], as the value of α is tuned from 1 to 0, the phase transition can change from continuous to multiple discontinuous and finally to discontinuous without supercritical region. But distinctly different from the work [27] where the two tricritical points (from continuous to multiple discontinuous as well as from multiple discontinuous to discontinuous) are not tunable, in this work the two tricritical points of α can be tuned when changing the value of β. In order to study how the phase transition changes from continuous to multiple discontinuous, the clusters merging dynamics (with sizes larger than Nα) are investigated with β = 0.5 and β = 1 and β = 2, which indicates that the tricritical point from multiple discontinuous to continuous lies in the intervals (0.65, 0.7), (0.7, 0.75) and (0.75, 0.8), respectively. This result is further verified by the distinctly different relative variance behaviors of the order parameter at the two endpoints of the interval, where at the left endpoint the relative variance Rv of the order parameter is larger than zero on a certain supercritical region even in the thermodynamical limit and at the right endpoint Rv is rapidly converging to zero in the supercritical region with increasing system size. On the other hand, by analyzing the selected probabilities of the clusters at α < β/(1 + β) and α = β/(1 + β), it shows that the tricritical point of α is β/(1 + β) for the phase transition from multiple discontinuous to discontinuous without supercritical region. Finally, we plot the phase diagram of α versus β in a wide range, which indicates that two tricritical points become larger with increasing value of β and thus controlling the width of phase transition regions becomes possible.
Acknowledgments
This work was supported by the National Natural Science Foundation of China under Grant Nos. 61703292 and 11847035, and the Education Department of Sichuan Province under Grant No. 18ZB0483.