


Abstract
In high-β scenarios with on-axis co-current electron cyclotron current drive, which normally lowers q0 below unity, the absence of sawteeth suggests the involvement of an additional current redistribution mechanism beyond neoclassical current diffusion. This is supported by imaging motional Stark effect diagnostic measurements, which indicate that q0 remains consistently around 1. This phenomenon is observed in the presence of a 1/1 mode, indicating its potential role in the current redistribution. It is shown that the mode's ability to modify the central current and suppress sawteeth increases with plasma pressure. These findings align with a recent theoretical model, which predicts a pressure threshold for sawtooth avoidance by a 1/1 quasi-interchange mode and where this threshold increases with the strength of inward current diffusion. Moreover, the advantages of the flux pumping scenario for future machines are highlighted.
Export citation and abstract BibTeX RIS

Original content from this work may be used under the terms of the Creative Commons Attribution 4.0 license. Any further distribution of this work must maintain attribution to the author(s) and the title of the work, journal citation and DOI.
1. Introduction
High performance advanced tokamak scenarios are very attractive as future burning plasmas. They can be achieved by manipulating the central q-profile, for instance raising it to, or even above, unity in order to avoid the sawtooth instability, which would otherwise reduce performance and could trigger other deleterious instabilities [1, 2]. High-β plasmas can develop such a flat elevated central q-profile in the presence of magnetohydrodynamic (MHD) modes that modify the current profile [3–5]. The self-regulating mechanisms leading to this anomalous evolution of magnetic flux can be referred to by the general term 'magnetic flux pumping.' This mechanism is potentially important for future non-inductive tokamaks, as it could provide a way to redistribute the current driven by Electron Cyclotron Current Drive (ECCD), which is most efficient in the plasma center [6]. This higher efficiency can be attributed to ECCD being roughly proportional to  , with the temperature typically being more peaked than the density. Additional effects include the Ohkawa drive [7], which acts in opposite direction compared to the Fish–Boozer drive [8], only playing a minor role in the center due to the small amount of trapped particles. It was shown that the β-limit and the energy confinement can be increased by increasing the internal inductance, or central current peaking [9–14]. Ideally, a flux pumping mechanism would redistribute some of the current off-axis, helping to maintain a flat central q-profile around unity and maximizing both the current drive efficiency and plasma stability at high β by generating a current profile that is as peaked as possible, while still avoiding sawteeth.
At DIII-D, flux pumping was observed in the presence of a 3/2 tearing mode, as well as when inducing a 1/1 helical core via external perturbation coils [15]. Such experiments inducing a helical core via external coils have also successfully been performed at ASDEX Upgrade (AUG) [16, 17]. A clamped q-profile around unity and the suppression of sawteeth were also observed at AUG at high β in the presence of 1/1 activity like fishbones [18–21]. It was postulated that fishbones could be responsible for maintaining a stationary current profile through a magnetic reconnection process [22]. Similarity experiments to the AUG discharges were performed at JET. However, despite the successful reproduction of several aspects, the experiments at JET did not achieve sawtooth suppression [23]. Similar phenomena to the AUG sawtooth suppression in the presence of fishbones have been observed at MAST in connection with the n = 1 'long-lived mode' [24] and with a 1/1 mode at EAST [25].
Based on recent advancements in theoretical modeling using nonlinear MHD simulations conducted with the M3D-C1 code [26], a theoretical model indicates the possibility of flux pumping in the presence of a saturated (m = 1, n = 1) quasi-interchange mode [27, 28]. If a flat central q-profile initially above one drops closer to unity, a 1/1 interchange mode can become unstable, forming a helical flow pattern in the plasma core. The generated helical perturbations of the mode velocity field and the magnetic field interact via the dynamo effect to generate an effective toroidal electric field. This field is negative in the plasma center and reverses sign off-axis. This prevents the central current density from peaking and thereby prevents the core q-profile to fall below one. Since the 1/1 instability is weakened if the q-profile rises significantly above one, the flux pumping mechanism is self-regulating such that the core q-profile is clamped to values close to unity. The simulations, performed in generic tokamak geometry, suggest that the strength of the flux pumping mechanism depends on the core pressure. This dependency stems from the pressure-driven nature of the 1/1 quasi-interchange mode. This observation provides means by which the simulations can be tested. In experiments, the central loop voltage required to keep q0 at unity depends on the internal and external parameters that lead to central current peaking, for instance externally induced current drive. A schematic representation of the experiments can be seen in figure 1. Initially, a sawtoothing scenario characterized by a significantly radially extended continuous 1/1 mode is established. Increasing the Neutral Beam Injection (NBI) power augments the plasma β, hypothetically providing additional energy to the mode for redistributing the central current, thereby keeping q0 around unity and suppressing sawteeth. Subsequently, ECCD is progressively increased until the driven current surpasses the dynamo loop voltage's capability for redistributing the current. This causes q0 to drop below unity, leading to the reappearance of sawteeth. When further elevating β, the corresponding increase in the dynamo loop voltage and q0, once again leads to the disappearance of sawteeth. Through systematic exploration of the flux pumping parameter space in this manner, the agreement with simulations can be assessed.
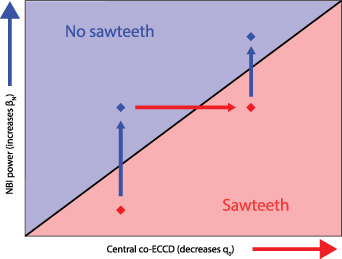
Figure 1. Schematic representation of the experimental method to scan the flux pumping parameter space.
Download figure:
Standard image High-resolution image2. Experimental results
With the combination of the Imaging Motional Stark Effect diagnostic (IMSE) [29] at AUG and the IDE equilibrium solver [30, 31], changes in q as small as 0.1 are measurable, even in the plasma center. Together with the current drive capabilities of the upgraded Electron Cyclotron Resonance Heating (ECRH) systems [32], AUG constitutes the ideal device to perform experiments that test the flux-pumping predictions.
To this end, a high confinement plasma scenario with a flat central q around unity was developed such that a strong 1/1 mode forms. This scenario forms the base for all discharges presented in this work. The experiments were all performed in 800 kA, −2.5 T to −2.65 T, lower single null, deuterium plasmas heated with a combination of NBI and ECRH. The plasma shape and ECRH deposition, calculated by the TORBEAM [33] module in IDE, in one of the analyzed discharges is shown in figure 2. The time evolution of this experiment is shown in figure 3. Here, the NBI was feed-forward programmed to increase the plasma βN during the discharge. This should act to increase the flux pumping effect generated by the 1/1 mode activity, thereby preventing sawtooth instabilities as q0 is raised toward unity. Later, positive central ECCD was applied in several steps to attempt to decrease q0 and trigger sawteeth. Note that, unlike in the DIII-D plasmas that exhibit a flux pumping effect, no 3/2 mode is observed in any of the phases described in this work. Some of the higher βN discharges discussed feature deleterious ideal 3/2 modes at later time points, strongly reducing the performance and effectively ending the discharge. The data from those time intervals were not used in this analysis.
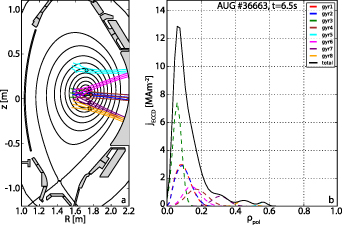
Figure 2. Shape and ECCD deposition of a typical discharge described in this analysis.
Download figure:
Standard image High-resolution image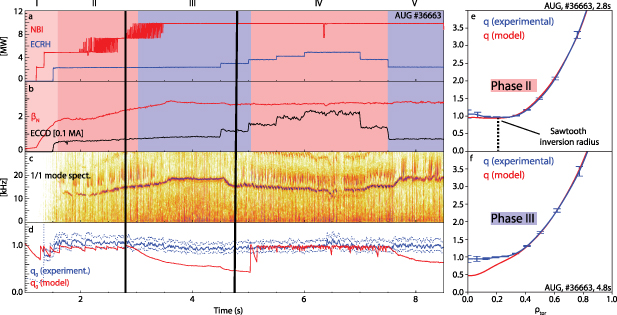
Figure 3. Time traces of the NBI and ECRH heating power, βN , ECCD driven current, 1/1 mode activity and modeled (red, without flux pumping) and experimental (blue) q0 as well as the q-profiles at the times marked by vertical lines in phases II and III. The dashed lines above and below the experimental q0 trace in panel (d) indicate the uncertainty bands. The red shading indicates sawtoothing phases, the blue shading sawtooth-free phases.
Download figure:
Standard image High-resolution imageIn AUG discharge 36663 (figure 3), five distinct phases can be distinguished. The red shading indicates the presence of sawteeth, the blue shading their absence. Note that this discharge was designed specifically to map out the parameter space introduced in figure 1 and to demonstrate the limits of flux pumping. In other discharges, not shown in detail, but included in figure 6, flux pumping with full sawtooth suppression is observed throughout. In the first phase the q-profile (d) and βN
(b) are still evolving after the current ramp-up and transition to H-mode, and classic sawteeth can be observed. All discharges presented in this work feature sawteeth with three distinct signatures in the measured data, but this variation in signature does not necessarily reflect changes in the sawtooth amplitude. This is expanded on in the
Figure 3(d) shows the modeled q0 in red, generated by IDE, a Grad Shafranov solver coupled with a current diffusion equation solver. In this work, the term current diffusion is used to describe changes in the current density profile due to the temporal diffusion of the poloidal magnetic flux. The IDE solver takes into account external magnetic measurements, kinetic profiles, the bootstrap current, neoclassical current diffusion and a sawtooth current redistribution model when experimental sawtooth times are provided [30, 31]. It was shown that in the absence of anomalous redistribution of magnetic flux, the model is in excellent agreement with experimental measurements [31]. The blue curve in figure 3(d) shows the estimated q0 from the same solver, additionally taking into account local measurements from the IMSE diagnostic. When IMSE data is included, the solver favors the solution in closest agreement with the experimental IMSE angles over the current diffusion model due to the larger weight of the IMSE data compared to that of the neoclassical current diffusion constraint. The case including IMSE data will be referred to as 'experimental q0.' In phase II, the sawtooth current redistribution model in IDE periodically brings the central safety factor to unity, such that the experimental and modeled q0 are in good agreement. However, in phase III without sawteeth, q0 should drop well below unity if no other current redistribution mechanisms were present besides neo-classical current diffusion. The modeled and experimental q-profiles in phases II and III are shown in the right panels of figure 3. The confidence bands are not shown for the modeled q-profiles, as the model does not include flux-pumping physics. The measurements show that the central safety factor stays stable around one, suggesting an anomalous modification of the current profile compared to neoclassical current diffusion. This is consistent with the absence of sawteeth in phase III. The corresponding flux-surface averaged current density profiles are shown in figure 4(a). By subtracting these two profiles, the additional effective toroidal electric field profile necessary to achieve the experimental safety factor, starting from the modeled profile, can be calculated considering the plasma resistivity. This effective electric field, shown in figure 4(b), can be seen as the dynamo electric field generated by the 1/1 mode, which keeps the central q around unity. It is qualitatively similar to the field computed in the flux pumping simulations [28], shown in figure 4(c). In terms of quantitative analysis, the two profiles differ, but this is expected as the simulations were performed using significantly different plasma parameters compared to the experimental conditions, most importantly a notably elevated resistivity.
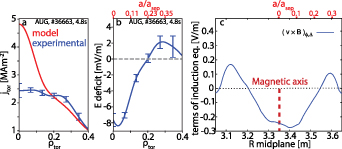
Figure 4. (a) Experimental (blue) and modeled (red) current density, (b) corresponding effective electric field deficit, (c) electric field generated by the 1/1 quasi-interchange mode in one of the flux pumping simulations in [28] (Reprinted from [28], with the permission of AIP Publishing).
Download figure:
Standard image High-resolution imageIn phase IV of figure 3 , the modeled q0 drops slightly below 1 between sawteeth, as a result of the central co-current ECCD, but sporadically increases to unity due to sawteeth. As these small changes are within the error bars of the experimental q0, it remains unclear whether flux pumping still persists in that phase or the small sawteeth alone are responsible for clamping q0 to unity. The continuous 1/1 mode remains through this phase, only periodically interrupted by some of the slightly larger sawteeth.
The experiment was repeated after a further optimization of the ECRH mirror angles to achieve the maximum, positive, on-axis current drive in a very small deposition volume, in order to drive q0 down in the very center. This discharge was immediately followed by one with radially injected ECRH instead of ECCD, to compare the sawtooth behavior, their suppression by flux pumping, and its dependence on strong central current drive under identical machine conditions. While ECRH is already absorbed before reaching the cold resonance location when launching at the large toroidal angle necessary to drive current, with radial injection the absorption is located at the cold resonance. In order to achieve an identical ECRH deposition location in both discharges, BT had to be changed from −2.5 T to −2.65 T in the no-ECCD case, slightly increasing q95 from 5.2 to 5.5. However, at the beginning of the discharges, before the injection of ECRH, the q-profiles are identical inside of the pedestal according to the IMSE based equilibrium reconstruction. In this pair of experiments, the NBI power was feedback controlled to achieve the same βN in both discharges and to keep it constant after the initial ramp, as seen in figure 5(c). The ECCD case is shown in red, the no-current-drive case in blue, and the reference discussed previously in black. The NBI power modulation in figure 5(a) was smoothed out over 25 ms for a better comparison of the heating ramp, and to represent the real power transfer into the plasma. The energy from the beam is not instantaneously transferred to the confined plasma, but rather on the time scale of the slowing down process of the fast beam ions, such that the modulated beam effectively acts as continuous heating at lower power. Because of its unavailability, one off-axis neutral beam had to be exchanged by one with a more radial injection geometry compared to the reference. Therefore, the fast ion distribution and their current drive properties are different. While the RABBIT code is included in the IDE equilibrium solver to provide fast ion profiles [34], the redistribution of fast ions by MHD events, other than sawteeth [31], is not.
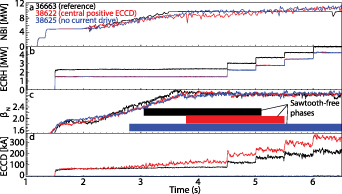
Figure 5. NBI and ECRH power, βN , ECCD in discharges with (black, red) and without (blue) current drive. The boxes in (c) mark phases without sawteeth.
Download figure:
Standard image High-resolution imageDespite the ECRH power being lower than in the reference (figure 5(b)) due to the unavailability of two gyrotrons, the calculated current drive (figure 5(d)) was higher as the more central deposition yields a higher current drive efficiency. The boxes in figure 5(c) mark the phases in which sawteeth are suppressed. Without ECCD (blue), the sawteeth already disappear when βN
reaches 2.25, which coincides with the time at which the 1/1 mode signature becomes obscured by the appearance of high frequency fishbone activity (not shown). This is consistent with the IMSE measurements in this discharge, which indicate a flat central q-profile around unity. The sawteeth remain absent for the remainder of the discharge. This is reminiscent of previous experiments, in which q0 remained clamped around unity in the presence of fishbones, despite it dropping below one in simulations [18, 19, 22]. In comparison, the discharge with the maximal current drive maintains sawtoothing behavior one second longer, until  . This is consistent with the earlier suppression in the reference (black), at
  , in which the total driven current was lower and more broadly deposited. In both the reference and the maximum ECCD case, a strong 1/1 mode with a broad radial profile (out to
  ) is present throughout the discharge. In the maximum ECCD case (red), sawtooth suppression is maintained longer than in the reference, despite the higher level of ECCD. However, this could stem from an overestimation of the current drive. TORBEAM might not be correct with such a centrally optimized ECRH deposition as the linearization used is only valid up to a power density ratio threshold of
  MWm3 [35]. Above this value, the current drive efficiency is expected to increase compared to linear values on the low field side of the resonance layer. With a central ECRH power density between 300 MWm−3 and 1500 MWm−3, depending on the exact location of the magnetic axis, the power density ratio in the later phase of the optimized positive co-ECCD discharge lies at 5–23 MWm3. It was shown at the TCV tokamak that so far above the threshold, the current drive efficiency does not increase as expected, but can lie drastically below the values from linear calculations [36]. This reduced efficiency could be reproduced in models by introducing a radial diffusion term to the current-driving energetic electrons. Hence, the driven current in the discharge analyzed here may also lie below the calculated one. The quantification using more sophisticated codes is beyond the scope of this paper. In the initial phase with lower ECRH power, where the sawteeth disappear at a higher βN
than in the reference, the power density ratio lies between 0.5 and 1.0 MWm3, only slightly above the threshold. The power deposition profile in subsequent discharges was slightly widened to avoid the nonlinear TORBEAM regime.
MWm3 [35]. Above this value, the current drive efficiency is expected to increase compared to linear values on the low field side of the resonance layer. With a central ECRH power density between 300 MWm−3 and 1500 MWm−3, depending on the exact location of the magnetic axis, the power density ratio in the later phase of the optimized positive co-ECCD discharge lies at 5–23 MWm3. It was shown at the TCV tokamak that so far above the threshold, the current drive efficiency does not increase as expected, but can lie drastically below the values from linear calculations [36]. This reduced efficiency could be reproduced in models by introducing a radial diffusion term to the current-driving energetic electrons. Hence, the driven current in the discharge analyzed here may also lie below the calculated one. The quantification using more sophisticated codes is beyond the scope of this paper. In the initial phase with lower ECRH power, where the sawteeth disappear at a higher βN
than in the reference, the power density ratio lies between 0.5 and 1.0 MWm3, only slightly above the threshold. The power deposition profile in subsequent discharges was slightly widened to avoid the nonlinear TORBEAM regime.
The data from different phases in the described discharges, as well as other similar ones in which the current drive and βN
were varied, are shown in figure 6. All discharges exhibit a 1/1 mode throughout, similar to the one shown figure 3(c). The non-inductive current (ECCD, NBI and bootstrap currents), volume averaged inside of  , is plotted on the x-axis. This region was chosen as it corresponds to the average radial extent of the 1/1 mode, as determined from soft x-ray data. On the y-axis, βN
is used as a proxy for the drive of the pressure-driven 1/1 mode. The red symbols represent sawtoothing, the blue symbols sawtooth free phases and the phases shown in orange exhibit sawtooth-like core events in the SXR signature in which no clear inversion radius can be identified, as described in the
, is plotted on the x-axis. This region was chosen as it corresponds to the average radial extent of the 1/1 mode, as determined from soft x-ray data. On the y-axis, βN
is used as a proxy for the drive of the pressure-driven 1/1 mode. The red symbols represent sawtoothing, the blue symbols sawtooth free phases and the phases shown in orange exhibit sawtooth-like core events in the SXR signature in which no clear inversion radius can be identified, as described in the  above unity, and sawteeth reappear [37]. In the discharges discussed in this work with βN
above 2.9, the lowest local ECCD density at which the transition from flux pumping to sawtoothing occurs is 7 MAm−2. This threshold is higher in some of the higher beta discharges.
above unity, and sawteeth reappear [37]. In the discharges discussed in this work with βN
above 2.9, the lowest local ECCD density at which the transition from flux pumping to sawtoothing occurs is 7 MAm−2. This threshold is higher in some of the higher beta discharges.
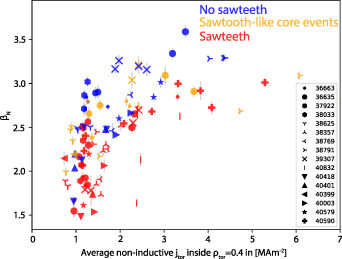
Figure 6. βN as a proxy for the mode drive, versus volume-averaged non-inductive central current density.
Download figure:
Standard image High-resolution imageThis is in line with the theoretical model [28], where the flux pumping mechanism in the simulations is only able to prevent sawtoothing at sufficiently high βN , and where the threshold is dependent on the strength of the inward current diffusion. In the simulation, this 'tendency of the current density profile to centrally peak' was controlled by the peakedness of the applied heat source profile.
While the trend is well reflected by using the proxies βN and the average non-inductive central current density, these parameters are not the exact experimental equivalent of those scanned in flux pumping simulations [28]. A reduced model of magnetic flux pumping, with which the dynamo loop voltage can easily be computed from experimental data, is currently being developed [38].
Although one theory highlights the mode's quasi-interchange characteristics and distinguishes it from the 1/1 kink [28], no definitive conclusions can be drawn about the specific nature of the mode in the experiment, except for its 1/1 helicity. Moreover, the flux pumping phenomenon also seems to manifest alongside fishbones, which also exhibit a 1/1 signature [18, 19, 22].
3. Exploiting flux pumping
Non-inductive current-drive techniques provide an avenue for extending the pulse duration or achieving steady-state operation in tokamak-based fusion reactors. These techniques can leverage the flux pumping mechanism, which eliminates the necessity of precise tuning of the current-drive deposition location to achieve a flat central q-profile around unity. With flux pumping, a flat central q-profile can be attained in a self-regulating manner, eliminating the need for additional optimization endeavors. Figure 7(b) illustrates the q-profiles of two similar discharges under the flux pumping scenario. At the depicted time points, both discharges exhibit comparable values of WMHD
(within a few percent), NBI and ECRH power. Neither case displays sawtooth oscillations. However, in the blue case, ECRH is radially injected to minimize external current drive. Note that the blue case entails a slightly increased toroidal field to achieve central ECRH deposition, as discussed previously. Figure 7(a) shows the current driven by ECCD. Despite the presence of significant externally applied on-axis current drive in the red case, the central q-profiles remain identical out to  (figure 7(b)). In the ECCD case (red), the lower safety factor further off-axis can be explained by the redistribution of the centrally driven current, which flattens the q-profile.
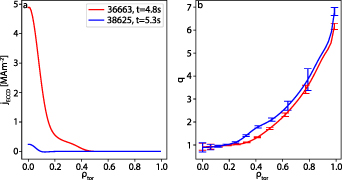
Figure 7. ECCD driven current density profile (a) and q-profile (b) in similar discharges with (red) and without (blue) current drive.
Download figure:
Standard image High-resolution imageIn addition to achieving a robust central q, the flux pumping mechanism allows current to be driven in the center, where the current drive efficiency is highest due to the high  ratio [6], from where it is redistributed off-axis such that q does not drop below unity, hypothetically, maximizing the current drive efficiency [4]. Whether this redistribution yields a more efficient, effective current drive than driving the current further off-axis, where it is needed, can be calculated using codes like IDE, ASTRA and TRANSP. In the following, TORBEAM will be used for a simple comparison.
Figure 8(a) shows the time evolution of the constituents of the plasma current in a flux pumping case from IDE. Starting at 3 s and 3.5 s, ECRH power with strong co-ECCD is applied in two steps. From 3.5 s, the ohmic contribution is negative, as indicated by the black shaded region turning brown. The discharge becomes fully non-inductive, even slightly charging the transformer coil. This is confirmed by the poloidal flux at the separatrix, depicted in figure 8(b) (black). It decreases until 3 s, as expected from the need of driving current inductively, then stays constant until 4 s, indicating a roughly non-inductive phase. Afterwards, the poloidal flux at the separatrix continuously increases over a period of 2 s, which is significantly longer than the current relaxation time of approximately 1 s. This confirms that the non-inductive current exceeds the total plasma current.
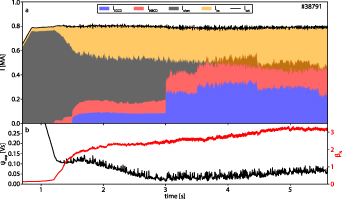
Figure 8. (a) Time evolution of the composition of the plasma current in a fully non-inductive flux pumping discharge and (b) poloidal flux at the separatrix and βN .
Download figure:
Standard image High-resolution imageThe constituents to the current profile at t = 4 s are shown in figure 9(a). The ECCD contribution in blue far exceeds the black total current density in the center. An additional current, negative in the plasma center and positive slightly off axis as shown in figure 9(b), is necessary to obtain the correct total current profile. This can be explained by the dynamo loop voltage, as described in the previous section. The difference between the total current profile and the sum of the bootstrap and NBI currents is shown in red in figure 9(d). It can be interpreted as the electron cyclotron current that would be necessary to obtain the same current profile, without any redistribution mechanism or ohmic current contribution. A TORBEAM simulation, represented in blue, demonstrates the feasibility of achieving the desired central current profile by maintaining the same ECRH power while shifting the deposition of the central gyrotrons off-axis. However, despite achieving a match with the red curve, the resulting total ECCD is 30% lower at 194 kA compared to the case of central deposition, which yielded 290 kA. Overall, the simulated case would match the total current profile shown in black, but not exceed it like it appears in the experiment. Consequently, in the simulated case, no increasing magnetic flux or recharging of the central solenoid would be observed, suggesting an overall lower amount of non-inductive toroidal current. Together, this suggests that central ECCD coupled with flux pumping does allow for higher current drive efficiency. This result is consistent with more systematic studies at DIII-D, where the measured total driven current in 3/2 hybrid discharges is in agreement with the one expected from TRANSP, suggesting that the centrally ECCD current is fully redistributed [37, 39].
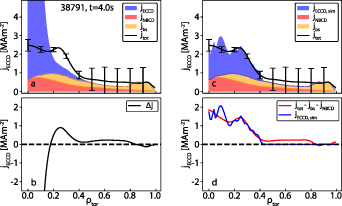
Figure 9. (a) Components of the current profile in a flux pumping discharge, (b) effective ohmic contribution and (c), (d) ECCD necessary to obtain the same profile without anomalous current redistribution.
Download figure:
Standard image High-resolution imageThat being said, it has to be noted that in the discharge presented here, the power density ratio lies above the previously discussed linearity threshold of 0.5 MWm3, so the initially driven current may be lower than TORBEAM suggests. Another consideration is that the TORBEAM calculation utilized the peaked temperature profiles obtained from discharge 38791. Shifting the power deposition off-axis would probably result in a slight reduction in the central electron temperature peaking, leading to a decrease in ECCD efficiency. Consequently, with off-axis current drive the discharge may not achieve complete non-inductivity. As a result of these uncertainties, conclusive statements about the current drive efficiency in a flux pumping scenario cannot be made beyond reasonable doubt.
Therefore, an experimental verification was attempted to directly determine whether the centrally driven current is fully redistributed rather than being partly lost. To achieve this, experiments were prepared to directly compare the flux consumption of the transformer coil in a flux pumping discharge to a case in which the q-profile is shaped via off-axis ECCD. Despite multiple optimization attempts, all discharges with a shaped q-profile were terminated due to the occurrence of a locked 2/1 mode around a βN value of 2.5. In contrast, the flux-pumping discharges consistently maintained stability at and beyond the same beta value. It appears that achieving high beta values with a flat central q-profile around one is highly sensitive to even minor deviations from unity. This comparison will be revisited in future investigations, but the potential enhanced current drive efficiency in the flux pumping case could not be experimentally confirmed at present.
Nevertheless, these experiments demonstrated that the flux pumping scenario exhibits significantly greater robustness and inherent stability compared to shaping the central q-profile. Figure 10 illustrates the relationship between the maximum achieved normalized beta and qmin for all AUG discharges conducted between 2010 and 2022, with βN
values exceeding 2.0 and IDE equilibria data available, totaling 420 discharges. The βN
values were averaged over a half-second interval to focus on stable conditions rather than transient phases, corresponding to 5 to 10 energy confinement times depending on the specific discharge. The safety factor was calculated using current diffusion since MSE or IMSE data were not available for many of the discharges. Therefore, data points with qmin values below 1 are in reality at or close to unity due to the presence of sawteeth (at low β) or flux pumping (at higher β). The orange data represent experiments performed within the flux pumping investigations. Most of the other discharges in the high-β, low qmin region correspond to error-field correction [16] and neoclassical tearing mode stabilization experiments, which share the same scenario as the discharges discussed in this work and also contain a 1/1 mode. Of the discharges with  and sustained
  , 9 experience deleterious MHD activity dramatically reducing the confinement and 6 disrupt immediately when βN
is increased above a certain threshold (typically between 2.8 and 2.9). 8 discharges run as planned, but those are not heated above βN
= 2.8. Only the discharge with qmin very close to unity reaches βN
= 2.9, but it exhibits strong 1/1 activity, indicating that its central safety factor is likely at unity. It is evident that safely heating discharges to βN
above 2.9 (indicated by the dashed line) in AUG can only be achieved with a safety factor around unity.
, 9 experience deleterious MHD activity dramatically reducing the confinement and 6 disrupt immediately when βN
is increased above a certain threshold (typically between 2.8 and 2.9). 8 discharges run as planned, but those are not heated above βN
= 2.8. Only the discharge with qmin very close to unity reaches βN
= 2.9, but it exhibits strong 1/1 activity, indicating that its central safety factor is likely at unity. It is evident that safely heating discharges to βN
above 2.9 (indicated by the dashed line) in AUG can only be achieved with a safety factor around unity.
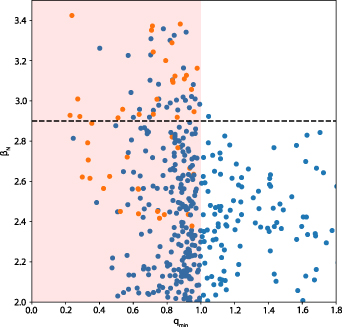
Figure 10. Maximum sustained βN
vs qmin in 420 discharges from the 2010 to 2022 AUG campaigns, with the orange points representing the discharges performed in the context of flux pumping experiments. The dashed line indicates the maximal βN
achieved at  .
.
Download figure:
Standard image High-resolution imageIn a future full-W reactor, the plasma may require a minimum wall clearance to avoid the erosion of high-Z plasma-facing components, reducing the effect of wall-stabilization. A minimum distance between the plasma and the control coils might also be required to shield neutrons and house the breeding blanket, which may limit the achievable triangularity. As such, the current EU-DEMO design foresees  [40]. 1/1 flux pumping could enable safe access to an otherwise MHD quiescent regime above this conservative beta threshold. This is exemplified by the fact that AUG, a full-W machine with large wall clearance (see figure 2(a)), and poloidal field coils located outside of the toroidal field coils, can achieve comparably high-performance regimes for relevant timescales at
  .
.
At DIII-D significant achievements were made in sustaining a βN
value of 3.7 over a duration of 2 s. These accomplishments were attained during a plasma current and toroidal field ramp, with a continuously evolving qmin as documented in [41]. In more recent DIII-D experiments, a comparable βN
value of approximately 3.4 was sustained while maintaining constant parameters of plasma current, toroidal field strength, and a qmin close to unity, similar to the AUG results presented here [4, 37, 39]. However, a sustained β value of approximately 3.5 with an elevated qmin
value of 1.4 was reported in [42]. Observations in DIII-D have revealed that advanced tokamak discharges, both with high-qmin and  , frequently surpass the no-wall stability limit, suggesting the significant impact of wall stabilization [4, 39, 43]. As wall stabilisation may not be as effective in a future reactor, and
  tend to have a higher no-wall limit than elevated qmin plasmas [44–47], the
  scenario may be better suited for high-β operation. The combination of satisfying the condition of a robust safety factor around unity and the absence of sawteeth could make flux pumping an ideal scenario for a reactor.
4. Conclusion
In this work, a new flux pumping model proposing an anomalous current redistribution by a 1/1 quasi-interchange mode was tested experimentally. It was shown that in discharges with strong 1/1 mode activity, the q-profile does not develop as predicted by neoclassical current diffusion, which would result in a monotonically decreasing q-profile towards the plasma core with a central value significantly below one and the appearance of sawteeth. Rather, measurements from the IMSE show a broader, flatter q-profile clamped to values near unity. These measurements are consistent with the sawtooth behavior seen in these discharges, in particular the sawtooth suppression in the presence of the 1/1 mode at high β. It is shown that the IDE equilibrium solver, which contains only current diffusion and a sawtooth current redistribution model, is lacking the necessary physics to explain the observations, and that an additional current-modification mechanism that counteracts the current profile peaking must be present. Using a combination of NBI, ECRH, and ECCD it was shown that this mechanism is stronger at higher βN , but that with enough centrally driven current, it is not strong enough to keep q0 at unity and fully prevent the appearance of sawteeth. These results are consistent with the results from numerical simulations and the analytical theory described in [28], which predicts a pressure threshold for sawtooth avoidance by the 1/1 quasi-interchange mode and that this threshold increases when the current density profile is being driven towards stronger central peaking. However, no statement can be made about the nature of the 1/1 mode in the experiment.
Hypothetically, the flux pumping mechanism allows current to be driven in the center where the current drive efficiency is highest, from where it is redistributed off-axis such that q does not drop below unity. This would provide a relatively inexpensive path for current drive in a future reactor, potentially increasing the pulse length or reducing the necessary size of the central transformer coil. However, the experimental confirmation of a higher ECCD efficiency with flux pumping compared to off-axis current drive could not yet be achieved and will remain the subject of future studies. Nevertheless, it was demonstrated that in AUG, higher βN values can be reached for relevant time scales at a central safety factor around one than at elevated qmin. Therefore, with its robust safety factor around unity together with the absence of sawteeth, flux pumping could be an attractive scenario for a reactor. The next steps include studying a wider parameter space and to explore its existence in a larger machine to enable extrapolation of the flux pumping findings to ITER and DEMO, as its ability to redistribute centrally driven current effectively at the expected β values is still unclear. To accomplish this, dedicated experiments are currently underway at JET.
Acknowledgments
This work has been carried out within the framework of the EUROfusion Consortium, funded by the European Union via the Euratom Research and Training Programme (Grant Agreement No. 101052200—EUROfusion). Views and opinions expressed are however those of the authors only and do not necessarily reflect those of the European Union or the European Commission. Neither the European Union nor the European Commission can be held responsible for them.
The authors would like to thank C Angioni, E Fable, R McDermott and E Poli for fruitful discussions.
Appendix: Sawtooth signatures
The discharge shown in figure 3, as well as almost all discharges described in this work, feature sawteeth with three distinct signatures in the measured data. Note that this variation in signature does not necessarily reflect the magnitude of the plasma and current redistribution caused by the sawtooth, as the signature strongly depends on the gradient of the temperature and emissivity profiles. All discharges contain sawteeth with a classic signature, which appear around the time of the L-H transition. These sawteeth cause an inversion in the electron cyclotron emission (ECE) temperature profile [48], as well as the soft x-ray (SXR) emission [49], as seen in the left panels of figure A1 (grey shaded area). The measurement locations of the temperatures shown in panels (a), (c) and (e) range from the magnetic axis (red) out to  at the outer mid-plane. The SXR channels (b) pass through the center (red) or graze the
  flux surface (blue) above and below the plasma center. The sawtooth times are marked by a sharp change in SXR oscillation amplitude and are indicated by the grey shaded areas. The classic sawteeth lead to a decrease of the central SXR radiation and to an increase further out, as expected. The oscillation at 1.618 s is caused by a fishbone. While these are present in most of the discharge, their signatures in the SXR and magnetic data are very different to those of the sawteeth and they can easily be differentiated.
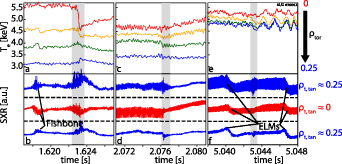
Figure A1. ECE electron temperature time traces (top), SXR (bottom) for three different sawtooth signatures (grey shaded area). The ECE channels range from the magnetic axis (red) to  (blue). The red SXR cord passes through the center, the blue ones graze
  above (top) and below (bottom) the axis.
Download figure:
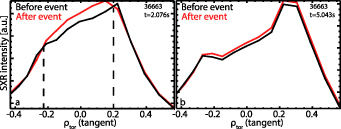
Standard image High-resolution imageThe central column of panels shows the typical signature of most sawteeth present in the experiments discussed in this work. They are barely visible in the ECE data (c), but the SXR data (d) still shows a clear inversion radius, as represented by the dashed line in figure A2(a). Note that here, the central radiation increases while the radiation further outside decreases. This is due to an initially hollow tungsten density profile which is then flattened by the sawtooth, leading to an increase of the central emission [50]. In the last case (right column of panels), the same sawtooth-like signature is observed in the SXR data (figure A1(f)), but no clear inversion can be observed (figure A2(b)). The signature in the SXR data weakens with increasing radius (channels not shown), confirming the localization of these events to the plasma center. In this work, this last case is referred to as 'sawtooth-like events'. The SXR emission intensity, and its change induced by the sawtooth, not only depend on the shape of the tungsten concentration profile, but are also highly coupled to the central electron temperature gradient, which changes dramatically throughout the discharge. This flatter Te profile later in the discharge can be seen in the difference in the temperature measured by the four ECE channels shown in figure A1(e). Depending on the exact profiles, a sawtooth can induce an inversion in either direction (left and central columns in figure A1), or no inversion (right column) in the temperature or radiation profiles. Note that the SXR radiation drops before and after the sawtooth in figure A1(f) are caused an ELMs. These drops are visible in all channels as the SXR diagnostic yields an integrated measurement including the plasma edge.
Figure A2. SXR profiles before (black) and after a sawtooth event with (a) and without (b) a clear inversion radius.
Download figure:
Standard image High-resolution image