

Abstract
Objective. This paper describes a method to extract upper limb intention tremor from gyroscope data, through the Hilbert–Huang transform (HHT), a technique suitable for the study of nonlinear and non-stationary processes. The aims of the study were to: (i) evaluate the method's ability to discriminate between healthy controls and MS subjects; (ii) validate the proposed procedure against clinical tremor scores assigned using Fahn's tremor rating scale (FTRS); and (iii) compare the performance of the HHT-based method with that of linear band-pass filters. Approach. HHT was applied on gyroscope data collected on 20 MS subjects and 13 healthy controls (CO) during finger-to-nose tests (FNTs) instrumented with an inertial sensor placed on the hand. The results were compared to those obtained after traditional linear filtering. The tremor amplitude was quantified with instrumental indexes (TIs) and clinical FTRS ratings. Main results. The TIs computed after HHT-based filtering discriminated between CO and MS subjects with clinically-detected intention tremor (MS_T). In particular, TIs were significantly higher in the final part of the movement (TI2) with respect to the first part (TI1), and, for all components (X, Y, Z), MS_T showed a TI2 significantly higher than in CO subjects. Moreover, the HHT detected subtle alterations not visible from clinical ratings, as TI2 (Z-component) was significantly increased in MS subjects without clinically-detected tremor (MS_NT). The method's validity was demonstrated by significant correlations between clinical FTRS scores and TI2 related to X (rs = 0.587, p = 0.006) and Y (rs = 0.682, p < 0.001) components. Contrarily, fewer differences among the groups and no correlation between instrumental and clinical indexes emerged after traditional filtering. Significance. The present results supported the use of the HHT-based procedure for a fully-automated quantitative and objective measure of intention tremor in MS, which can overcome the limitations of clinical scales and provide supplementary information about this sign.
Export citation and abstract BibTeX RIS
1. Introduction
Tremor, defined as a rhythmical and involuntary oscillation of a body part [1], is a highly disabling symptom affecting approximately 45% of subjects with multiple sclerosis (MS) [2]. In particular, upper limb intention tremor, characterized by an increasing amplitude toward the end of visually guided, target-directed movements [1], has been found to be one of the most prevalent forms of tremor in MS, and to highly interfere with the activities of daily living and the quality of life [2, 3].
In clinical settings, intention tremor is commonly assessed using ordinal scales [4, 5], rating the tremor amplitude during the finger-to-nose test (FNT), which is considered the golden standard in the neurological examination of this sign [6]. Although clinical scales show good reliability [4], subjective differences between ratings may be present when they are used to evaluate tremor occurring during movement [5]. Moreover, ordinal scales suffer from limited resolution [7] and limited ability to describe tremor characteristics in terms of direction, frequency and amplitude. In two recent studies [8, 9], intention tremor, assessed with clinical scales, were detected in more than 30% of tested MS subjects, but only a weak correlation was found between intention tremor ratings and upper limb capacity and perceived manual ability in daily life activities [8]. Moreover, the assigned tremor scores suggested only mild involvement, even in the severely affected patients [9]. The authors suggest that these unexpected results could be in part due to difficulties in rating intention tremor due to complex ataxic movements typical of MS, and stressed the need for additional quantitative methods providing objective and more detailed evaluation of this sign. In this context, wearable inertial sensors seem good candidates for the instrumentation of the FNT [10–14], as in clinical settings they can directly provide an objective assessment of tremor, that is necessary to deepen the analysis of this symptom, monitor its progression, and to evaluate the effects of specific treatments [15, 16].
In literature, the most common techniques proposed to extract tremor from kinematic data consist in the application of linear filters [7, 17–19] and in the analysis of the power spectral density estimate [20, 21]. At present these methods are still the most widely used in clinical studies although they are not the most adequate as they require the fulfillment of the two basic assumptions of linearity and stationarity that are hardly met by physiological processes such as intention tremor. To handle non-stationary data, adaptive filtering methods have been proposed for tremor estimation [12, 22–24]. However, these techniques require a proper and detailed model of the system and the a priori knowledge of the characteristics of measured signals and associated noise [25]. Moreover, their effectiveness depends on the correct choice of their internal parameters. Further procedures to quantify tremor are based on the wavelet transform [26], which handles non-stationarity, but depends upon prior selection of a proper wavelet prototype [22]. Importantly, the basic assumption of the above methods is that the signal is linear. Nonlinear filters, such as extensions of the Kalman filter, have also been proposed [27, 28], and they still rely on detailed models describing the behavior of the signals and noise, and on the fine tuning of their internal parameters [29]. An alternative procedure to overcome the aforementioned limitations is the Hilbert–Huang transform (HHT) developed by Huang et al [30] to study nonlinear and non-stationary processes. In a study by De Lima et al [10], the HHT was applied to extract tremor from gyroscope data in a group of 31 subjects suffering with different pathologies, including four patients presenting cerebellar intention tremor [31]. With the exception of these preliminary results, no specific studies have been devoted so far to the application of the HHT for the assessment of intention tremor in MS.
In the present paper, we proposed a HHT based method to quantify upper limb intention tremor in MS, during the FNT instrumented with a single inertial sensor. The method was applied on a group of healthy subjects and on persons with MS with the following aims: (i) to evaluate the method's ability to discriminate between healthy controls and MS subjects, (ii) to validate the proposed procedure for the quantification of intention tremor in MS, and (iii) to compare the performance of the HHT-based method with that of traditional band-pass filters still widely used in clinical studies.
2. Methods
2.1. Subjects
A consecutive sample of 20 subjects with MS (eight women, mean age ± standard deviation: 46.4 ± 8.5 years) and 13 healthy volunteers with comparable ages (five women, age: 44.2 ± 9.0 years) participated in the study. All subjects signed an informed consent to the protocol which was approved by the local Ethical Committee. MS patients fulfilled the following inclusion criteria: a definite diagnosis of MS according to the McDonald criteria [32] and an expanded disability status scale (EDSS) [33] <9. The exclusion criterion for the healthy control group was the presence of neurological, rheumatic or orthopedic disorders which might interfere with the protocol. Demographic and clinical characteristics of MS subjects are reported in table 1.
Table 1. Demographic and clinical characteristics of MS subjects.
| Subject | Age [years] | Gender [F/M] | Time since diagnosis [years] | MS type [RR/PP/SP] | EDSS [points] |
|---|---|---|---|---|---|
| P01 | 43 | M | 15 | RR | 4.5 |
| P02 | 57 | F | 32 | RR | 6.5 |
| P03 | 44 | M | 1 | RR | 6.5 |
| P04 | 51 | M | 29 | SP | 7.5 |
| P05 | 45 | M | 4 | PP | 6 |
| P06 | 58 | M | 14 | SP | 7 |
| P07 | 25 | F | 3 | RR | 2.5 |
| P08 | 51 | F | 25 | SP | 7.5 |
| P09 | 40 | M | 1 | RR | 2 |
| P10 | 39 | F | 23 | SP | 8 |
| P11 | 38 | F | 5 | RR | 6.5 |
| P12 | 44 | F | 23 | SP | 8.5 |
| P13 | 55 | M | 33 | PP | 6 |
| P14 | 50 | M | 18 | PP | 6.5 |
| P15 | 38 | M | 5 | RR | 6 |
| P16 | 54 | F | 27 | RR | 6 |
| P17 | 46 | F | 8 | PP | 7.5 |
| P18 | 61 | M | 31 | SP | 5.5 |
| P19 | 45 | M | 9 | SP | 6.5 |
| P20 | 43 | M | 2 | RR | 6.5 |
| Mean | 46.4 | 8F/12M | 15 .4 | 9RR/4PP/7SP | 6.2 |
| SD | 8.5 | 11.6 | 1.6 | ||
| Range | 25–61 | 1–33 | 2–8.5 |
RR: relapsing remitting; PP: primary progressive; SP: secondary progressive; EDSS: expanded disability status scale—0 (normal) -10 (death due to MS).
2.2. Experimental setup
MS subjects executed the FNT with their most affected side, which was characterized by the worst performance at the nine hole peg test (9HPT) [34], while a random side of each healthy control was tested. Subjects sat comfortably on a chair behind a table. Then they were asked to lift the selected arm to 90° of abduction at the shoulder, with full extension at the elbow, the forearm in neutral position and the index finger pointing laterally. As soon as they received a vocal command from the examiner, the subjects touched their nose with their finger and then they returned to the starting position at their self-selected speed. They were asked to maintain 90° degrees of shoulder abduction, with the forearm in neutral position throughout the test [6]. The finger-to-nose movement was repeated five times consecutively.
Subjects performed the FNT wearing a single inertial measurement unit (MTX, Xsens, The Netherlands) mounted on the dorsum of the hand, with the sensing axes (X, Y and Z) oriented along the longitudinal, medio-lateral and antero-posterior axes of the hand, respectively (see figure 1).
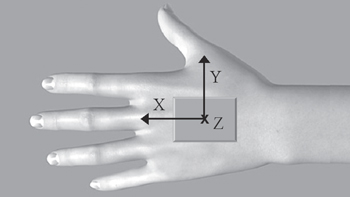
Figure 1. Inertial sensor placement. Orientation of sensing axes (X, Y and Z) is indicated.
Download figure:
Standard image High-resolution imageThe MTX, consisting of a 3D accelerometer (±5 g range), a 3D gyroscope, (±1200° s−1 range) and a 3D magnetometer (±750 mGauss), was connected via a cable to a data transmitter (Xbus Master) located on the table. Signals were acquired with a sampling frequency of 50 Hz. During the FNT the upper limb intention tremor was also clinically assessed using Fahn's tremor rating scale (FTRS) [4], that is a five point ordinal scale rating the tremor severity from 0 (no tremor) to 4 (severe tremor). The clinical tests (9HPT and FTRS) were administered by one experienced physical therapist.
2.3. Signal processing—HHT-based filtering
The angular velocity signals from the gyroscope (ωx, ωy and ωz) were processed to extract tremor. The proposed HHT-based filtering method is made up of two steps: (1) computation of the HHT, and (2) application of the mode-selection procedure.
2.3.1. Hilbert–Huang transform (HHT)
The HHT algorithm [30] can be divided into two phases. Firstly, the empirical mode decomposition (EMD) extracts the oscillatory modes embedded in the input signal. Thereafter, the Hilbert transform is applied, to obtain the amplitude–frequency–time distribution of each component.
The EMD [30, 35] is an iterative and totally adaptive procedure that decomposes the input time-series into a finite set of waveforms, called intrinsic mode functions (IMFs), and a residue that can be the average trend of the time-series or a constant value. An IMF is a function that satisfies two conditions: (1) in the whole data set, the number of extrema and the number of zero crossings must be either equal or differ by one at most, and (2) at any point, the mean value of the envelope defined by the local maxima and the envelope defined by the local minima is zero [30]. Under conditions (1) and (2) an IMF can be modulated in both amplitude and frequency and be, therefore, non-stationary [29]. Moreover, IMFs may have a physical meaning, as their time-scales, defined by the time lapse between the extrema, are directly derived from the data, without any a priori assumptions about signal characteristics. IMFs are extracted with an iterative procedure, known as the 'sifting process' [30]. In the present paper, we used the algorithm described in [29, 35].
If S(t) is a raw gyroscope signal, then the EMD procedure is described as follows:
- (1)two variables r(t) and x(t) are defined and initially set equal to the original signal S(t);
- (2)the local maxima and minima of x(t) are separately interpolated using a cubic spline, to obtain the upper envelope emax(t) and the lower envelope emin(t), respectively;
- (3)the mean envelope m(t) and the mode amplitude M(t) are computed as
![$m(t)=[{{e}_{{\rm max} }}(t)+{{e}_{{\rm min} }}(t)]/2$](data:image/png;base64,iVBORw0KGgoAAAANSUhEUgAAAAEAAAABCAQAAAC1HAwCAAAAC0lEQVR42mNkYAAAAAYAAjCB0C8AAAAASUVORK5CYII=) and respectively;
and respectively; - (4)a candidate IMF is estimated as h(t) = x(t) − m(t). If h(t) does not fulfill criteria I) and II) defining an IMF, steps (2) to (4) are repeated, with x(t) = h(t). Otherwise, h(t) is the ith IMF, the variable r(t) is updated as r(t) = r(t) – IMFi(t), and the procedure moves to step (5);
- (5)if r(t) has at least two extrema, the procedure is repeated from step (2), with x(t) = r(t), to extract the subsequent IMF. Otherwise, r(t) is the final residue of the data set and the procedure stops.
![$m(t)=[{{e}_{{\rm max} }}(t)+{{e}_{{\rm min} }}(t)]/2$](https://content.cld.iop.org/journals/1741-2552/12/4/046011/revision1/jne513997ieqn1.gif)
![$M(t)=[{{e}_{{\rm max} }}(t)-{{e}_{{\rm min} }}(t)]/2$](https://content.cld.iop.org/journals/1741-2552/12/4/046011/revision1/jne513997ieqn2.gif)
Regarding step (2), extrema are added by 'mirror symmetry' [29, 35] before spline interpolation, to take into account the issue related to the boundary conditions and, consequently, minimize error propagations due to finite observation lengths. Concerning step (4), we assumed that condition II) is satisfied if, at any point, the function  is below a suitable value [29]. In the present study this threshold was set to 0.005.
Once the algorithm ends, n IMFs and a residue rn(t) are obtained; hence, the original signal S(t) can be reconstructed by summing up these components. Figure 2 shows an example of a raw angular velocity signal (figure 2(a)) that has been decomposed into eight IMFs, through the EMD procedure (figure 2(b)). It can be seen that, by construction, after an IMF is extracted from the data, the number of extrema in the partial residue decreases, which means that the next IMF will have a larger time-scale [27].
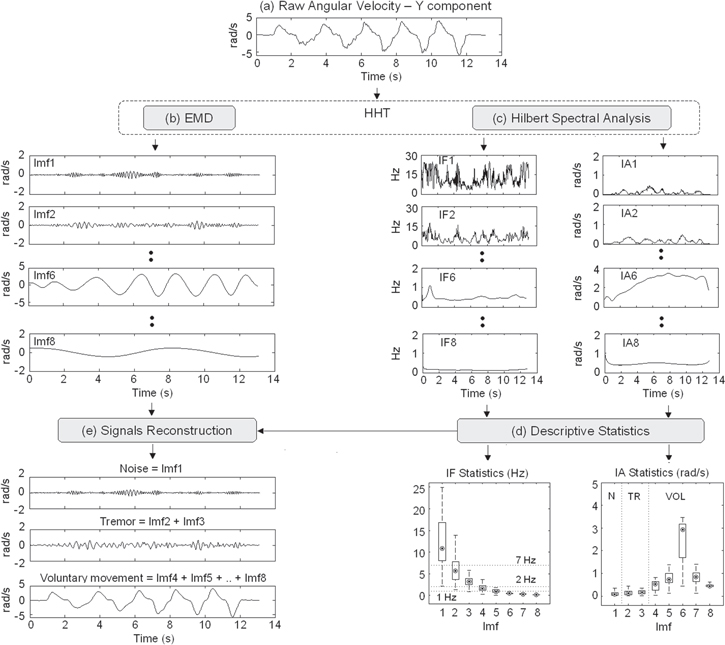
Figure 2. (a)–(e) The HHT-based procedure. (a) Y component of angular velocity recorded from a healthy subject during finger-to-nose test. (b) IMFs (Imfi, i:1:8) extracted with the EMD algorithm from the signal shown in (a). (c) Instantaneous frequency (IFi) and amplitude (IAi) computed on the IMFs shown in (b) through Hilbert spectral analysis. (d) Box-plot showing the subject-specific descriptive statistics related to the time-course of IFi and IAi shown in (c). Point: median; box: interquartile range; whisker: non-outlier range. (e) Noise, tremor and voluntary movement reconstructed by summing up the corresponding IMFs.
Download figure:
Standard image High-resolution imageOnce the raw signal has been decomposed into zero-mean oscillatory modes, the Hilbert transform can be applied to each IMF. The residue rn(t) is not considered for the Hilbert spectral analysis as it is a monotonic or a constant function [29]. If Yi(t) is the Hilbert transform of IMFi(t), then the analytic signal Zi(t) can be defined as follows:

where  is the instantaneous amplitude and φi(t) = arctan[Yi(t)/IMFi(t)] is the instantaneous phase associated with IMFi(t). Hence, instantaneous frequency IFi(t) is computed as the first time derivative of φi(t). Figure 2(c) shows the time-course of IF and IA related to the IMFs plotted in figure 2(b).
2.3.2. Mode-selection procedure
After application of the HHT, each IMF must be assigned to either noise or tremor or voluntary movement, following a specific criterion. In this paper, we proposed a fully automated mode-selection procedure, which assigns each IMF on the basis of the descriptive statistics characterizing its instantaneous frequency [IF(t)] and instantaneous amplitude [IA(t)] and on the basis of the following notions: (1) voluntary finger-to-nose movement is mainly situated in the frequency range below 1 Hz [(0.56 ± 0.21) Hz for controls and (0.43 ± 0.17 ) Hz for MS patients], (2) an intention tremor due to MS is mainly between 2 and 6 Hz [1, 7, 36], with a vision-dependent component around 1 Hz [37]. The algorithm can be summarized as follows:
- (1)Subject-specific non-parametric descriptive statistics related to IF(t) and IA(t) are computed for each IMF. In particular, the median frequency (MF), median amplitude (MA), inter-quartile range of amplitude (IQRA) and range of amplitude (RA) are calculated. Figure 2(d) shows a box-plot describing the statistical features extracted from the time-course of IF(t) and IA(t) reported in figure 2(c).
- (2)IMFs with MF > 7 Hz are assigned to noise (Imf1 in figures 2(b)–(d)).
- (3)IMFs with MF between 2 Hz and 7 Hz are assigned to tremor (Imf2 and Imf3 in figures 2(b)–(d)).
- (4)
- (5)The remaining IMFs (Imf4 and Imf5 in figures 2(b)–(d)), characterized by MF around 1 Hz, are assigned to tremor if their MA is within the IQRA of the last mode assigned to tremor (i.e. Imf3) and if their range of amplitude does not contain the MAmax value. Otherwise, they are assigned to voluntary movement, as in the example of figure 2.
This latter condition about the median amplitude has been introduced to avoid the following drawbacks. In particular, the automatic assignment of these modes to tremor would lead to an underestimation of voluntary motion in the case of faster FNT movements executed by subjects without tremor. In fact, in this case, the voluntary movement could have components around 1 Hz, although its predominant frequency is below this value. On the contrary, the automatic assignment of these IMFs to voluntary motion would underestimate the low-frequency, vision-dependent components of the tremor in the case of tremulous subjects executing slow FNT movements.
Once all modes have been assigned to noise, tremor and voluntary movement, these signals can be reconstructed by summing up the corresponding IMFs (see figure 2(e)).
2.4. Signal processing—linear band-pass filtering
Tremor was also extracted by applying conventional filters to raw angular velocities. In particular, we used a Butterworth band-pass filter (BBPF), which is one of the most commonly used in literature [17–19]. Two pass-bands were applied, based on the characteristics of an MS intention tremor. The first band (i.e. (1–7) Hz) was selected to capture all tremulous oscillations between 2 Hz and 6 Hz [1], as proposed by Feys et al [7], while the second band (i.e. (2–6) Hz) was chosen considering the results found in [31, 38], which demonstrated the presence of tremor peaks mainly in the frequency range between 3 Hz and 5 Hz. To obtain a good attenuation in the stop band, a fourth order filter was used. To avoid phase distortion, forward and backward filtering was applied; this choice also doubled the filter order.
2.5. Data segmentation and computation of tremor index
After tremor extraction, data were segmented into movements toward the nose and from the nose (see figure 3).
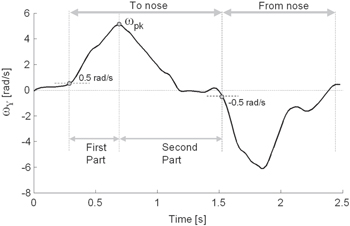
Figure 3. Y component of angular velocity (ωY) recorded from a healthy subject during one cycle of the finger-to-nose test.
Download figure:
Standard image High-resolution imageOnly movements toward the nose were considered for the subsequent analysis because intention tremor manifests mostly during target-directed actions. In particular, the Y component of the angular velocity (ωy) was used for data segmentation. As shown in figure 3, for each FNT repetition, the positive peak of ωy (ωpk) was identified. Hence, movement onset was calculated as the first instant, preceding ωpk, in which ωy exceeded a threshold th set to 0.5 rad s−1, while movement termination was identified as the first frame following ωpk in which ωy fell below –th. Finally, each FNT movement was further subdivided into a first part (i.e. the acceleration phase) from onset to ωpk, and a second part (i.e. the deceleration and terminal phases), from ωpk to termination. Hence, the duration of either the first (D1) and the second part (D2) of each finger-to-nose movement was calculated. To quantify the tremor amplitude, a normalized tremor index (TI) was computed as follows:
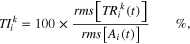
where rms represents the root mean square value, TRki(t) (k: X, Y, Z; i: 1, 2) is the tremor extracted from signal ωk(t) during the ith part of each FNT movement, and Ai(t) = √[ωx(t)2 + ωy(t)2 + ωz(t)2] is the norm of raw angular velocity related to the ith part of the movement. Index normalization was performed to further reduce the effect due to different execution velocities.
2.6. Statistical analysis
Considering that data were not normally distributed (Shapiro–Wilks W test, p < 0.05), variables were described by median/range values and analyzed by means of non-parametric statistical methods. In particular, comparisons among groups of subjects (healthy controls and MS subjects with and without tremor) were performed using the Kruskal–Wallis test (KWt). In the presence of significant differences (p < 0.05), the Bonferroni–Holm post-hoc procedure was applied. The comparison between tremor related to the first part (TI1) and the second part (TI2) of the movement was conducted using the Wilcoxon matched pairs test (Wt). The same test was used to compare temporal parameters D1 and D2. Finally, the validity of the proposed tremor indexes was investigated through a correlation analysis between the instrumental parameters and the clinical FTRS scores. In particular, the Spearman correlation coefficient rs and the related p-value were calculated. The Spearman coefficient was also computed to analyze the correlation between tremor indexes and the movement duration.
3. Results
3.1. Clinical assessment of intention tremor—FTRS
FTRS scores revealed the absence of the intention tremor (score: 0) in nine MS subjects (MS_NT group), while 11 patients (MS_T group) showed this sign with different levels of severity. In particular, three subjects presented with a mild intention tremor (score: 1), five subjects with moderate tremor (score: 2) and three patients with severe tremor (score: 3–4).
3.2. Instrumental assessment of intention tremor—HHT
Instrumental tremor indexes (TIs) are presented in table 2.
Table 2. Instrumental Tremor Indexes (TI1 and TI2) for CO, MS_NT and MS_T groups.
| Method | Group & p-value | X component | Y component | Z component | ||||||
|---|---|---|---|---|---|---|---|---|---|---|
| TI1 [%] | TI2 [%] | TI1 [%] | TI2 [%] | TI1 [%] | TI2 [%] | |||||
| CO | 11.4 (6.2-15.9) |
|
|
|
5.7 (1.9-9.5) |
|
||||
| HHT | MS_NT | 15.4 (6.5-21.2) | * | 7.4 (3.0-13.6) | * | |||||
| MS_T | 11.9 (4.2-22.5) | * | * | 7.1 (3.6-10.9) | * | |||||
| p(KWt) | 0.564 | 0.004 | 0.040 | 0.003 | 0.244 | 0.004 | ||||
| CO | 13.2 (8.8-19.4) | 12.8 (5.1-14.7) | 14.4 (5.8-24.1) | 18.7 (5.9-26.9) | 11.6 (7.2-17.2) | 11.9 (5.1-20.1) | ||||
| BBPF1 (1-7)Hz | MS_NT | 18.7 (5.6-32.7) | 13.5 (9.1-24.9) | 15.3 (11.9-27.0) | 16.9 (11.0-28.5) | 17.2 (10.4-26.6) | 14.3 (5.3-32.0) | |||
| MS_T | 17.0 (11.0-23.0) | 20.1 (11.6-28.6) | 12.8 (5.6-16.9) | 21.4 (11.4-40.5) | * | 11.4 (7.2-14.5) | 13.9 (10.0-21.8) | * | ||
| p(KWt) | 0.090 | 0.084 | 0.645 | 0.799 | 0.131 | 0.212 | ||||
| CO | 8.4 (5.2-11.1) |
|
|
8.0 (3.5-12.7) | 5.0 (2.5-8.5) | 5.8 (3.5-8.9) | ||||
| BBPF2 (2-6)Hz | MS_NT | 13.9 (6.4-22.2) | 10.0 (9.1-12.9) | 8.0 (3.5-12.2) | 8.5 (4.0-11.6) | |||||
| MS_T | 9.1 (3.9-20.3) | 10.6 (6.9-29.8) | * | 5.1 (3.3-9.4) | 8.0 (4.9-9.3) | * | ||||
| p(KWt) | 0.071 | 0.004 | 0.026 | 0.070 | 0.212 | 0.080 | ||||
Values are median (non-outlier range).KWt: Kruskal-Wallis test (CO versus MS_NT versus MS_T). Significant p-values are reported in bold. Gray brackets indicate significant differences between two groups (p < 0.05, Bonferroni-Holm post-hoc comparison). * p < 0.05 (TI1 versus TI2, Wilcoxon matched pairs test).
The data extracted with the HHT-based method showed that the tremor index of MS_T subjects was significantly higher in the second part of the movement (TI2) compared to the first part (TI1) for all components (X, Y and Z). The same result was found by examining components Y and Z related to MS patients without tremor (MS_NT). No such difference was found in healthy controls (CO). Comparisons among the three groups revealed that the TI1 computed on the Y component was significantly higher in MS_T subjects with respect to CO. Concerning tremor related to the second part of the movement, a significant increase of TI2 was found in MS_T, with respect to CO in all three components and with respect to MS_NT in the X and Y components. Moreover, TI2 computed on the Z component was also significantly increased in MS_NT patients compared to controls.
The severity of the intention tremor clinically assessed with FTRS was positively correlated with TI2 computed on the X (rs = 0.587, p = 0.006) and Y components (rs = 0.682, p < 0.001). No significant correlation was found between the FTRS score and TI2 related to Z component (rs = 0.128, p = 0.590).
An example of the results obtained after the application of the HHT-based method on three representative subjects is reported in figure 4.
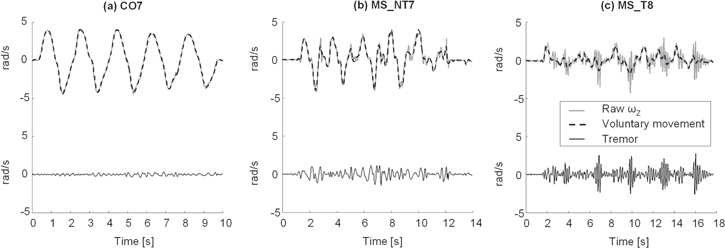
Figure 4. (a)–(c) Tremor (continuous black line) and voluntary movement (dashed black line) extracted with the HHT-based method from the Z component of angular velocity (ωZ, gray line) recorded from (a) a healthy control (CO7), (b) a subject with MS without tremor (MS_NT7) and (c) a patient with MS presenting intention tremor (MS_T8).
Download figure:
Standard image High-resolution image3.3. Instrumental assessment of intention tremor—BBPF
As shown in table 2, the application of BBPF1 did not show any statistically significant difference between the three groups of subjects, while the application of BBPF2 disclosed a significant increase of TI2 (X component) and TI1 (Y component) in MS_T patients, compared to CO. Finally, no statistically significant correlations between the FTRS scores and instrumental tremor indexes were found either for BBPF1 (X: rs = 0.225, p = 0.341; Y: rs = 0.282, p = 0.228; Z: rs = −0.117, p = 0.623) and for BBPF2 (X: rs = 0.409, p = 0.073; Y: rs = 0.209, p = 0.377; Z: rs = 0.105, p = 0.659).
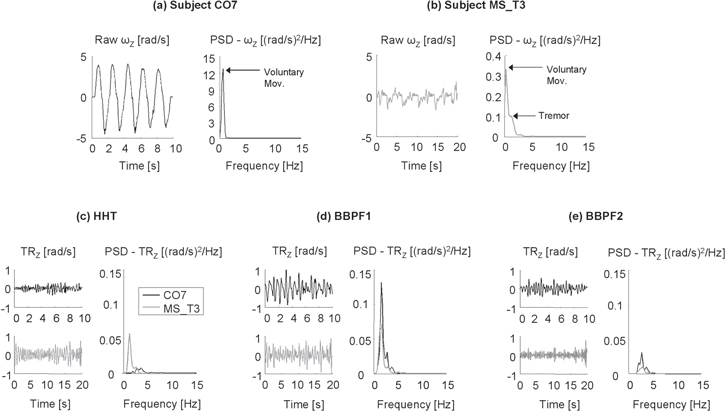
Figure 5(a), (b) shows the Z component of angular velocity recorded from a healthy subject (CO7) and a representative MS patient (MS_T3) who obtained an FTRS score of 2 (i.e. moderate intention tremor). The presence of a low-frequency tremor around 1.5 Hz can be seen from the power spectrum shown in figure 5(b). Tremor estimates obtained after the application of the three procedures are reported in figures 5(c)–(e). It can be seen that the significant difference between the two subjects disclosed by the HHT-based method (figure 5(c)) is not detected by BBPF1 and BBPF2 (figures 5(d), (e)).
Figure 5. (a, b) Raw angular velocities (ωZ, left panels) and related power spectral densities (PSD, right panels) recorded from (a) a healthy control (CO7, black line) and (b) a subject with MS presenting intention tremor (MS_T3, gray line). (c)–(e) Time-course (left panels) and PSD (right panels) of tremor (TRZ) extracted from raw signals shown in (a, b) with the three filtering procedures: (c) HHT-based filtering (HHT), (d) Butterworth's bandpass filter between 1 and 7 Hz (BBPF1) and (e) Butterworth's bandpass filter between 2 and 6 Hz. (BBPF2).
Download figure:
Standard image High-resolution image
3.4. Instrumental assessment of intention tremor—temporal parameters
Temporal parameters extracted from gyroscope data revealed that duration D1 of the first part of the finger-to-nose movement was similar in the three groups (CO median (Min–Max): 0.32 s (0.20–0.42) s; MS_NT: 0.34 s (0.26–0.38) s; MS_T: 0.38 s (0.18–0.52) s; pKWt = 0.335). On the contrary, a statistically significant difference was found in the duration D2 of the second part of the movement (CO: 0.64 s (0.30–0.94) s; MS_NT: 0.74 s (0.42–0.96) s; MS_T: 1.12 s (0.46–1.80) s; pKWt = 0.007). In particular, post-hoc analysis showed a significant increase of D2 in MS_T subjects compared to healthy controls (p = 0.015) and compared to MS_NT patients (p = 0.030).
Considering all MS subjects, a significant positive correlation was found between duration D2 and tremor index TI2 computed after the application of the HHT-based procedure (rs = 0.526, p < 0.001). No such a correlation was found in the CO group (rs = −0.061, p = 0.714).
4. Discussion
In the present paper, we introduced an HHT-based method to assess upper limb intention tremor in MS patients and healthy subjects, via a single inertial sensor mounted on the hand during the FNT. The procedure, requiring low-cost instrumentation and minimal preparation time, was intended to be used in clinical practice to obtain a fully-automated quantitative and objective measure of intention tremor, which may overcome the limitations of clinical scales and provide supplementary information about this sign (see Bertoni et al [9]).
In recent years, the use of wearable inertial sensors for the assessment of motor function has grown significantly, since they are relatively cheap and easily allow for measurements directly in clinical settings [39]. Although accelerometers are most commonly used for the assessment of tremor during the maintenance of quasi-static positions (i.e. rest and postural tremor) [31, 40, 41], they are highly affected by gravitational artifacts, in particular during voluntary movements such as the FNT [12] when the hand is not horizontal [42]. In this context, a previous study of Pallavaram et al [43] suggested that angular velocity may be more suitable to quantify tremor than linear acceleration, as it showed a stronger correlation with clinical ratings. For these reasons, in the present study we used gyroscopes, which also allowed for easier separation of the signal components and data segmentation. To simplify the set-up as much as possible and to facilitate its use in clinical settings, only one sensor was placed on the hand. This choice, in turn, limited the analysis of the tremor to the distal component, that is indeed the most commonly encountered and clinically assessed in MS subjects [36].
Concerning the application of the HHT to inertial sensor signals, preliminary encouraging results about tremor extraction and classification have been found in [10, 41, 44]. With respect to these studies, the novelties of the present work may be summarized as follows. Firstly, in the cited studies the HHT was used to extract postural and/or kinetic tremor (i.e. tremor occurring during a voluntary movement [1]). No further analysis was added to evaluate the presence of intention tremor, that are characterized by an increasing amplitude toward the end of a target-directed movement. On the contrary, this kind of tremor is specifically analyzed in the present work. Secondly, the majority of subjects tested in [10, 41, 44] suffered from essential and Parkinsonian tremor. Regarding this point, De Lima et al [10] stressed the need of additional investigations to validate the HHT-based method on different kind of tremor and in different populations, such as MS patients. Moreover, with respect to the cited studies, in the present work the comparison between different groups (CO, MS_NT and MS_T) and the correlation between HHT-based tremor indexes and clinical ratings were investigated, as this point is considered indispensable for the validation and the diffusion of instrumental methods in clinical practice [21]. Finally, we proposed a novel mode-selection algorithm, tailored on the specific features of intention tremor due to MS and based on the analysis of the descriptive statistics of instantaneous frequency and amplitude related to each IMF. Results of the present study showed that the proposed procedure was able to assess tremor using gyroscope data, in a completely automated way, with only an a priori assumption about the frequency range typical of MS tremor. No specific information about the dominant frequency of the tremor related to each single subject was required. Furthermore, the implemented algorithm also allowed for the extraction of the low frequency components of tremor, around 1 Hz, which may be partly mixed with voluntary movements and, therefore, hardly separable with conventional linear filters.
The results related to the tremor indexes computed after the application of the HHT-based procedure, revealed significant differences between healthy controls and MS_T subjects with clinically-detected intention tremor. Compared to CO, MS_T subjects showed significantly higher values of both TI1 and TI2, thus suggesting the presence of kinetic tremor throughout the whole finger-to-nose movement. While TI1 was significantly increased only for the Y component, TI2 showed abnormally higher values with respect to CO in all three directions (X, Y, Z), thus revealing greater and more consistent alterations during the second part of the movement (i.e. deceleration period and terminal phase) with respect to the first part (i.e. acceleration phase). Similar results were found by Deuschl et al [40], who analyzed intention tremor during a reach-to-grasp task.
Importantly, MS_T subjects showed a value of TI2 significantly higher than TI1, in agreement with previous studies [45, 46] and with the clinical definition of intention tremor. This result in turn suggested that the proposed algorithm and the computed indexes may correctly detect intention tremor and not merely kinetic tremor. This consideration is enforced by the results related to the durations of the finger-to-nose sub-movements. In particular, while the time spent during the acceleration period (D1) was similar among the groups, the duration of the second part of the movement (D2) was significantly increased in MS_T subjects, as also found in [40]. In addition, while no correlation between tremor indexes and temporal parameters was found in healthy controls, data extracted from MS subjects showed a positive correlation between TI2 and D2. This result suggested that more severe forms of intention tremor induce a progressive prolongation of the terminal period, due to the decreased accuracy in reaching the target and, consequently, to the increased need for final corrections [40].
A further finding of the present study was that the significant increase of TI2 was found for all X, Y and Z components. In keeping with the position of the sensor with respect to the anatomical axes of the hand (see figure 1), this result suggests that MS intention tremor induces wrist movements in all three directions, i.e. pronation–supination (X component), flexion–extension (Y) and adduction–abduction oscillations (Z). In a recent study [47], postural tremor directions were analyzed in subjects with essential and Parkinsonian tremor by considering only videotaped clinical examinations. Hence, to our knowledge, the present work represents the first attempt to quantify the directionality of intention tremor in MS, with instrumental objective measures that could provide further information potentially useful to analyze the functional impact of the three tremor components on different activities of daily living. Further studies are needed to explore this aspect.
It is noteworthy that the results of the present study show that the proposed HHT-based procedure detects subtle alterations not visible from the clinical FTRS score. In particular, analysis of the indexes extracted from the Z component of tremor reveals a statistically significant increase of TI2 also in MS_NT subjects who received an FTRS score equal to 0 (i.e. absence of intention tremor). A first hypothesis to explain this result could be the over-sensitiveness of the method which detects false positives due to low-frequency noise. However, in this case noise would be also present in healthy controls, thus reducing the differences found among groups. Moreover, noise would be present in both the first and the second part of the movement, without differences between TI1 and TI2. On the contrary, MS_NT subjects showed abnormal values of TI2 only. In addition, while CO subjects showed similar values of TI1 and TI2, MS_NT patients were characterized by a significant increase of TI2 with respect to TI1, in line with the clinical definition of intention tremor and similar to MS_T subjects. Following these considerations, a second hypothesis can be formulated, i.e. MS subjects manifest, already at an early stage, mild but significant wrist adduction–abduction intention tremor, not detectable from clinical visual examination. This hypothesis is enforced by similar results found in a previous study [46]. Although further investigations are needed, it can be speculated that the high sensitivity of the proposed method in detecting subclinical intention tremor could be potentially helpful in choosing a suitable preventive intervention to slow down the worsening of this disorder and to monitor its progression starting from the early stages of the disease.
The results of the correlation analysis revealed that TI2 extracted from X and Y components was significantly correlated with the FTRS score, thus suggesting that the proposed method is a valid tool for quantifying upper limb intention tremor in persons with MS. With respect to clinical scales which suffer from subjectivity, limited resolution, and the floor/ceiling effect [5, 7, 48], the main advantage of the proposed instrumental method is that it provides an objective and continuous measure of intention tremor, which can supplement the clinical analysis of this sign.
An important point that must be discussed, regards the fact that MS intention tremor is frequently embedded in a complex movement disorder, called ataxia, which often includes dysmetria, dyssynergia and dysdiadochokinesia [31]. In particular, the interplay between pure intention tremor and dysmetria (i.e. lack of accuracy in reaching an aimed target) makes the independent quantification of these two disorders difficult [49]. Indeed, this issue is clinically relevant, as a treatment aimed at alleviating upper limb tremor could have no influence on other components of ataxia [38, 49, 50]. On the basis of these aspects, the proposed HHT-based procedure seems a good candidate for the separation of the ataxic components in MS, as it allows for the extraction of multiple IMFs, which can be associated to different MS signs. Further studies are warranted to explore this aspect.
With respect to the HHT-based method, the applied traditional filters (BBPF1 and BBPF2) were able to detect fewer differences among the three groups. More importantly, no significant correlation was found between FTRS ratings and tremor indexes. Although linear filtering is still the most common technique used for tremor estimation in clinical studies, several factors must be properly set to maximize the filter's performance, with particular attention to the cutoff frequencies [29]. In particular, the pass-bands used in the present study (i.e. (1–7) Hz and (2–6) Hz) were carefully defined according to previous studies on MS intention tremor [7, 31, 38], but their automatic application to all tested subjects led to the drawbacks well described in the example reported in figure 5. As can be seen from figure 5(c), the HHT-based method was able to effectively extract tremor from the two representative subjects (CO7 and MS_T3) shown in figures 5(a), (b). In particular, the tremor related to subject MS_T3 was characterized by frequencies around 1.5 Hz and by a higher amplitude with respect to the healthy control CO7. An opposite result was obtained by applying the two band-pass filters. As shown in figure 5(d), BBPF1 (pass-band: 1–7 Hz) was able to detect the tremor related to the MS patient, but induced a significant overestimation of tremulous oscillations in subject CO7. This could be ascribed to the inclusion, in the tremor estimate, of some frequency components of voluntary movement that are around 1 Hz. This problem is reduced by using BBPF2 with a pass-band between 2 and 6 Hz (see figure 5(e)). However, the application of this filter induced a dramatic attenuation of the tremor estimated from MS_T3, as its frequency (1.5 Hz) was outside the pass-band. This example confirmed that the pass-band of linear filters must be accurately chosen according to the specific dominant frequency of the tremor related to each subject, which is, indeed, difficult to automatically identify from the multi-peak power spectra typical of MS tremor [36, 38]. Taken together, these results suggested that, compared to commonly used linear filtering, HHT is a more suitable technique to automatically extract MS intention tremor from gyroscope data.
There are some limitations that must be addressed regarding the present study. A first limitation is the small number of subjects included in the study. The proposed procedure should be applied on a greater number of patients in order to confirm these preliminary results about MS and to extend tremor analysis to other pathologies, such as essential tremor and Parkinson's disease. Future studies are also needed to test the reliability of the proposed parameters. A further limitation concerns the EMD algorithm itself, which suffers from mode-mixing. As described in [51], mode mixing occurs (1) when a single IMF consists of signals with widely disparate time-scales, or (2) when a signal of a similar scale resides in different IMFs. The complete elimination of this drawback is indeed impossible, but it can be alleviated by considering some methodological issues. As suggested by Rilling et al [35], over-decomposition should be avoided by choosing a suitable stopping criterion. In particular, imposing a too low threshold for terminating the iteration process leads to over-iteration that could increase mode-mixing and drain the physical meaning of each IMF, while using a too high threshold does not yield enough IMFs to separate different time scales. In the present study, a stopping threshold equal to 0.005 was chosen, as it provided the best compromise between these two aspects. Indeed, this value was lower than the typical threshold of 0.05, suggested in [35] and applied by Bonnet et al [25] and Mellone et al [29]. This difference could be ascribed to the sampling frequency used in these studies (i.e. 100 Hz), that was higher than that characterizing our sensor (i.e. 50 Hz). Although sampling at 50 Hz was considered adequate for the signals analyzed here, as they have a band-width well below 25 Hz, the use of a higher frequency could improve the performance of the HHT-based method. In fact, a fair amount of over-sampling is suggested by Rilling et al [35], to correctly identify extrema and reduce mode-mixing. Another way to alleviate mode-mixing is to apply the ensemble EMD procedure (EEMD), which is a noise-assisted technique developed by Wu and Huang [51], recently applied by Gallego et al [44] to extract tremor from four subjects with essential and Parkinsonian tremor. As discussed in [29], the EEMD introduces two further parameters for the decomposition: the number of ensembles, and the noise amplitude that must be properly selected. Moreover, modes obtained with EEMD are not necessarily IMFs; in this case the Hilbert spectral analysis may not be feasible. For these reasons, the original EMD method was chosen in the present work, but further improvements of the proposed procedure could be investigated in future studies. Finally, the performance of the proposed HHT-based method was compared to those of traditional band-pass filters. This preliminary comparison was performed as linear filters are still the most commonly used in clinical studies although they are not the most adequate (see also Mellone et al [29]). Considering the non-stationarity and non-linearity of tremor, the comparison between the proposed procedure and other nonlinear methods for signal decomposition [27, 28] should be addressed in future studies.
5. Conclusion
The present study showed that the proposed HHT-based method is able to discriminate between healthy controls and MS subjects with intention tremor, and to detect subtle alterations in MS subjects without a clinically-detected tremor which deserve further investigations. The validity of the proposed indexes for quantifying MS intention tremor was also demonstrated. Compared to more conventional methods based on the Fourier transform, the proposed procedure has two main advantages: (i) it allows for the automated extraction of tremor without any knowledge about the dominant frequency of the tremor specific of each single subject, and (ii) it provides a clearer separation between tremor and voluntary movement, which is essential to study the multiple components of MS tremor. In conclusion, the present results support the use of the proposed instrumental method as a quick and easy-to-use tool for an automated objective and quantitative assessment of intention tremor in MS.
Conflict of interest
The authors declare that they have no competing interests.
Acknowledgments
This work was supported by funding from Italian Ministry of Health (Ricerca Corrente and Ricerca Finalizzata GR-2009-1604984).