
Abstract
Objective. Diagnosing epilepsy still requires visual interpretation of electroencephalography (EEG) and magnetoencephalography (MEG) by specialists, which prevents quantification and standardization of diagnosis. Previous studies proposed automated diagnosis by combining various features from EEG and MEG, such as relative power (Power) and functional connectivity (FC). However, the usefulness of interictal phase–amplitude coupling (PAC) in diagnosing epilepsy is still unknown. We hypothesized that resting-state PAC would be different for patients with epilepsy in the interictal state and for healthy participants such that it would improve discrimination between the groups. Approach. We obtained resting-state MEG and magnetic resonance imaging (MRI) in 90 patients with epilepsy during their preoperative evaluation and in 90 healthy participants. We used the cortical currents estimated from MEG and MRI to calculate Power in the δ (1–3 Hz), θ (4–7 Hz), α (8–13 Hz), β (13–30 Hz), low γ (35–55 Hz), and high γ (65–90 Hz) bands and FC in the θ band. PAC was evaluated using the synchronization index (SI) for eight frequency band pairs: the phases of δ, θ, α, and β and the amplitudes of low and high γ. First, we compared the mean SI values for the patients with epilepsy and the healthy participants. Then, using features such as PAC, Power, FC, and features extracted by deep learning (DL) individually or combined, we tested whether PAC improves discrimination accuracy for the two groups. Main results. The mean SI values were significantly different for the patients with epilepsy and the healthy participants. The SI value difference was highest for θ/low γ in the temporal lobe. Discrimination accuracy was the highest, at 90%, using the combination of PAC and DL. Significance. Abnormal PAC characterized the patients with epilepsy in the interictal state compared with the healthy participants, potentially improving the discrimination of epilepsy.
Export citation and abstract BibTeX RIS

Original content from this work may be used under the terms of the Creative Commons Attribution 4.0 license. Any further distribution of this work must maintain attribution to the author(s) and the title of the work, journal citation and DOI.
1. Introduction
Epilepsy is an increasingly common disease, especially in countries with aging populations [1, 2]. However, the diagnosis of epilepsy requires effort in two respects. First, the diagnosis of epilepsy requires a multidisciplinary approach that incorporates clinical history, semiology, and various neuroimaging and neurophysiological tests, including electroencephalography (EEG) and magnetoencephalography (MEG). Second, the professional interpretation of waveforms is needed for the diagnosis of epilepsy. To make the diagnosis of epilepsy using EEG/MEG quantifiable and accurate without professional interpretation, previous studies have explored various electrophysiological features of the EEG/MEG signals that contribute to seizure detection and have applied those features in machine learning for automatic diagnosis [3–6].
Power [7, 8], functional connectivity (FC) [9], spike [10, 11], and entropy [12, 13] from EEG/MEG in the interictal state are all well known to be useful in diagnosing epilepsy. For example, Soriano et al [14] used MEG data from which all epileptic discharges were removed to identify epileptic biomarkers in resting-state interictal brain activity. They used relative power, total power, the phase locking value, and the phase lag index in the machine learning algorithm. The highest discriminatory accuracy (90.5%) was observed when relative power was used to discriminate 28 epilepsy patients from 14 healthy participants. A previous report using power discriminated patients from healthy participants with an accuracy of more than 90% [15], but the population was not large, so generalizability was limited.
Recently, deep convolutional neural networks (DCNNs) have been applied to a large number of EEG/MEG signals and have achieved higher accuracy in identifying epileptic waveforms [16] and in discriminating epilepsy patients from healthy participants than machine learning methods using previously known features [17]. The improved accuracy has partly been attributed to the novel electrophysiological features learned by the DCNN from EEG/MEG data. However, it is difficult for humans to understand what the features learned by the DCNN are. To improve the automated diagnosis of epilepsy, machine learning must be applied to a large cohort of patients with various types of epilepsy using the novel electrophysiological features of the interictal state that we can understand.
Phase–amplitude coupling (PAC) is a measure of the synchronization between the amplitude of the high-frequency bands and the phase of the low-frequency bands during information processing in normal brain functions [18]. Couplings between the low- and high-frequency bands have been reported to relate to seizure dynamics [19–21]. Ibrahim et al [19] showed that in the ictal state and in the seizure onset zone (SOZ), the phase of the low-frequency bands, such as θ and α, modulated the amplitude of the high-frequency bands. In particular, the strength of PAC increased more in the SOZ than in the non-SOZ, which helped to identify the SOZ [22, 23]. In addition, couplings between the β phase and γ amplitude were demonstrated to be useful in discriminating ictal and interictal states [24, 25]. However, whether PAC in the interictal state is abnormal in epilepsy patients and could therefore be used to discriminate epilepsy patients from healthy participants has not been examined.
In this study, we hypothesized that PAC in the resting state is abnormal in epilepsy patients in the interictal states compared to healthy participants, and therefore, PAC could improve the discrimination between the two groups together with other features such as relative power (Power), FC, and the features extracted by deep learning (DL) from the estimated cortical current.
2. Materials and methods
To test our hypothesis, we analyzed MEG signals obtained during the resting state in 90 patients with various types of epilepsy and in 90 healthy participants. Notably, we included various types of epilepsy to identify characteristics of the interictal MEG signals commonly observed across the different types of epilepsy. Figure 1 shows the experimental paradigm. First, we estimated cortical currents from the MEG signals to extract three MEG features: relative power (Power), FC, and PAC. A trained epileptologist also independently evaluated the raw MEG signals to identify interictal epileptic discharges. Subsequently, the PACs of each estimated cortical current in the epilepsy patients and the healthy participants were compared for each lobe and for frequency band pair. We then used a shallow neural network with Power, FC, or PAC individually or in combination as input to identify the features that contributed most to discriminating the epilepsy patients from the healthy participants. Finally, we applied a DCNN model called MNet to discriminate the groups based on the estimated cortical currents; PAC, Power, or FC was or was not added to the final fully connected layer of MNet to investigate whether the addition of PAC, compared to the DL model with or without other features, would improve the accuracy of epilepsy identification. The improved accuracy with PAC suggested that PAC was not part of the features learned by MNet and is an electrophysiological feature that will improve automated diagnosis.
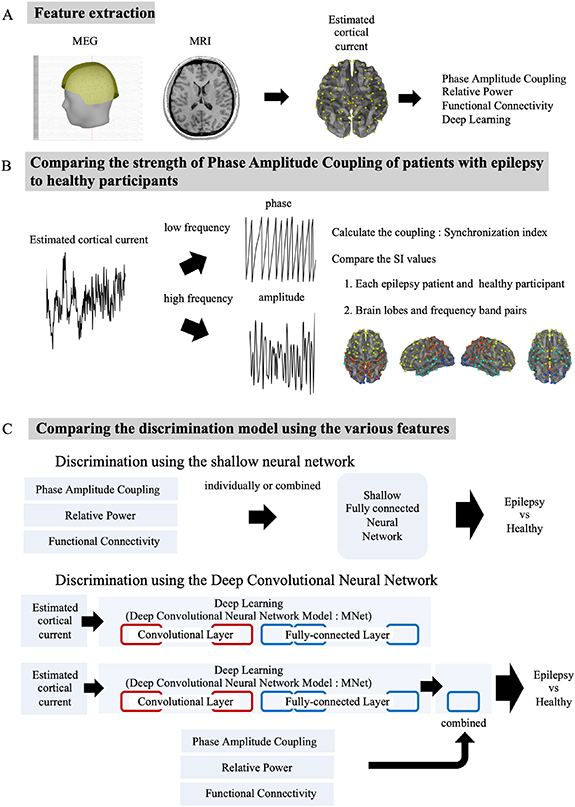
Figure 1. Experimental paradigm. (A) First, we extracted features. We aligned MEG and magnetic resonance imaging (MRI) to calculate the estimated cortical current. Then, we calculated PAC, relative power (Power), and FC and used them as the input of DL. (B) Next, to compare the strength of PAC, we calculated the synchronization index (SI). Then, a comparison of the SI values was performed between groups or the difference of two groups among brain lobes and frequency band pairs. (C) Finally, to understand the effectiveness of PAC in the automated diagnosis of epilepsy, we compared the accuracy of discriminating epilepsy patients from healthy participants when using PAC alone; each of the other features alone; the features combined with PAC, Power, FC, and a DL model using the estimated cortical currents; and a DL model combined with PAC, Power, and FC.
Download figure:
Standard image High-resolution image2.1. Participants
Between 2012 and 2018, our study enrolled 90 epilepsy patients and 90 healthy participants at our hospital (table 1). The epilepsy patients had been diagnosed by specialists based on symptoms, EEG, and neuroimaging and between 2012 and 2018 underwent MEG during their preoperative evaluation. The patients had mainly temporal lobe epilepsy, but other types of epilepsy were represented. Healthy participants had to meet these criteria: no past clinical history or symptoms of a neurologic disease, no routine use of medications, and appropriate cognitive function according to the Japanese Adult Reading Test. The mean age was approximately 30 years in the epilepsy patients and healthy participants who contributed test data (27.4 years [range: 14–51 years] vs 32.2 years [range: 18–67 years], respectively; P = 0.78, Wilcoxon rank sum test). The healthy participants who contributed training data were older than the patients who contributed training data (54.0 years [range: 20–86 years] vs 29.0 years [range: 7–59 years]; P < 0.0001, Wilcoxon rank sum test). Most patients were classified as having focal epilepsy originating in the temporal lobe. The MEG measurements from each patient were visually evaluated by an epileptologist. In 41% (training data) and 30% (test data) of patients, interictal epileptiform discharges (IEDs) were observed during MEG measurements.
Table 1. Participant characteristics.
| Training data | Test data | ||||
|---|---|---|---|---|---|
| Epilepsy patients | Healthy participants | Epilepsy patients | Healthy participants | ||
| Age (years) | Mean ± S.D. | 29.0 ± 13.2 | 54.0 ± 18.1 | 27.4 ± 10.6 | 32.2 ± 17.2 |
| Sex (n) | Female | 40 | 41 | 7 | 5 |
| Male | 40 | 39 | 3 | 5 | |
| Epilepsy type (n) | Temporal lobe | 71 | — | 7 | — |
| Frontal lobe | 2 | — | 2 | — | |
| Parietal lobe | 2 | — | 0 | — | |
| Unknown | 5 | — | 1 | — | |
| IEDs present (n) | 33 | — | 3 | — | |
| Antiepileptic drugs (n) | Mean ± S.D. | 2.6 ± 1.1 | — | 2.2 ± 0.9 | — |
| Sleep stage (n) | Awake | 70 | 78 | 9 | 9 |
| N1 | 1 | 2 | 0 | 1 | |
| Unclassified | 9 | 0 | 1 | 0 | |
S.D. = standard deviation; IED = interictal epileptiform discharge.
2.2. Data acquisition and preprocessing
Measurements were performed using a 160-channel whole-head MEG unit equipped with coaxial-type gradiometers housed in a magnetically shielded room (MEG vision NEO: Yokogawa Electric Corporation, Kanazawa, Japan). Each patient and healthy participant took part in multiple sessions measuring resting-state MEG signals. Each participant's sessions took place during a single day, and the participants were asked to close their eyes and relax during the measurements. It should be noted that the epilepsy patients were instructed to be free to sleep, although the healthy participants were instructed not to sleep during the measurements. For the epilepsy patients, the measurements consisted of five to seven sessions of either 240 s or 300 s. To avoid the sleeping stage, the first session was used for the analysis in the epilepsy patients. The healthy participants were measured for a single session of either 300 s. The sampling rate was set to 1 kHz or 2 kHz. The recording bandpass was 0.1–500 Hz. A FastSCAN Cobra handheld laser scanner (Polhemus, Colchester, VT, USA) was used to measure the three-dimensional shape of each participant's face. MEG measurements were then recorded with five marker coils attached to the face.
The MEG measurements were filtered at 0.1 Hz (high-pass) and 500 Hz (low-pass). The infomax algorithm, which used the function rucina.m from the EEGLAB toolbox (Swartz Center for Computational Neuroscience, UC San Diego, La Jolla, CA, USA), was applied in independent component analysis to remove noise from eye movements and cardiac pulses. Residual noise, such as that from muscle artifacts and the environment, was then visually removed. A bandstop filter at 60 Hz with a width of 0.5 Hz was applied to remove powerline noise. This preprocessing was performed in Brainstorm (https://neuroimage.usc.edu/brainstorm/) [26].
We obtained T1-weighted magnetic resonance imaging (MRI) images of each participant's head using a 3.0T MRI scanner (Sigma 3.0T: GE Medical Systems, Chicago, IL, USA). Scalps and the brain cortex were demarcated on the MRI images by FreeSurfer software (http://surfer.nmr.mgh.harvard.edu/) [27]. The resulting data were aligned with the MEG sensor locations using the three-dimensional data for the face and five marker locations.
We evaluated sleep stage by visual examination of the raw MEG signals [28]. Rhythmic alpha waves of 8–13 Hz predominating in the bilateral occipital lobes was accepted as the 'awake' stage; a decrease in amplitude and disappearance of alpha waves in the bilateral occipital lobes and the presence of vertex sharpness in the central region was accepted as the N1 stage. The appearance of K-complex waves and sleep spindles was accepted as the N2 stage.
2.2.1. Feature extraction
Using Brainstorm, individual cortical surfaces from the MEG sensor data were downsampled to approximately 15 000 triangular vertices (default parameter in Brainstorm). We then applied Brainstorm's multi-linear registration to match those vertex locations to FreeSurfer's average anatomy (15 002 vertices) [29]. The estimated cortical current at the 15 002 points was calculated using the minimum norm method [30]. The estimated 15 002 points were then randomly resolved to 160 points (supplementary figure 1 available online at stacks.iop.org/JNE/19/026056/mmedia). The measurement data—approximately 240–300 s per patient—were then separated into 2400 ms segments without overlap at each estimated point. To remove edge effects, two segments (4800 ms) at the beginning and end were discarded. These data were adjusted to a minimum of approximately 67 datasets per person.
The power density spectrum of each 2400 ms segment was computed using the fast Fourier transform (fft function in MATLAB R2020b (MathWorks, Natick, MA, USA)). The frequencies of interest were six frequency band pairs: 1–3 Hz (δ), 4–7 Hz (θ), 8–13 Hz (α), 13–30 Hz (β), 35–55 Hz (low γ), and 65–90 Hz (high γ). The power in each channel was divided by the total power spectral density in that channel to obtain Power. The Powers of all six frequency bands were used as input to the shallow neural network.
FC describes the phase relationship between cortical regions. We used the Desikan–Killiany atlas to allocate the estimated cortical currents into 68 regions of interest (ROIs) because the combination of 160 channels was too large to use as the input of the neural network. We extracted a single time course with principal component analysis for each ROI [31, 32]. Source leakage was corrected by applying the closest orthogonalization matrix for each ROI. The amplitude envelope correlation of each 2400 ms segment was estimated as the amplitude coupling between ROIs using a linear correlation of the envelope for the bandpass filtered signal (with the run_individual_network_analysis.m function in MEG-ROI-nets) [33]. We used the FC of the θ band as input for discrimination by the neural network because this measure has been reported to be a useful marker for diagnosis [5, 9].
The synchronization index (SI) was used to evaluate the strength of the PAC between the amplitude in the high-frequency band and the phase in the low-frequency band [34]. First, power spectral density was calculated to check the clear peaks in the low-frequency bands of δ, θ, α, and β. Next, the bandpass filter was used to estimate cortical currents using a two-way least-squares finite impulse response filter (pop_eegfiltnew.m from the EEGlab toolbox). Then, the Hilbert transformation was performed on the bandpass filtered signals to obtain the low-frequency phase ( ) and high-frequency amplitude. Afterwards, the Hilbert transformation was performed to obtain the analytic phase at time point t (
 ). SI values were calculated using equation (1):
where N is the number of time points for analysis in each time segment (2400 ms). SI values vary within the range of 0–1, with 0 indicating that the phases are completely desynchronized and 1 indicating that the phases are completely synchronized. Details can be found in earlier papers [24, 34]. We calculated SI values for a total of eight different frequency band pairs for every 160 estimated cortical currents. Notably, we obtained at least 67 SI values for each frequency band pair of each of 160 cortical currents for each patient or participant. The averaged SI values were used as the SI values of the frequency band pairs of the cortical current.
To confirm whether the SI values were statistically significant, we partitioned the 2400 ms time segment into two segments at a randomly selected time point and permutated the segments only for the phase to calculate the SI values with the shuffled phase (shuffled SI values). We calculated the shuffled SI values 400 times and averaged the shuffled SI values to estimate the SI values by chance. We compared the SI values and the shuffled SI values for all time segments of each frequency band pair of each cortical current (false discovery rate (FDR)-corrected Student's t-test) to evaluate whether the obtained SI values were statistically significant. Subsequently, the phase and amplitude of each band were described as phase/amplitude. For example, the coupling of the phase in the θ band and amplitude in the high γ band is expressed as θ/high γ. These three features were analyzed using MATLAB R2020b.
2.3. Comparing the SI values of epilepsy patients to those of healthy participants
We compared the PAC strengths of epilepsy patients and healthy participants in the following ways: first, we compared the PAC between epilepsy patients and healthy participants. The SI values of the 2400 ms segments were averaged for all segments in each patient to obtain 160 averaged SI values that corresponded to each cortical current. Then, we averaged the SI values of 160 cortical currents for each frequency band pair per patient and healthy participant. Second, we compared the PAC of different anatomical regions. We classified the 160 cortical currents into brain lobes according to the Desikan–Killiany atlas. To compare the PAC of the frontal, temporal, parietal, and occipital lobes, we averaged the SI values of each lobe for each frequency band pair per patient and healthy participant. In addition, we examined Power in the same way to compare the patients and healthy participants regarding each anatomical region.
2.4. Discrimination of MEG features between epilepsy patients and healthy participants
2.4.1. Discrimination using a shallow neural network
To compare the MEG features in the discrimination of epilepsy patients and healthy participants, we used a shallow neural network. The model was implanted using the TensorFlow framework. One of the three features (PAC, Power, FC) or the combination of all three features (PAC + Power + FC) was used as input to the shallow neural network. The shallow network discriminated the epilepsy patients and healthy participants based on the MEG features of each segment. The network consisted of an input layer, a batch normalization layer, and one fully connected layer. The layer sizes were the same and depended on the input size (PAC: 1280, Power: 960, FC: 2278). Regarding PAC, there were 1280 SI values consisting of the SI values of 160 cortical currents for eight frequency band pairs (δ/low γ, θ/low γ, α/low γ, β/low γ, δ/high γ, θ/high γ, α/high γ and β/high γ). Regarding Power, 960 Power values were calculated from 160 cortical currents for six frequency bands (δ, θ, α, β, low γ and high γ). Regarding FC, FC in the θ band was evaluated for all pairs of 68 ROIs.
We divided the data into two groups to evaluate the accuracy of the shallow neural network in discriminating epilepsy patients and healthy participants (supplementary figure 2). First, patients and healthy participants were randomly allocated to training data (n = 80) and to test data (n = 10). We selected test data such that the ages of the epilepsy patients and healthy participants were matched, allowing the model to attempt the discrimination in the absence of age differences. Next, a ten-fold cross-validation was performed within the training data to obtain the optimal parameters of the neural network. Data from 72 epilepsy patients and 72 healthy participants were used to train the neural network, and data from eight patients and eight healthy participants were used for validation. In a grid search to determine the best network parameters, we selected 0.01, 0.001, or 0.0001 as the learning rate; 64, 128, or 256 as the batch size; and stochastic gradient descent [35] or Adam [36] as the optimizer. Using the optimal network parameters, the model was trained on the training data (80 epilepsy patients, 80 healthy participants) and evaluated using the test data.
The discrimination accuracy was calculated as follows: first, the shallow neural network discriminated between the epilepsy patients and healthy participants for each 2400 ms segment. Then, we analyzed the results of its discrimination among all 67 segments for each patient and participant. The most frequent discrimination result for a patient or participant was taken as the discrimination result for the patient or participant. Finally, the discrimination accuracy was determined by how many of the ten epilepsy patients and ten healthy participants in the test data were correctly judged to be epilepsy patients or healthy participants. The accuracies of the discriminative models were also evaluated by the area under the curve (AUC). Epilepsy types in the training and test data were assigned to have similar distributions (table 1). We selected test data from age-matched healthy participants.
2.5. Discrimination using a deep convolutional neural network (DCNN)
We applied a DCNN to discriminate epilepsy patients and healthy participants using the 160 cortical currents estimated from MEG signals. We used the DCNN model MNet, which classifies neurological diseases based on multichannel neurophysiological raw signals [17]. Table 2 shows the details of the network structure. The estimated cortical currents of each segment (2400 ms, 160 cortical currents) were entered into MNet. Two convolutional layers were applied to extract the spatially global features of the 160 cortical currents. We then swapped the axes to treat the data as an image in the time and frequency domains [37, 38], and we applied two more convolutional layers. Finally, after three fully connected layers were applied, the softmax function determined the probability for each class. A rectified linear unit was applied to each layer.
Table 2. Detailed configuration of MNet.
| Layer | Kernel size | Stride | Filters (n) | Data shape |
|---|---|---|---|---|
| Input | — | — | — | (1, 160, 1200) |
| Conv1 | (160, 16) | (1, 2) | 32 | (32, 1, 593) |
| Conv2 | (1, 4) | (1, 2) | 64 | (64, 1, 295) |
| Pool1 | (1, 2) | (1, 2) | — | (64, 1, 148) |
| Swap axes | — | — | — | (1, 64, 148) |
| Conv3 | (8, 8) | (1, 1) | 32 | (32, 57, 141) |
| Conv4 | (8, 8) | (1, 1) | 32 | (32, 50, 134) |
| Pool2 | (5, 3) | (5, 3) | — | (32, 10, 44) |
| Conv5 | (1, 4) | (1, 1) | 64 | (64, 10, 41) |
| Conv6 | (1, 4) | (1, 1) | 64 | (64, 10, 38) |
| Pool3 | (1, 2) | (1, 2) | — | (64, 10, 19) |
| Conv7 | (1, 2) | (1, 1) | 128 | (128, 10, 18) |
| Conv8 | (1, 2) | (1, 1) | 128 | (128, 10, 17) |
| Pool4 | (1, 2) | (1, 2) | — | (128, 10, 8) |
| Conv9 | (1, 2) | (1, 1) | 256 | (256, 10, 7) |
| Conv10 | (1, 2) | (1, 1) | 256 | (256, 10, 6) |
| Pool5 | (1, 2) | (1, 2) | — | (256, 10, 3) |
| Fc11 | — | — | 1024 | (1024) |
| Fc12 | — | — | 1024 | (1024) |
| Fc13 | — | — | # of classes | (# of classes) |
Conv = convolution; Pool = max pooling; Fc = fully connected.
The method used to evaluate the accuracy with which MNet discriminated epilepsy patients and healthy participants was the same as that used to evaluate the shallow neural network (supplementary figure 2). First, the patients and healthy participants were randomly allocated to training data (n = 80) and to test data (n = 10). Next, a ten-fold cross-validation was performed in the inner loop within the training data to obtain the optimal parameters of the neural network. We selected the following network parameters: the method of standardization (average of 0 and variance of 1, using all channels or each channel); the learning rate (10−1, 10−2, and 10−3); and the batch size (64, 128, and 256). Data from 72 epilepsy patients and 72 healthy participants were used to train the neural network, and data from eight patients and eight healthy participants were used for validation. Using the optimal network parameters, the model was trained on the training data (80 epilepsy patients, 80 healthy participants) and evaluated using the test data. These allocations were the same as those using the shallow neural network.
To investigate whether MNet could use PAC as a valuable feature for identifying epilepsy, we added the SI values of all eight frequency band pairs to the final fully connected layer of MNet and compared the discrimination accuracy with and without these values. SI values corresponding to the same 2400 ms segment were concatenated at the fully connected layer. For comparison, Power and FC were added to the final fully connected layer of MNet. The discrimination accuracy was determined by how many of the ten epilepsy patients and ten healthy participants in the test data were correctly judged to be epilepsy patients or healthy participants. The accuracies of the discriminative models were also evaluated by AUC. All calculations were performed in Python (Python 3.6.9 [TensorFlow-gpu 2.1.0, scikit-learn 0.23.2, matplotlib 3.3.0, numpy 1.18.1, pandas 1.1.0, scipy 1.5.2, seaborn 0.11.1]).
2.6. Statistical analysis
The statistical analysis was performed by the JMP software application (JMP Pro 14, SAS Institute, Cary, NC, USA). The significance level for P was set at 0.05. Sample size was calculated by G*Power software application [39]. We set the parameter of a priori power analysis (the required power 0.8, the pre-specified significance level 0.05, estimated effect size measure 0.50) to calculate the sample size of 67 patients and participants. We decided that 90 patients and 90 participants were enough to compare the strength of PAC in epilepsy patients and healthy participants for this study.
The bootstrapping technique was used to confirm whether the SI values were statistically significant. This procedure was run 400 times to create the distribution of shuffled SI values. FDR was used to adjust the P value in multiple comparisons. We used the Wilcoxon rank sum test to compare MEG features among groups: SI values in epilepsy patients and in healthy participants; SI values in patients with and without IED data; and SI values between individuals of selected ages. Bonferroni correction was used to adjust the P value in cases of multiple comparisons.
One-way analysis of variance (ANOVA) was applied for SI values in eight frequency band pairs and the number of antiepileptic drugs.
Two-way ANOVA was applied for SI values in the eight frequency band pairs or Power in six frequency bands and the four brain lobes. The Steel–Dwass method was used for multiple comparisons between the groups as a post hoc test.
To evaluate the discriminant model of the neural network, receiver operating characteristic curves were plotted for the discrimination accuracy of the patients and healthy participants.
3. Results
3.1. Abnormal PAC in the interictal state in epilepsy patients
First, we evaluated power spectral density to confirm some peaks at δ, θ, α, and β. The power spectral density averaged among all electrodes of all subjects with and without epilepsy demonstrated some peaks in the δ, θ, α, and β bands (figure 2). The distributions of shuffled SI values and true SI values are shown in supplementary figure 3. The true SI values of all frequency band pairs were statistically significant compared with the shuffled SI values (P< 0.01, FDR). PAC in the resting state differed significantly between the epilepsy patients and the healthy participants. We compared averaged SI values for the estimated cortical currents across the entire cortex between 90 patients and 90 healthy participants (figure 3). Compared with the healthy participants, the epilepsy patients showed significantly larger SI values for θ/low γ (P < 0.0001) and θ/high γ (P < 0.001) and significantly smaller values for δ/low γ band pairs (P = 0.0039, Wilcoxon rank sum test, Bonferroni correction).
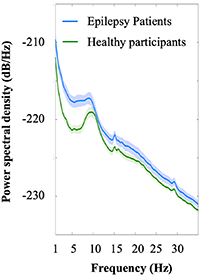
Figure 2. Power spectral density for low-frequency bands. Power spectral density is shown in low-frequency bands (δ, θ, α, and β) to check the peaks to calculate PAC (epilepsy patients, blue; healthy participants, green). A light color indicates the 95% confidence interval. The peaks in both groups were 1 Hz for δ, 7 Hz for θ, 10 Hz for α, and 16 Hz for β.
Download figure:
Standard image High-resolution image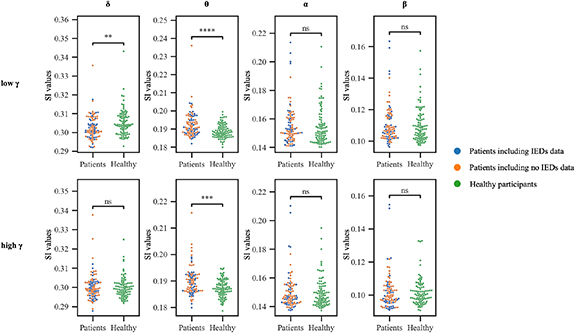
Figure 3. Synchronization index (SI) values for each frequency band pair in epilepsy patients and healthy participants. SI values for θ/low γ and θ/high γ were higher in patients (patients, blue and orange) than in healthy participants (healthy, green)—****P < 0.0001, ***P < 0.001 by Wilcoxon rank sum tests. SI values for δ/low γ band pairs were higher in healthy participants than in patients (**P < 0.01 by Wilcoxon rank sum tests). No significant differences were evident between the patients with IEDs (blue) and those with no IEDs (orange): δ/low γ, P = 0.82; θ/low γ, P = 0.62; α/low γ, P = 0.85; β/low γ, P = 0.54; δ/high γ, P = 0.76; θ/high γ, P = 0.43; α/high γ, P = 0.60; β/high γ, P = 0.10 (Wilcoxon rank sum tests).
Download figure:
Standard image High-resolution imageIn addition, the SI values were compared with some possible confounding factors. To examine the effect of IEDs on SI values, we compared patients in whom the MEG data did and did not contain IEDs. No differences in the SI values of any frequency band pairs were observed between these groups (δ/low γ, P = 0.82; θ/low γ, P = 0.62; α/low γ, P = 0.85; β/low γ, P = 0.54; δ/high γ, P = 0.76; θ/high γ, P = 0.43; α/high γ, P = 0.60; β/high γ, P = 0.10; all Wilcoxon rank sum tests). To examine the effect of antiepileptic drugs on SI values, we compared the SI values of each frequency band pair with the number of antiepileptic drugs that the patients used. No differences in the SI values of any frequency band pairs were observed among the groups taking different numbers of antiepileptic drugs (δ/low γ, P = 0.67; θ/low γ, P = 0.50; α/low γ, P = 0.12; β/low γ, P = 0.19; δ/high γ, P = 0.73; θ/high γ, P = 0.10; α/high γ, P = 0.17; β/high γ, P = 0.21; one-way ANOVA, supplementary figure 4).
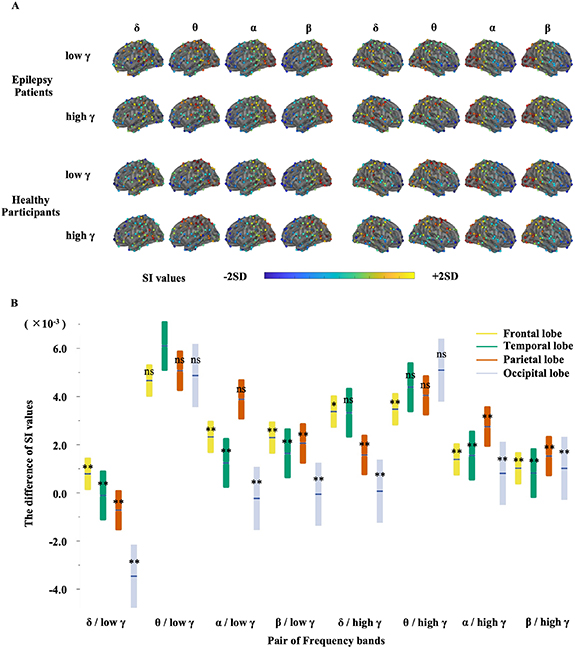
Differences in the SI values for the patients and healthy participants varied depending on the frequency band pairs and spatial distribution (figure 4(A)). These differences were evaluated by two-way ANOVA for eight pairs of frequency bands (δ, θ, α, and β phases and low γ and high γ amplitudes) and for four brain lobes (frontal, temporal, parietal, and occipital). The difference in the SI values changed significantly both for the frequency band pairs and for the brain lobes (frequency band pairs, P < 0.0001, F(7,1279) = 2.3 × 10; brain lobes, P = 0.0049, F(3,1279) = 4.3; interaction, P < 0.0001, F(21,1279) = 3.3; figure 4(B)), with the difference for θ/low γ in the temporal lobe being the largest (P < 0.001 for all lobes in δ/low γ, β/low γ, δ/high γ, and β/high γ and for the frontal, temporal, and occipital lobes in α/low γ and α/high γ, and P = 0.048 for the frontal lobe in θ/high γ, Steel–Dwass method). Notably, even for the patients with temporal lobe epilepsy, the SI value differences were significantly higher in the temporal lobe than in the other brain lobes for the θ-low γ PAC (δ-low γ: P= 0.51; θ-low γ: P= 0.017; and θ-high γ: P= 0.28; n = 78, Wilcoxon rank sum test; also see supplementary figure 5). For the other epilepsy types, the SI value differences in θ-low γ and θ-high γ tended to be larger in the lobe containing the SOZ than in other lobes, although not statistically significant (frontal lobe epilepsy [n = 4]: δ-low γ, P= 0.35; θ-low γ, P= 0.77; and θ-high γ, P= 0.19; parietal lobe epilepsy [n = 2]: δ-low γ, P= 0.42; θ-low γ, P= 0.089; and θ-high γ, P= 0.31; Wilcoxon rank sum test). Based on resting-state MEG signals, SI value differences for θ/low γ in the temporal lobe characterized the interictal state in the patients compared with the healthy participants. Power of epilepsy patients and healthy participants also differed among frequency band and spatial distribution (supplementary figure 6). The difference in θ band Power in the temporal lobe was higher than the differences in all other lobes (P < 0.05), except for the difference in δ band Power in the parietal lobe (P = 0.09) and α band Power in the temporal lobe (P = 0.10, Steel–Dwass method).
Figure 4. Spatial and frequency distribution of synchronization index (SI) values in epilepsy patients and in healthy participants. (A) Spatial distribution of SI values for each frequency band pair between epilepsy patients and healthy participants. The SI values were averaged for each group per channel and are displayed using a color bar representing ±2SD. Visually, SI values for θ/low γ in the posterior temporal lobe are higher in epilepsy patients than in healthy participants. SI values for δ/low γ in the left posterior temporal lobe and θ/low γ in the parietal lobe are higher in healthy participants than in epilepsy patients. (B) This plot compares frequency band pairs and brain lobes (frontal lobe, yellow; temporal lobe, green; parietal lobe, red; occipital lobe, blue). The boundaries indicate the 95% confidence interval. The vertical line inside the box indicates the mean. SI values of θ/low γ in the temporal lobe are higher than SI values for all lobes in δ/low γ, β/low γ, δ/high γ, and β/high γ, the frontal, temporal, and occipital lobe in α/low γ and α/high γ (**P < 0.001), and the frontal lobe in θ/high γ (*P = 0.0048, Steel–Dwass method).
Download figure:
Standard image High-resolution image
It should be noted that the sleep stage during the MEG recordings was not significantly different between epilepsy patients and healthy participants (table 1). The N1 sleep stage was observed in one epilepsy patient and three healthy participants. Of the epilepsy patients, nine had unclear alpha waves, making assessment of their sleep stage difficult. No patient or participant reached sleep stage N2.
3.2. MEG features that discriminate epilepsy patients from healthy participants
To discriminate the patients from healthy participants, we used a shallow neural network with three MEG features: Power, FC, and PAC. Table 3 shows the resulting discrimination accuracy. The discrimination accuracy was highest using Power, among the three features. The addition of PAC to Power had the same discrimination accuracy as Power only (80%) but improved the AUC (Power: 0.81, Power + PAC: 0.91). It should be noted that PAC has high specificity but low sensitivity among the three features. Moreover, the combination of PAC, Power, and FC improved the discrimination accuracy compared with Power alone (Power: 80.0%, PAC + Power + FC: 85.0%; table 3). These results suggested that PAC improved the discrimination with the addition of other features.
Table 3. Discrimination accuracy of the shallow neural network model.
| Feature a | ||||||
|---|---|---|---|---|---|---|
| Power | PAC | FC | Power + PAC | Power + FC | PAC + Power + FC | |
| Discrimination accuracy | 80.0% | 70.0% | 70.0% | 80.0% | 80.0% | 85.0% |
| Sensitivity | 0.75 | 0.60 | 0.67 | 0.75 | 0.62 | 0.82 |
| Specificity | 0.90 | 0.90 | 0.80 | 0.90 | 0.50 | 0.90 |
| AUC | 0.81 | 0.76 | 0.70 | 0.91 | 0.67 | 0.82 |
Power = relative power; PAC = phase–amplitude coupling; FC = functional connectivity. aThe best parameters: batch size, 64 for Power, PAC, and FC, 256 for Power + PAC, Power + FC, and PAC + Power + FC; learning rate, 0.01 for all; optimizer, stochastic gradient descent for all.
3.3. DCNN for discriminating epilepsy patients from healthy participants
Although the discrimination adding PAC to other features was observed to be highly accurate, accuracy might be improved by using a DCNN with filters trained from the data that evaluates the raw cortical currents to extract features. We therefore applied the DCNN model MNet to the same estimated cortical currents from epilepsy patients and healthy participants. The trained MNet discriminated the groups with an accuracy of 85%, which was higher than the accuracy observed using the shallow neural network with a single type of feature (table 4, also see supplementary table 1 for the results using five-fold cross-validation). In addition, only when PAC was added to the final layer of MNet did the discrimination accuracy improve, as shown by the AUCs and sensitivity: MNet, 0.89 and 0.82; PAC + MNet, 0.93 and 0.90 (table 4). Notably, the specificity was the same for DL alone and for all combinations. These results suggested that PAC provided information for detecting and discriminating patients that was not extracted by the DL model.
Table 4. Discrimination accuracy of the DCNN model.
| Feature a | ||||
|---|---|---|---|---|
| DL | DL + PAC | DL + Power | DL + FC | |
| Discrimination accuracy | 85.0% | 90.0% | 85.0% | 75.0% |
| Sensitivity | 0.82 | 0.90 | 0.82 | 0.69 |
| Specificity | 0.90 | 0.90 | 0.90 | 0.90 |
| AUC | 0.89 | 0.93 | 0.93 | 0.86 |
Power = relative power; PAC = phase–amplitude coupling; FC = functional connectivity; DL = deep learning. aThe best parameters were standardized for each channel: batch size, 128; learning rate, 0.01.
4. Discussion
In the present study, we revealed three points. First, an abnormal PAC in the resting state characterized epilepsy patients in the interictal state. The strength of resting-state PAC differed between epilepsy patients in the interictal state and healthy participants. The difference in SI values between the epilepsy patients and healthy participants was especially large for θ/low γ in the temporal lobe. Although previous studies demonstrated that PAC characterized epileptogenic zones [25, 40] and epileptic seizures [24], our report is the first to demonstrate abnormal PAC in patients in the interictal state. Second, the interictal PAC improved the automatic discrimination of epilepsy patients from healthy participants with the addition of other MEG features and the features extracted by the DCNN using estimated cortical currents. Moreover, the accuracy of the DL model increased when PAC was added compared with using Power, FC, or a DL model alone, suggesting that PAC captures information regarding different aspects of the known features of Power and FC and the features extracted by DL, which indicates the possibility of further improving the existing automated diagnosis model. Third, this study revealed that the generalizable features of MEG signals in our large cohort discriminated between epilepsy patients and healthy participants with a high accuracy of approximately 85%–90%.
Although the physiological mechanisms underlying abnormal PAC in epilepsy patients are unknown, PAC is known to contribute to various cortical functions and to be associated with various neurological diseases. Previous studies have demonstrated that PAC plays an important role in neural processing, such as in memory retention [41–43], visual processing [44, 45], and motor exercise [46, 47]. It has been suggested that the high-frequency band directly reflects the local functioning of the cortex, such as the motor cortex, and that the low-frequency band reflects coordination of the functioning of the entire cortical network. PAC has been reported to reflect the interactions between local cortical function and the cortical network [18]. In addition, some previous studies have suggested that resting-state PAC might indicate resting-state network activity [48–50]. Abnormal PAC might therefore be associated with dysfunction in resting-state networks. In epilepsy patients, abnormalities in resting-state networks observed using functional MRI have been reported in many studies [51–55]. Furthermore, abnormal PAC has been reported in the context of various neurological diseases, such as Parkinson's disease [37, 56], Alzheimer's disease [57, 58], autism spectrum disorder [59], essential tremor [60], and traumatic brain injury [61, 62]. The same diseases have also been reported to be associated with abnormal resting-state networks [63–68]. In epilepsy, PAC is also reported to be a biomarker that predicts postoperative seizure outcomes after corpus callosum dissection and cortical resection [25, 69]. PAC might thus reflect changes in resting-state network function that are attributable to neurological diseases and treatments.
Resting-state PAC might reflect characteristic activities in the SOZ. In the SOZ, high-frequency oscillations (HFO) such as γ rhythms of 30–80 Hz, ripples of 100–200 Hz, and fast ripples of 250–500 Hz have been reported to increase [70–72]. The production of HFO has been attributed to the synchronization of GABAergic interneurons and excitatory neurons, called principal neurons [20, 73]. Ripple and fast ripple production have been attributed mainly to the synchronized firing of principal neurons [74], although the production of γ oscillations has been attributed to GABAergic inhibitory neurons regulating the firing of principal neurons [75, 76]. Interictal PAC, especially the coupling of HFO and low-frequency activity was reported to be higher in the SOZ and lower in the pre-ictal phase [77–79]. In our results, θ-low γ PAC was highest at the temporal lobe, especially in the patients with temporal lobe epilepsy. In addition, although the limited number of patients meant that the differences were not statistically significant, θ-low γ and θ-high γ PAC tended to be larger in the SOZ than outside the SOZ. Those results suggest that PAC in the interictal state is increased in the SOZ.
A discussion of the mechanisms plausibly explaining the PAC difference between the various frequency band pairs is also important. Our hypothesis is that two mechanisms cause abnormal PAC: pathologic activity causes abnormal PAC, and epilepsy disrupts physiologic PAC. If pathologic activity causes abnormal PAC, an examination of epileptic spike coupled with slow wave is important. We compared the SI values for MEG signals with and without epileptic spikes to evaluate how epileptic spikes affect SI values. As shown in figure 3, no differences in PAC were evident between patients who had IEDs during measurements and those who did not (δ/low γ, P = 0.82; θ/low γ, P = 0.62; α/low γ, P = 0.85; β/low γ, P = 0.54; δ/high γ, P = 0.76; θ/high γ, P = 0.43; α/high γ, P = 0.60; β/high γ, P = 0.10; Wilcoxon rank sum test). This result suggests that abnormal PAC is not explained by the repetitive spikes. One possible explanation is that PAC in the interictal state increases in the SOZ. As shown in supplementary figure 5, the SI value differences in θ/low and high γ between epilepsy patients (each epilepsy type) and healthy participants increased in the SOZ. On the other hand, the SI value differences in δ/low γ were not increased in the SOZ. As shown in figure 4, the SI value differences in δ/low γ decreased in the occipital lobe, which was seen in all types of epilepsy. The reduction of PAC in epilepsy patients might be attributable to a disturbance in the δ/low γ physiologic PAC by epileptic activity. We therefore hypothesize that PAC in the θ/γ frequency band pair represents the exaggerated pathologic PAC and that PAC in the δ/γ frequency band pair represents a disturbance in the physiologic PAC.
Various biomarkers for the diagnosis of epilepsy have been reported [51, 80–82]. Some reports have shown that power helps to discriminate epilepsy patients [7, 8]. In the case of medial temporal lobe epilepsy, Tanoue et al [8] reported 91% accuracy in discrimination when using a linear support vector machine and MEG data, taking advantage of the fact that power was higher in the affected parietal lobe. FC was found to be useful for considering the propagation of spike patterns and locating the SOZ [5, 66]. Douw et al [9] suggested that θ of FC was a sensitive predictor of epilepsy. In our study, all features were able to discriminate patients from healthy participants above chance level. When using SNN to classify epilepsy patients and healthy participants, the combination of Power and PAC did not improve the discrimination accuracy, but the combination of DCNN and PAC did. In addition, although accuracy was not improved by either the combination of Power and PAC or of Power and FC compared with Power alone when using SNN, accuracy was improved with the combination of Power, PAC, and FC. Those results suggest that discrimination accuracy changes nonlinearly, depending on the feature combination used. Although discrimination accuracy was not improved, the AUC of the SNN model was improved. We therefore suggest that, compared with Power, PAC has different features that are useful for discrimination. In fact, the difference in θ band Power in the temporal lobe was highest among frequency bands and brain lobes (supplementary figure 6). Similarly, the SI values for θ/low γ in the temporal lobe were the highest. On the other hand, the δ band Power in the parietal lobe and occipital lobe in epilepsy patients was higher than that in healthy participants, but SI values of the δ/low γ frequency band pair in the parietal lobe and occipital lobe were not. Few earlier studies used EEG and MEG to evaluate more than 100 patients. Our study evaluated 180 participants and achieved a discrimination accuracy of 90%. Our results in this large cohort of patients with various types of epilepsy thus identified a reliable interictal biomarker of epilepsy regardless of epilepsy type.
In this study, we used MNet, our DCNN model, as a comparison target because DCNNs are known to be able to obtain features through multiple convolutions. Compared with conventional machine learning methods, DCNNs can improve discrimination accuracy [17]. Compared with the use of Power and FC, MNet resulted in an improvement in discrimination accuracy. This result suggested that MNet was able to extract more information than Power or FC. However, elucidating the features that the DCNN extracts is difficult. Recently, visualization has been used to understand the features obtained in the convolutional layer. In these imaging analyses, methods such as gradient-weighted class activation mapping and integrated gradients were able to visualize the ROI in the convolutional layer [83, 84]. For EEG data, integrated gradients was suggested to be capable of determining the contribution of the amplitude and phase components at each frequency [85]. However, no reports have been able to provide an understanding of the effect of the combination of amplitude and frequency in different bands. In our study, the addition of PAC to the final fully connected layer of MNet further improved the accuracy over that of MNet, suggesting that MNet might not be extracting PAC features that are valuable for a diagnosis. By combining existing features with a DCNN, inferences can be made about the features extracted by the DCNN. In the future, the combination of feature identification with DCNNs is expected to achieve the automated discrimination of epilepsy with high accuracy. It should be noted that the DCNN used to extract features in this study was MNet; the type of DCNN used might affect the results obtained. In future research, a comprehensive evaluation will be needed to determine how the selected DCNN affects discrimination accuracy with respect to the PAC.
In this study, age differences were evident between the epilepsy patients and healthy participants. The epilepsy group in this study included some younger patients, especially 7 years old, in the training data. The characteristic resting-state EEG is known to change as a child grows [86]. For example, rhythmic activity in the occipital lobe gradually increases from a delta wave to an alpha wave. Moreover, hypnagogic hypersynchrony can be observed during sleep onset in school-age children [87]. The epilepsy group also included school-age children, but because only one child was included in the training data, the effect was considered to be small. Although some child-specific epilepsy syndromes such as West syndrome and benign childhood epilepsy with centrotemporal spikes have characteristic EEG/MEG signals, our study did not include patients with those conditions. Moreover, in the test data, we matched the epilepsy patients and healthy participants by age to evaluate accuracy independent of age. On the other hand, we expected to train the MNet to extract features commonly observed in patients of different ages by training with MEG measurements for patients ranging widely in ages. Discrimination based on the test data succeeded regardless of an individual's age.
Our study has several limitations that currently restrict its applicability in general populations. First, the study was conducted at a single site. Although we demonstrated that a trained network using PAC can discriminate patients from healthy participants for whom the MEG signals were not included in the training data, further study using multisite cohorts is necessary to verify the generalizability of our results. Second, although we included patients with various types of epilepsy in both the training and the test datasets, a bias in the epilepsy types was present. The patients in the study mostly had focal epilepsy, especially in the temporal lobe. The increased SI values in the temporal lobe might be related to the higher number of patients with temporal lobe epilepsy. Third, the epilepsy patients were told that they were free to sleep, but the healthy participants were told not to sleep during the MEG measurement taken at rest with eyes closed. Non-rapid eye movement sleep is known to produce physiologic delta waves, which strengthen PAC in the high frequency bands [22, 87]. However, only four participants seemed to be in sleep stage N1 (table 1). The effect of sleep alone was likely to be small in this study. Finally, the epilepsy patients took an average of two or more antiepileptic drugs (test data; 2.6, standard deviation 1.1, training data; 2.2, standard deviation 0.9). On the other hand, the healthy participants were not taking antiepileptic drugs. Antiepileptic drugs may alter the strength of PAC. However, the number of antiepileptic drugs did not make a difference in the SI values of each frequency value. In addition, the SI values of one patient with no antiepileptic drugs among the epilepsy patients were within the quartile of SI values of the epilepsy patients (supplementary figure 3). Further study at a larger scale, performed in multisite with an age-matched control group, is desirable.
5. Conclusions
We showed that resting-state PAC, especially for θ/low γ in the temporal lobe, in epilepsy patients was different from that in healthy participants. In addition, PAC improves the discrimination accuracy of the DCNN, which discriminates estimated cortical currents with high accuracy. The combination of physiologically characteristic features and a DCNN will further improve the accuracy of automated diagnosis.
Acknowledgments
This research was conducted under a grant from the Japan Agency for Medical Research and Development (JP19dm0307103). The work was also supported in part by the Japan Science and Technology Agency Core Research for Evolutional Science and Technology (JPMJCR18A5), Exploratory Research for Advanced Technology (JPMJER1801), Precursory Research for Embryonic Science and Technology (JPMJPR1506), and the Moonshot R&D–MILLENNIA Program (JPMJMS2012); Grants-in-Aid for Scientific Research from the Japan Society for the Promotion of Science (JP19K18388, JP19K18427, JP20H05705, JP18H04085, and JP18H05522); the Japan Agency for Medical Research and Development (19dm0207070h0001, JP19dm0307008, and 19de0107001); and the Council for Science, Technology and Innovation, Cross-Ministerial Strategic Innovation Promotion Program, "Innovative AI Hospital System" (funding agency: National Institute of Biomedical Innovation, Health and Nutrition).
We would like to thank Hui Ming Khoo for critically reading the manuscript and for helpful suggestions.
Data availability statement
The data generated and/or analyzed during the current study are not publicly available for legal/ethical reasons but are available from the corresponding author on reasonable request.
Conflict of interest
The authors report no competing interests.