
Abstract
Objective. Intracortical microelectrode arrays (MEA) can be used as part of a brain–machine interface system to provide sensory feedback control of an artificial limb to assist persons with tetraplegia. Variability in functionality of electrodes has been reported but few studies in humans have examined the impact of chronic brain tissue responses revealed postmortem on electrode performance in vivo. Approach. In a tetraplegic man, recording MEAs were implanted into the anterior intraparietal area and Brodmann's area 5 (BA5) of the posterior parietal cortex and a recording and stimulation array was implanted in BA1 of the primary somatosensory cortex (S1). The participant expired from unrelated causes seven months after MEA implantation. The underlying tissue of two of the three devices was processed for histology and electrophysiological recordings were assessed. Main results. Recordings of neuronal activity were obtained from all three MEAs despite meningeal encapsulation. However, the S1 array had a greater encapsulation, yielded lower signal quality than the other arrays and failed to elicit somatosensory percepts with electrical stimulation. Histological examination of tissues underlying S1 and BA5 implant sites revealed localized leptomeningeal proliferation and fibrosis, lymphocytic infiltrates, astrogliosis, and foreign body reaction around the electrodes. The BA5 recording site showed focal cerebral microhemorrhages and leptomeningeal vascular ectasia. The S1 site showed focal tissue damage including vascular recanalization, neuronal loss, and extensive subcortical white matter necrosis. The tissue response at the S1 site included hemorrhagic-induced injury suggesting a likely mechanism for reduced function of the S1 implant. Significance. Our findings are similar to those from animal studies with chronic intracortical implants and suggest that vascular disruption and microhemorrhage during device implantation are important contributors to overall array and individual electrode performance and should be a topic for future device development to mitigate tissue responses. Neurosurgical considerations are also discussed.
Export citation and abstract BibTeX RIS

Original content from this work may be used under the terms of the Creative Commons Attribution 4.0 license. Any further distribution of this work must maintain attribution to the author(s) and the title of the work, journal citation and DOI.
1. Introduction
Neural prosthetic devices, in the form of brain–machine interfaces (BMIs), can assist people with neurological deficits by monitoring neural activity to control assistive devices such as prosthetic limbs, and elicit somatosensory percepts using electrical neural stimulation [1–4]. Intracortical microelectrodes detect the activity of individual neurons, and the aggregate electric field potential in the vicinity of the microelectrode tips. The same microelectrodes can deliver microampere-level electrical stimulation. Applying microstimulation through microelectrode arrays (MEAs) in the primary somatosensory cortex (S1) elicits somatosensory percepts at body locations consistent with the somatotopy in S1 [5, 6]. Persons with tetraplegia, who have little or no movement or sensation in the arms or legs, could benefit greatly from this novel technology.
In our prior work [2], two MEAs were implanted in the posterior parietal cortex (PPC) of a different tetraplegic research participant. The action potential firing rates of PPC neurons modulated sufficiently during imagined movements (i.e. motor imagery) to operate a robotic arm and control a cursor on a computer screen. Thus, imagined and intended movements, when encoded as spiking activity by neurons in the PPC, can be utilized as signals for control of neuroprosthetic devices.
In addition to sensing neural activity for control of prostheses, a bi-directional BMI can evoke somatosensory percepts by electrical stimulation of the somatosensory cortex [6–9]. We and others have found that stimulation of the somatosensory cortex produces somatotopically localized touch sensations, providing sensory feedback that could enhance the performance of a robotic prosthetic limb [5, 6, 10].
In the present study, we used 96-channel MEAs with dimensions of 4.0 mm × 4.0 mm (length × width), and 1.0 or 1.5 mm electrode shaft lengths (NeuroPort arrays, Blackrock Microsystems, Salt Lake City, UT, USA) (figures 1(A) and (B)). Two recording-only MEAs with platinum microelectrodes were implanted in a grasp area at the junction of the intraparietal and postcentral sulci (putative human anterior intraparietal area, (AIP)) and Brodmann's area 5 (BA5). A 3rd MEA with sputtered iridium–oxide film (SIROF) microelectrode tips to support both recording and stimulation was implanted into the S1 area. Over a 7 month period, field potentials and neuronal action potentials were recorded from all three MEAs, but recordings from the S1 array were of lower quality than that from the other arrays, and stimulation through the S1 array failed to elicit somatosensory percepts.
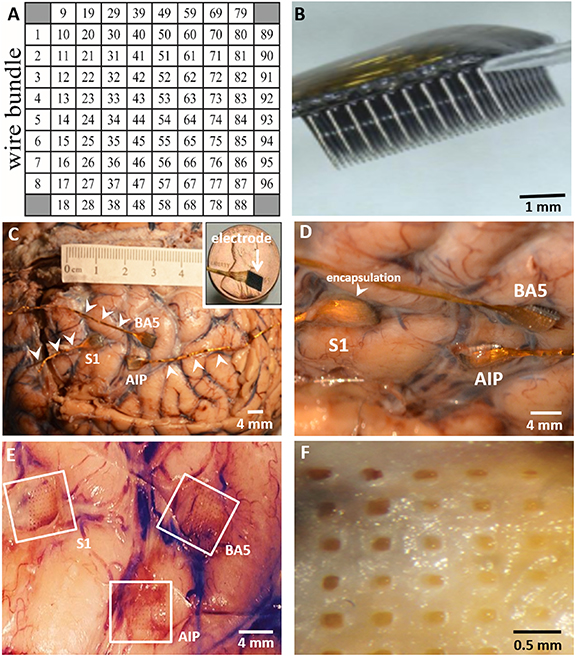
Figure 1. Placement of three MEAs implanted in the patient's left cerebral hemisphere. (A) Configuration of each 96-electrode MEA. (B) Side-on view of an MEA showing rows of 1.5 mm long microelectrodes. (C) In formalin-fixed brain, the position of MEAs with wire bundles (arrowheads) on the surface of the S1, AIP, and BA5 sites are shown. Inset: scale of electrode platform relative to size of a penny. (D) Closer view of implanted MEAs showing meningeal encapsulation. (E) Imprints in tissue remaining after removal of the MEAs. (F) Higher magnification of the upper left (UL) region of the S1 site after removal of the MEA. Calibration bars are shown. Reproduced with permission from [Blackrock Microsystems, LLC]. Neuroport Array—© 2021 Blackrock Microsystems, LLC.
Download figure:
Standard image High-resolution imagePrevious animal studies have shown that variability in MEA performance is mostly attributed to biological factors including tissue damage rather than to device failure per se [11–13]. Because the MEAs used in this study are small, tissue displacement and damage were minimal compared to the larger electrodes used for deep brain stimulation, but there still is risk of damage to neural tissue and to the blood–brain barrier (BBB).
Acute injury and long-term exposure to a foreign body [12, 14–20] may trigger progressive inflammatory and fibrogenic responses that are characterized by an influx of astrocytes and microglia that encapsulate the electrodes [14, 18]. These processes lead to the formation of a glia scar around microelectrodes that can directly affect neuronal recordings by increasing the electrical impedance of the recording tip [11, 21], and degrading signal quality over time [22, 23]. Moreover, a progressive and sustained inflammatory response and neurovascular damage can lead to localized neuronal loss [12, 17, 19, 24]. Degradation of the microelectrodes [22, 25] further degrades signal quality. Despite these limitations, intracortical MEA implantation in humans is clinically feasible [2, 26–30], but sustained functionality remains problematic. To date, little is known about the long-term effects of implanted MEAs in human brain tissue. The only published reports of the cortical tissue response to neural implants in humans were from small case studies with short duration MEA implantation [31, 32]. Here, we describe the histological features from a person with chronically implanted MEAs to further define the link between tissue responses and device performance. The main findings included diffuse inflammatory responses with fibrous encapsulation of the microelectrodes, often accompanied by microhemorrhages that likely adversely affected MEA efficiency, as shown by previous animal studies. This work helps to further define the variations in cortical neural responses elicited by intracortical MEAs in the human brain, and highlights problems that need to be resolved in order to improve clinical outcomes.
2. Methods
2.1. Patient clinical history
The participant was a 64 years-old, right-handed, tetraplegic male who was implanted with three MEAs 4 years after he sustained an incomplete, traumatic injury of the spinal cord at level C4 (ASIA Impairment Scale B) during a snowboarding accident.
2.2. Ethical statement
The study was approved by the Institutional Review Boards at the University of Southern California (USC) (HS-13-00492) and Rancho Los Amigos National Rehabilitation Center. It was approved by California Institute of Technology under a reliance agreement with USC. The study received FDA clearance under investigative device exemption (IDE #G130100) and was conducted in accordance with the Declaration of Helsinki. Informed consent was obtained from the participant after the details of the study and potential risks were fully explained.
2.3. MEA placement
Three 96-channel NeuroPort MEAs from Blackrock Microsystems were implanted into the cerebral cortex of the left hemisphere (figure 1) [5]. Two arrays had platinum-tipped microelectrodes for recording neuronal activity. In the 3rd array, the electrode tips were coated with SIROF for neural recording and microstimulation. One array with 1.0 mm long platinum-tipped microelectrodes was implanted into the putative human AIP, a grasp area at the junction of the left intraparietal and postcentral sulci; a 2nd MEA with platinum-tipped microelectrodes was implanted into BA5; and the 3rd array with 1.5 mm long SIROF-tipped microelectrodes was implanted into BA1 of the S1 (figures 1(C)–(E)). The electrode pitch of the MEAs is 400 µM. Each MEA had a gold wire bundle (arrowheads, figure 1(C)) connected to a titanium percutaneous pedestal affixed to the skull.
During surgery, the pneumatically actuated impulse inserter (used to insert the MEAs into the cortex) was applied twice on each of the recording arrays, and three times on the S1 array without removing MEAs between insertions, because the arrays failed to insert completely in the 1st one (or two) impulses. There appeared to be a thickened area of leptomeninges overlying the site of the S1 array, but it was inserted through the intact leptomeninges. The implantation surgery proceeded without clinical complication and the participant was monitored in the intensive care unit for 2 d before being discharged home to continue rehabilitation.
2.4. Electrophysiology and signal processing
Microelectrodes in the corner positions of each MEA were electrically unconnected by design, leaving 96 microelectrodes active for recording and/or stimulation (figure 1(A)). Neural activity was recorded with the NSP system (Blackrock Microsystems). Neural signals were amplified, bandpass filtered to 0.3 (1st order Butterworth highpass)—7500 Hz (3rd order Butterworth lowpass) and sampled at 30 000 samples s−1 with 16-bit resolution. Impedance measurements were conducted using hardware built into the Blackrock recording system (supporting measurement only at 1 kHz). Mean microelectrode impedances were calculated as the average of these measurements from all 96 microelectrodes in the MEA. Microelectrode impedance measurements were made at the time of manufacture, and throughout the study, are reported in supplementary material (available online at stacks.iop.org/JNE/18/0460b9/mmedia).
Recording of neuronal activity began 20 d after array implantation, with a total of 71 individual recording sessions over 205 d until the patient expired. During each session, neural recordings were made while the patient performed various behavioral tasks (for example, neural control of a computer cursor, neural representations of grasp of an object). Some tasks included the delivery of pulse trains through the SIROF-tipped MEA in S1 for the purpose of testing whether stimulation of S1 could elicit somatosensory percepts (CereStim stimulator, Blackrock Microsystems, Salt Lake City, UT, USA). These experiments did not produce the desired outcome, although similar experiments by our group and others have demonstrated this capability of intracortical microstimulation [5, 6].
Due to the prioritization of recording from the AIP and BA5 MEAs versus stimulating through the S1 MEA, fewer recordings were made through the S1 MEA-67 and 65 sessions from the AIP and BA5 MEAs, respectively, and 43 sessions for the S1 MEA.
Sessions with behavioral tasks on average included 7.8 ± 3.2 (mean ± SD) individual tasks that were each 5.3 ± 3.9 min in duration. Putative neuronal action potential waveforms were extracted from these data by bandpass filtering between 250 and 5000 Hz (4th order Butterworth bandpass) and thresholding the data at 3.5 times the root-mean-square estimate of the noise. Extracted waveforms were 48 samples long with the threshold crossing placed at the 11th sample (by convention with Blackrock Microsystems' recording systems). The threshold value was selected and verified manually, by visual inspection, to detect action potentials greater than the magnitude of background noise, thus minimizing the likelihood of spurious assignment of noise as neuronal action potentials. Spike sorting was used only to show sample putative single units on sample neural recordings from each array (i.e. figure 4); other analyses used unsorted threshold crossings. Spike sorting was performed independently for each data file by k-means clustering of the waveform data projected onto its 1st three principal components, with visual inspection to remove any likely noise units. A proxy for signal-to-noise ratio (SNR) of the action potential waveforms was calculated as the inverse of the coefficient of variation, i.e. the ratio between the mean and standard deviation of the hyperpolarization phase of the action potential waveform, with arbitrary units (au). Inter-spike interval (ISI) histograms were constructed as normalized histograms of the intervals between spike events. To highlight trends in impedance, neuronal unit counts, and SNR over time, a 3rd order polynomial was robustly fit to these data by linear regression (fitlm method, MATLAB, The Mathworks, Inc., Natick, MA, USA) and shown overlaid on the time series measurements.
2.5. General autopsy
A complete autopsy was performed to determine the cause of death. Acute and chronic bronchopneumonia, secondary to aspiration, with tetraplegia and a history of gastroesophageal reflux disease were contributing factors. Other pathological findings are described in the supplementary material.
2.6. Brain examination and removal of MEAs
The entire brain, with attached dura and electrodes, was removed and placed in 10% phosphate-buffered formalin for 1 month. After fixation of the brain, there was diffuse thickening of the leptomeninges covering each MEA site (figures 2(A)–(C)). Removal of the MEAs revealed the extent of meningeal encapsulation of the arrays (figures 2(D)–(F)) with the S1 site showing the greatest encapsulation (figure 2(E)). The sites of penetration of the individual microelectrodes into the underlying tissue were visible (figures 2(D)–(F)). The depth of penetration of the microelectrodes into the underlying tissues was determined for all three array sites. The tissue blocks measured approximately 1.5 × 1.5 × 1.0 cm (D × W × L) for the S1 array, 1.9 × 1.0 × 1.0 cm for the BA5 array, and 0.8 × 0.8 × 0.8 cm for the AIP array. Tissue from the AIP site was utilized for a novel histological study using a CLARITY-based method [33] and not examined further for this study. Normal (control) tissues from the contralateral anterior frontal cortex were also sampled. Those tissue blocks measured approximately 2.0 × 2.0 × 2.0 cm (data not shown). During tissue processing, the BA5 block became separated into two samples, a superficial portion (BA5-2A) and a deep portion containing white matter (WM) (BA5-2B).
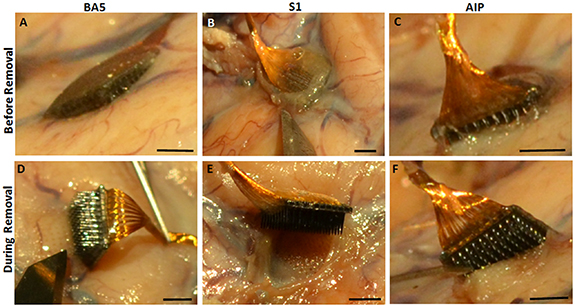
Figure 2. Diffuse thickening of the leptomeninges covering each array implant site. A layer of fibrous tissue covered each array at (A) BA5 (B) S1 and (C) AIP sites. The S1 site had the greatest encapsulation. Removal shows the tracks left by the microelectrode at (D) BA5 (E) S1 and (F) AIP sites. Scale bar = 2.0 mm on all images.
Download figure:
Standard image High-resolution imageThe BA5 and S1 implant sites were cut parallel to the pial surface to show the cross-section of the microelectrode tracks, while the anterior frontal cortex, without implant, was cut perpendicular to the pial surface to observe the normal layering of the cortex.
2.7. Histopathology of S1 and BA5 MEA implant sites
The sampled tissue areas were paraffin-embedded and processed for interval sectioning. The BA5 (BA5-2A and BA5-2B) and S1 tissue blocks were serially cut into five 5 µm thick sections at 100 µm or 300 µm intervals, respectively, with every level stained with H&E and remaining slides saved as unstained. H&E stained sections were analyzed at the BA5 (15 slides for each BA5 block) and S1 sites (24 slides) to assess tissue changes and penetration depth of microelectrodes. Once H&E sections established electrode penetration depth, the unstained slides for that approximate level were then processed for Masson's trichrome to assess fibrosis, cresyl violet to evaluate neuronal status, or immunostained.
Tissue sections stained with 0.75% cresyl violet were dehydrated through graded alcohols and cleared in xylene. Trichrome staining was performed using the Masson trichrome staining kit (Sigma–Aldrich, St Louis, MO, USA). Remaining sections were immunostained using the bond polymer refine DAB detection system (Leica Biosystems, Buffalo Grove, IL, USA). Antigen retrieval was performed with epitope retrieval solution 1 (ER1, pH 6) for 10 min. Sections were then incubated for 15 min with glial fibrillary acidic protein antibody (GFAP; AB5804, Chemicon, Temecula, CA, USA; 1:2500) for detection of gliosis, or ionized calcium-binding adaptor molecule (IBA-1; 019-19741, Wako, Osaka, Japan; 1:500) to define microglial response and foreign body giant cells (FBGCs). Images were obtained with a Nikon Eclipse E400 brightfield microscope (Nikon Instruments Inc., Melville, NY, USA). All stains were performed at Children's Hospital of Los Angeles.
3. Results
3.1. Electrophysiology
Over 71 total recording sessions, neuronal action potential waveforms were recorded from the BA5 and S1 MEAs in 65 and 43 sessions, respectively, with BA5 recordings present in all sessions with S1 recordings. Figures 3(A) and (B) show waveforms of unsorted action potentials with estimates of SNR ⩾ 0.2. The S1 MEA recorded fewer channels with action potentials with SNR ⩾ 0.2 than the BA5 MEA (figures 3(C) and (D)). In figure 3(C), the 3rd order polynomial fits to the action potential counts from the channels with detectable action potentials and were significant for the BA5 MEA with respect to a constant model (F-statistic 19.1, p < 1 × 10⁻⁷) but were not significant for S1 MEA (F-statistic 0.807, p = 0.502). Of 96 electrically functioning channels in the BA5 MEA, 77 (80.2%) showed probable action potentials (unsorted waveforms with SNR ⩾ 0.2) in at least one recording session. Only two channels (2.1%) of the S1 MEA recording action potentials with SNR ⩾ 0.2 in at least 20% of recording sessions, versus 32 channels (33.3%) for the BA5 MEA.
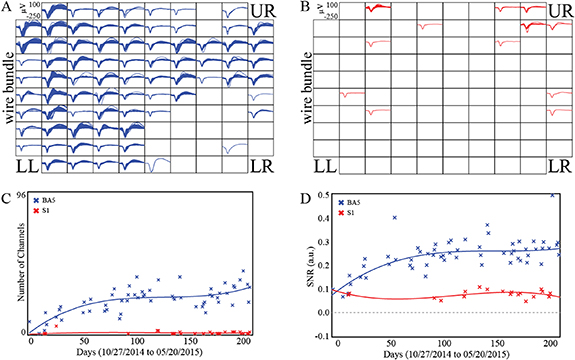
Figure 3. Electrophysiology of the BA5 and S1 MEAs. Action potential waveforms (1.6 ms) from all channels in the (A) BA5 (blue) and (B) S1 (red) MEAs. One mean waveform was computed for every channel from each individual neural recording file if the SNR was at least 0.2. The wire bundle extends from the left side of the arrays. (C) The number of channels with action potential waveforms having SNR ⩾ 0.2 over the duration of the study. (D) Mean SNR estimates for unsorted action potential waveforms from recording sessions with at least ten channels having SNR ⩾ 0.0, for each session over the duration of the study. The solid lines represent a robust linear regression to a 3rd order polynomial.
Download figure:
Standard image High-resolution image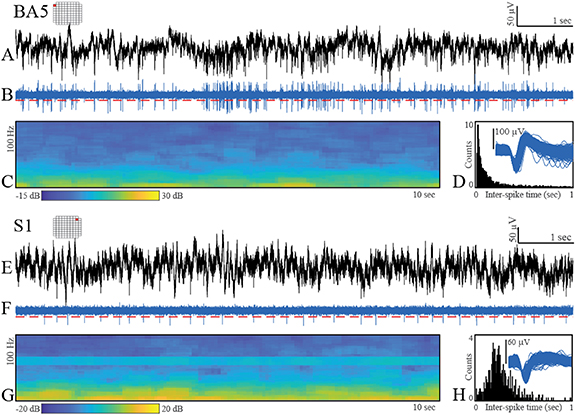
Figure 4. Exemplar neural data recorded from single channels on the BA5 and S1 arrays. Originally recorded 30 000 samples s−1 data ((A) and (E)); bandpass filtered data (250–5000 Hz, 4th order Butterworth) with threshold (red-dashed line) ((B) and (F)); spectrogram of the broadband data between 0 and 100 Hz ((C) and (G)); aggregate action potential waveforms and ISI histograms ((D) and (H)).
Download figure:
Standard image High-resolution imageOn the BA5 MEA, the electrodes of the lower-right (LR) quadrant of the array recorded the fewest action potential waveforms. On the S1 MEA, the best recordings of neuronal activity were from the electrodes near the upper and right edges of the array. Estimates of SNR were computed for unsorted action potential waveforms over the course of the study. The number of channels with detectable neural units increased over time for the BA5 MEA but not for the S1 MEA (figure 3(C)). SNR for the BA5 array increased over time (m = 0.0016 units d−1, p < 0.001), but did not increase for the S1 array (m = 3.5 × 10⁻⁵ units d−1, p = 0.54). Figure 3(D) shows mean SNR of unsorted action potential waveforms for each session with ten or more channels having SNR ⩾ 0.0, with higher values for BA5 MEA (Mann–Whitney, p < 1 × 10⁻⁹). Third-order polynomial curves shown in figure 3(D) were significant with respect to a constant model for the BA5 data (F-statistic 22.4, p < 1 × 10⁻⁸) but not S1 data (F-statistic 0.862, p = 0.482).
During each recording session, electrode impedance was measured at 1 kHz using the NeuroPort system. As expected, due to differences in the material properties of platinum and SIROF, the platinum-tipped microelectrodes exhibited higher impedances than the SIROF-coated microelectrodes, and microelectrode impedance decreased for both arrays over the duration of the implant (see supplementary material). Although most channels from the S1 MEA yielded poor-quality neural recordings, both the S1 and BA5 MEAs provided at least some examples of higher quality neuronal activity (figure 4). The recordings were largely free of electrical noise, apart from a small amount of line noise at 60 Hz and harmonics at 180 Hz. Bandpass-filtered data (250–5000 Hz) showed neuronal action potentials with amplitudes exceeding a threshold of 3.5 times the estimated root-mean-square of the noise (figures 4(B) and (F)). After spike sorting, the aggregate action potential waveforms for the displayed putative neural units and the ISIs showed features expected for intracortical, extracellular neuronal recordings, including the distribution shapes visible in the ISI histograms (figures 4(D) and (H)) and waveform shapes reflective of the action potential depolarization-repolarization cycle.
Visual inspection of the MEAs after removal from tissue did not reveal gross physical damage such as broken shafts (e.g. figure 2). High-resolution optical or SEM imaging was not performed.
3.2. Histopathology of S1 and BA5 implant sites
We examined H&E-stained sections of the S1 and BA5 tissue blocks (cut parallel to the pial surface) to determine the depth of penetration of the microelectrodes and histological changes surrounding the electrodes. Twenty-four and 15 H&E-stained sections were analyzed for the S1 and BA5 array, respectively. The depth of penetration of the electrodes was approximately 0.5 mm for the BA5 array and up to 1.5 mm for the S1 array. The superficial aspect of the implant site consisted of neocortex and thickened leptomeninges (figures 5(A) and (B)) and leptomeningeal fibrosis as confirmed by Masson-trichrome staining (figures 5(C) and (D)). The BA5 array revealed proliferation of thin-walled vessels with luminal expansion and tissue dilation in the leptomeninges (figures 5(A) and (C)) that are absent in S1 sections.
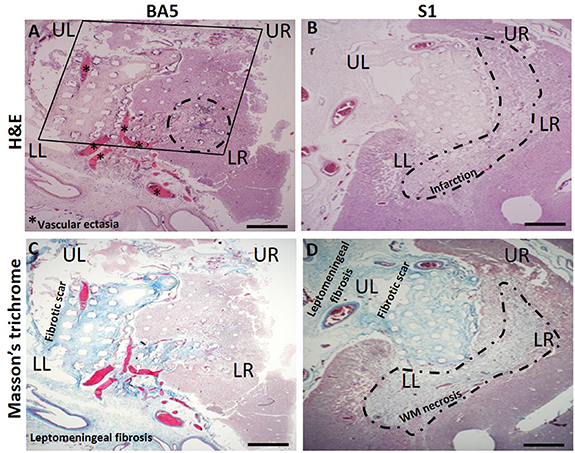
Figure 5. Representative histology in 5 µm adjacent sections from the BA5 recording array site and S1 bidirectional MEA sites. UL and upper right (UR), and LL and LR correspond to regions of electrode arrays noted in recordings of neuronal activity (figures 3 and 4). (A) Imprint of the BA5 MEA (square) after removal. Histologic sections of the BA5 array site are at an oblique angle to the orientation of the electrode tracks, ranging from ∼0.25 to 0.5 mm in depth from the left to the right side of the images. The array imprint is accompanied by blood-filled, leptomeningeal vascular ectasia (asterisks) and intracortical hemorrhage with inflammation (dotted outline). Neural recording was poor in this quadrant of the BA5 MEA (figure 3). (B) Site of the S1 array reveals marked tissue infarction near the tips (∼1.5 mm) of the microelectrodes (H&E). (C) Masson's trichrome staining (blue) of the BA5 and (D) S1 MEA site shows deposition of collagen fibers (fibrosis) in the leptomeninges and on the electrode platform. Beneath the S1 MEA site at a depth of ∼1.5 mm, near the tips of the microelectrodes (dotted outline), there is infarction and white matter (WM) necrosis. Scale bar = 1.0 mm on all images.
Download figure:
Standard image High-resolution imageThe ectatic blood vessels in the leptomeninges appear to be associated with a foreign body response [11, 24]. Depth of penetration of the S1 and BA5 electrodes varied due to the curvature of the cortex and/or angle of the histology sections relative to the orientation of the electrode shanks, as indicated by the variations in the size of the electrode tracks (figures 5(A)–(D)).
The tissue from the UL region nearest to both array's wire bundle includes a collagen-containing (fibrotic) scar suggesting a tissue reaction higher up along the electrode tracks and closer to the brain surface.
The tissue surrounding the electrode imprints show macrophage influx into the molecular layer (layer I). The BA5 sections at a depth of 0.25 mm reveal fibrous and gemistocytic astrocytes and activated microglia, as indicated by GFAP and IBA-1 immunohistochemistry (figures 6(A) and (D)). Gemistocytic astrocytes are characterized by hypertrophic cell bodies and short, thick processes (figures 6(A) and (B), inset) as opposed to non-hypertrophic cell bodies in the contralateral cortex (figure 6(C), inset). The cortex beneath the S1 array was replaced with extensive gliosis and necrosis, and the remaining cortex contained a diffuse distribution of reactive astrocytes and numerous microglia (figures 6(B) and (E)). Areas of necrosis and neuronal loss (acellular regions) also were observed beneath the BA5 (figure 6(G)) and S1 (figure 6(H)) arrays. Notably, areas of cell loss include a focus of hemorrhages with granulation tissue in the LR region of the BA5 array (figure 6(G)) which correlates with the low recording quality in the corresponding region of the BA5 array (figure 3(A)). Similar correlations between tissue damage and recording quality occurred at the S1 array site, where areas of decreased recordings of neuronal activity (figure 3(B)) in the LR and lower left (LL) correlate with areas of necrosis near electrode tips (figure 5(D)). Cresyl violet stain reveals cells with neuronal morphology (distinct pyramidal cell bodies as seen in control tissue) near the electrode tips (figure 6(J), inset) suggesting a possible correlation with the neuronal action potentials. In some areas there were numerous, small, hyalinized arterioles (figure 7(D)) beneath the S1 array and a few residual neurons near an electrode tip (figure 6(K), inset). However, the infarcted areas were mostly devoid of neurons.
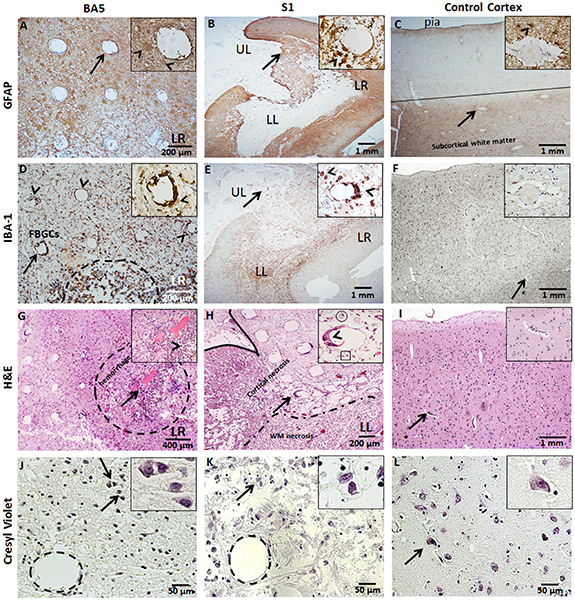
Figure 6. Neurohistology of the BA5 and S1 MEA sites. Arrows identify the feature enlarged in the inset. (A) GFAP immunoreactivity is shown by reactive astrocytes within the LR region of the BA5 array at ∼0.5 mm in depth and around the site of the S1 array (B) at ∼1.2 mm in depth. Inset shows numerous GFAP-positive astrocytes (arrowhead) around a single electrode tract. (C) Control cortex exhibits GFAP staining at the pial surface and in the white matter (WM). Inset shows blood vessel surrounded by astrocytic processes (arrowhead). (D) IBA-1 staining of foreign body giant cells (FBGCs) (arrowheads) surrounding an electrode of the BA5 array. Inset shows FBGCs lining the electrode tract. There is extensive microglial reaction and focal collections of hemosiderin-laden macrophages and areas of microhemorrhages in the LR region of the BA5 array (dotted outline). (E) IBA-1 positive microglia are shown at the S1 site amidst focal necrosis in the underlying WM (area around UL). Inset shows FBGCs (arrowheads) lining the electrode tract and activated macrophages and microglia. (F) Control cortical tissue includes diffuse, IBA-1 positive, resting-state microglia around a small vessel (inset). (G) H&E-stained tissue beneath the LR region of the BA5 MEA shows granulation tissue and hemorrhage (dotted outline) near the tips of the microelectrodes. Neuronal activity could not be recorded with the microelectrodes in this part of the MEA. Inset shows an electrode tract (arrowhead) with hemosiderin-containing macrophages (brown deposits) nearby. (H) H&E stain of the LL region of the S1 MEA reveals cortical necrosis, neuronal loss, and gliosis. Inset shows an electrode tract lined with FBGCs, surrounded by few macrophages (circle) and lymphocytes (box). (I) H&E stain of control cortical tissue shows unremarkable vessels (inset). (J) Cresyl-violet stained slides show few neurons near an electrode shank at a depth ∼0.5 mm (layer III) at the BA5 site and (K) beneath the S1 array at a depth of ∼1.5 mm (layer V) and ∼200 µm above the tip of a recording microelectrode. Insets show magnified view of normal, neuronal morphology. (L) Control cortical tissue showing neurons with normal morphology in layer V (inset). Calibration bars are shown.
Download figure:
Standard image High-resolution image
Figure 7. H&E-stained sections from the S1 MEA site. (A) LL region of the S1 MEA at a depth ∼1.5 mm shows a necrotic cortex with FBGCs lining electrode tracts (arrowheads). (B) Magnified inset of an electrode tract infiltrated by numerous foamy macrophages (circle) and lymphocytes (square); the latter characterized by small dark cells with dense nuclei. (C) H&E stain showing necrotic cortex (outline) adjacent to necrotic subcortical white matter (WM) (dotted outline). (D) Inset of electrode tract with surrounding thick-walled hyaline small vessels (asterisks). (E) Enlarged view of the interface of necrotic subcortical WM with macrophage infiltrates (circle). Cortical tissue with a surrounding rim of reactive astrocytes (arrowhead) is characterized by pink, homogenous cytoplasm. These cells may be either mono or binucleated. (F) Superficial UR region of the S1 MEA shows a foreign body reaction near adjacent electrode tracts in the subarachnoid space (arrows). Note the abnormal, thick-walled leptomeningeal artery with partial recanalization of the lumen (arrowhead). Calibration bars are shown.
Download figure:
Standard image High-resolution image
In figure 7, the S1 MEA site showed FBGCs surrounding most of the electrode tracts, and infiltrates of lymphocytes and macrophages (figures 7(A) and (B)). The FBGC reaction consisted of syncytium-forming macrophages, as shown by positive IBA-1 staining (figure 6(E)). Deeper tissue sections in the LL region of the S1 array showed regions of cortical and WM necrosis (figure 7(C)) with numerous hyalinized, thickened arterioles (figure 7(D)) indicating vascular injury which likely contributed to persistent cortical ischemia. These changes also were seen at the BA5 site. H&E-stained sections of S1 MEA site revealed subacute inflammation with gemistocytic astrocytes (astrocytosis) in the cortex adjacent to the S1 site and destruction of the underlying WM that was engulfed by foamy microphages (figure 7(E)). The gliosis and subcortical necrosis are indicative of the intermediate duration of damage (weeks to months) due to the long-term presence of the arrays. In contrast, the BA5 MEA site (block BA5-2B) showed no significant histopathologic changes in the subcortical WM (data not shown). Near a superficial S1 electrode tract, diffusely thickened leptomeninges was observed, and around the subcortical WM was a rim of gemistocytic astrocytes and sparse, chronic inflammatory cells (figure 7(F)). One leptomeningeal small artery revealed recanalization suggestive of failed or successful focal restoration of blood flow and hemorrhage (figure 7(F)), the latter a possible cause of the surrounding infarction. Together, possible hemorrhagic- or ischemia-induced infarction, neuronal loss and subcortical WM necrosis likely explain the poor overall recording of neuronal activity (figure 3(B)) and absence of effective stimulation by the S1 array.
4. Discussion
The study objective was to determine the relation between the quality of the recordings of neuronal activity and histological findings from tissue underlying MEAs implanted for 7 months in the S1 and PPC (BA5) of a quadriplegic male. Differences in the electrophysiological performance and histological outcomes were observed between the S1 and BA5 MEAs. The amount of tissue damage surrounding the MEAs correlated with the quality of recording of neuronal activity and with the impendences of the microelectrodes.
Variability in the functional outcomes as well as the longevity of neural implants are well known. Previous studies [11, 13, 34] have established the reliability, safety and efficacy of MEA within the posterior parietal and somatosensory cortices in human and non-human subjects for up to 5 years [2, 5, 10, 27–29, 35–37]. Adverse events that required removal of the implants involved either mechanical failure [11, 28] or adverse biological responses [11, 38, 39]. It is well established that damage during device insertion [14, 40–42], long term implantation [19, 43] and/or BBB disruption [44, 45] lead to glial activation, chronic inflammation and wound healing responses. These processes stimulate the formation of granulation tissue that electrically insulates the electrode from nearby neurons [11, 15, 20]. These effects promote neuronal degeneration and death via an inflammatory milieu [21, 38] thereby impeding device function over time [12, 19, 22, 46].
In this patient, we observed chronic inflammation [19, 21, 38, 47], vascular [12, 48] and BBB damage [43, 44], and neuronal cell loss [49] in tissues within the BA5 and S1 electrode sites. In keeping with previous studies, the degree of pathological responses to device implantation showed a correlation with the recording ability of the BA5 and S1 arrays. The BA5 array yielded better recordings of neuronal activity and the corresponding histological profile of the tissue revealed inflammatory and wound-healing responses with some neuronal loss. This tissue response at the BA5 site likely played a role in both electrode impedance and recording quality, in accordance with previous animal models [11, 17, 21, 23, 24, 50, 51]. A region of the BA5 array that yielded poor recording of the neuronal activity showed microbleeds, suggesting that hemorrhaging was a contributing factor to recording failure. The greater pathology observed at the S1 site is likely a result of hemorrhagic-induced injury during array implantation, given poor recording performance from the outset and failure to evoke sensations by intracortical microstimulation. Hemorrhages and reduced perfusion due to damage to blood vessels during device implantation could account for much of the infarction at the S1 site. Mechanisms responsible for these tissue responses include influx of serum proteins, immune and fibroblast cells, and production of pro-inflammatory cytokines and reactive oxygen species, and ionic disturbances that can affect device encapsulation, neuronal survival, and may even contribute to electrode degradation [11, 14, 24, 48, 52, 53]. Much of the tissue damage beneath the S1 array was likely caused by multiple insertional attempts of the array, since stimulation at a similar amplitude did not reduce recording of neuronal activity in other research participants [10, 35], and it is unlikely that electrical stimulation played a role in the observed tissue damage [14, 54].
This study also has important implications for future clinical studies employing this type of intracortical MEA. The overall tissue damage was in the mm2 range, but likely contributed significantly to the degradation of MEA function. Much of the experience with MEA implantation into the cerebral cortex has been with animal models which differ significantly from humans from a neurosurgical perspective. The pneumatic inserter used in this implantation surgery was held by the neurosurgeon's hands. It is not uncommon for there to be expansion of the subarachnoid cerebrospinal fluid space and thickened arachnoid membranes close to the sulci in the human brain. We believe using a hand-held pneumatic inserter device to insert the MEAs through the leptomeninges, and the multiple impulses by the inserter required to fully insert the S1 MEA contributed to the poor functionality of the S1 array. These considerations have led to modifications of the surgical technique to include using a stereotaxic device to stabilize and position the array and a device to hold and position the inserter.
Although this is a single case study and the findings should be considered preliminary, our overall findings are consistent with previous reports from animal models [14, 15, 21, 44, 45, 52] and human cortical tissue acutely implanted with an MEA [31, 32]. Our findings support the premise that vascular disruption and/or BBB damage during implantation remains problematic for long term viability of BMIs. The human cortex is highly vascularized and strategies to minimize damage to blood vessels during and after implantation of intracortical arrays are being explored [46, 55]. While the present study provides some insight into chronic tissue changes in response to MEAs implanted into human brains, further studies are needed to quantify neuronal loss, vascular changes, and studies that better correlate the cortical tissue response with device performance.
5. Conclusion
This study described histological and immunohistochemical examinations of tissue underlying MEAs implanted for 7 months in the S1 and PPC (BA5) of a quadriplegic male. Hemorrhages and lack of perfusion in areas surrounding the microelectrodes of the S1 array most probably led to the infarction of the tissue. These tissue responses persisted for 7 months and were visible at the time of death. While examinations of a single array site and at a single point in time make it difficult to say with certainty, the pathology at the S1 site most likely was related to the details of the array implantation procedure.
Acknowledgments
We wish to acknowledge the family of the research participant for graciously allowing the histological studies. This work was funded by NINDS Grants 5U01NS098975-02 and 5R01NS088379-05.
Data availability statement
All data that support the findings of this study are included within the article (and any supplementary files).
Conflict of interest
The authors declare that no competing interests exist.
Contributions
Neuropathology, L J S, C A M, K T J, D M; Device Engineers, S K and R A A; Neurosurgery, C Y L and B L.