Abstract
To investigate the possible solar source of high-energy protons, correlation coefficients between the peak intensities of E ≥ 100 MeV protons,  , and the peak flux and fluence of solar soft X-ray (SXR) emission, and coronal mass ejection (CME) linear speed in the three longitudinal areas W0–W39, W40–W70 and W71–W90 have been calculated respectively. Classical correlation analysis shows that the correlation coefficients between CME speeds and
  in the three longitudinal areas are 0.28 ± 0.21, 0.35 ± 0.21 and 0.04 ± 0.30 respectively. The classical correlation coefficients between
  and SXR peak flux in the three longitudinal areas are 0.48 ± 0.17, 0.72 ± 0.13 and 0.02 ± 0.30 respectively, while the correlation coefficients between
  and SXR fluence in the three longitudinal areas are 0.25 ± 0.21, 0.84 ± 0.07 and 0.10 ± 0.30 respectively. Partial correlation analysis shows that for solar proton events with source location in the well connected region (W40–W70), only SXR fluence can significantly affect the peak intensity of E ≥ 100 MeV protons, but SXR peak flux has little influence on the peak intensities of E ≥ 100 MeV protons; moreover, CME speed has no influence on the peak intensities of E ≥ 100 MeV protons. We conclude that these findings provide statistical evidence that E ≥ 100 MeV protons may be mainly accelerated by concurrent flares.
Export citation and abstract BibTeX RIS
1. Introduction
There are two kinds of solar energetic particle (SEP) events, named impulsive and gradual SEP events respectively. The former is accompanied by an impulsive flare, while the latter is often accompanied by both a gradual flare and a fast coronal mass ejection (CME). Nobody doubts that the concurrent impulsive flare is responsible for an impulsive SEP event. However, when a large gradual SEP event happens, whether the concurrent flare contributes to the production of SEPs is still an open question. Some researchers have insisted that only CME-driven shocks can contribute to large gradual SEP events, but the associated flares make no contribution to large gradual SEP events (Reames 1999; Kahler 2001). However, some researchers have also argued that solar flares may contribute to large gradual SEP events. Cane et al. (2007) suggested that solar flares and CMEs are likely to coexist and the evolution of any event depends on the relative importance of the processes. This is also consistent with the statement (Firoz et al. 2012) that type III and type II bursts are successive evolutions and it is difficult to separate them. The investigation of properties of SEP events inferred from their associated radio emission suggests that a clear-cut distinction between flarerelated and CME-related SEP events is difficult to establish (Kouloumvakos et al. 2015). Kallenrode (2003) suggested that large gradual SEP events are mixed events, namely that a large gradual SEP event is contributed by both the concurrent flare and the associated CME-driven shock. The main controversy focuses on which process plays a key role in producing high-energy particles.
One way to resolve this controversy is to derive the particle release time and compare it with associated solar eruptions (refer to the studies, e.g., Kahler et al. 2003; Miroshnichenko et al. 2005; Simnett 2006; Le et al. 2006; Masson et al. 2009; Reames 2009b,a; Aschwanden 2012; Gopalswamy et al. 2012; Li et al. 2012). However, the methods applied are different from each other, therefore leading to different conclusions even for the same SEP event. For example, the release time of relativistic solar protons (RSPs) that occurred on 2003 October 28 calculated by Miroshnichenko et al. (2005) was different from the one by Reames (2009b). Combining particle energy spectra, elemental abundances and multiwavelength solar observations, a number of studies have been designed to identify the acceleration sources and/or mechanisms of large gradual SEP events (Cane et al. 2003, 2006; Tylka et al. 2005, Tylka et al. 2013; McCracken et al. 2008; Li et al. 2007a,b, 2009; Grechnev et al. 2008; Bazilevskaya 2009; Pérez-Peraza et al. 2009; Andriopoulou et al. 2011; Firoz et al. 2011; Vashenyuk et al. 2011; Kahler et al. 2012; Moraal & McCracken 2012; Mewaldt et al. 2012; Nitta et al. 2012; Veselovsky et al. 2012; Ko et al. 2013; Le et al. 2013). Different researchers have different interpretations of the same phenomena associated with SEP events. For example, Cane et al. (2003, 2006) suggested that high Fe/O at the early phase of an SEP event was directly generated by flare acceleration. By contrast Tylka et al. (2013) demonstrated that the initial Fe/O enhancements are a transport effect. In addition, Tylka et al. (2005) argued that longer-lasting Fe/O enhancements, particularly at higherenergies, arose from a CME-driven shock operating on flare-accelerated seed particles. Some researchers suggested that large, fast CMEs overtake the ones emitted previously from the same or nearby active regions and then interact with each other. CME-interaction is probably a key factor determining the SEP production (Kahler 2001; Kahler & Vourlidas 2005; Gopalswamy et al. 2002, 2004; Ding et al. 2013). However, Richardson et al. (2003) argued that the interaction between two CMEs is not a key factor controlling the SEP intensity. Kahler & Vourlidas (2014) suggested that the relevance of CME interactions for larger SEP event intensities remains unclear.
Statistical correlations between large gradual SEP events and their associated solar activities can provide us with another clue to distinguish the roles of flares and/or CMEs in producing SEPs. Park et al. (2010, 2012) investigated the correlation between peak intensities of solar proton events (SPEs) and parameters of flares and CMEs, and they concluded that CME shocks are more important to the peak intensities of SPEs than solar flares. Dierckxsens et al. (2015) investigated the relationship between SEPs and properties of their associated flares and CMEs. Their results show that the correlation between proton peak flux and CME speed decreases with energy, while the correlation with flare intensity (FI) shows the opposite behavior. Furthermore, the correlation with CME speed is stronger than the correlation with flare intensity below 15MeV and becomes weaker above 20MeV. Trottet et al. (2015) investigated the statistical relationships between SEP peak intensities of 15–40MeV protons and near-relativistic electrons and characteristic quantities of the associated solar activity. Their partial correlation analysis shows that both soft X-ray (SXR) fluence and CME shock acceleration contribute to the 15–40MeV protons and near-relativistic electron populations in large SEP events. Grechnev et al. (2015) investigated relations between microwave fluences at 35GHz and near-Earth proton fluences above 100MeV. The results indicate a statistically larger contribution of flare processes to high-energy proton fluxes. Acceleration by shock waves seems to be less important at high energies in events associated with strong flares.
Geostationary Operational Environmental Satellite (GOES) is located in a good position to observe flareaccelerated particles when source locations of SEP events are well connected with GOES; otherwise, GOES is not located in a good position to observe the flareaccelerated particles. This suggests that the flux of flareaccelerated particles is highly longitudinally dependent or the correlation coefficient between flares and peak intensities of SEP events is highly longitudinally dependent and reaches its largest value in the well connected region. Whether the correlation coefficient between flares and peak intensities of E ≥ 100 MeV protons is really longitudinally dependent and reaches its largest value in the well connected region, and which one, flare or CME, is more important for the production of E ≥ 100 MeV protons are outstanding questions. To resolve these issues, both classical and partial correlation coefficients between the peak intensities of E ≥ 100 MeV protons,  and the CME speeds, the SXR peak fluxes and the SXR fluence, in different longitudinal areas are calculated.
This is the motivation of the paper. Section 2 presents the data sources and definitions. Statistical results are given in Section 3. Section 4 is devoted to the summary and discussion.
2. Data sources and definitions
The relationship between the start-to-end fluence,  , and occurrence of SPEs has been investigated by Kubo & Akioka (2004).
  is related to the total energy released by the associated flare (Kubo & Akioka 2004, Chen et al. 2016), indicating that
  is a better parameter describing the energy properties of SXR emission than SXR peak flux. The particle acceleration in a flare is thought to occur during the flare impulsive phase. Therefore, we use the start-to-peak fluence of SXR emission,
  , to substitute the start-to-end fluence of SXR emission,
  , to investigate the correlation between SEP peak intensities and SXR fluences.
The start-to-peak fluence of SXR emission,  , is calculated by the equation listed below,
where f(t) is the SXR flux, and  and
and  are the start and peak time of the SXR flare, respectively. The start-to-peak fluence in the 0.1–0.8 nm channel is calculated by processing GOES data from http://umbra.nascom.nasa.gov/goes/fits. The unit of
  and
and  used in the paper is erg cm
 .
.
The FI, and start, peak and end times are available from the website ftp://ftp.ngdc.noaa.gov/STP/space-weather/solar-data/solar-features/solar-flares/x-rays/goes/xrs/. For major SPEs, the associated flares/CMEs are well defined. For example, the CME and flare associated with each SPE that occurred during 1997–2006 have been listed by Cane et al. (2010), and Ding et al. (2015) listed the SPEs during 1997–2006 and their associated solar flares/CMEs. For the SPEs that occurred during solar cycle 24, the SPEs and associated flares/CMEs are obtained from the NOAA SPE list (http://umbra.nascom.nasa.gov/SEP/).
The peak intensities of E ≥ 100 MeV solar protons observed by (GOES) that occurred in solar cycle 23 can be freely downloaded from the website (http://spidr.ngdc.noaa.gov/spidr/), while SPEs that occurred during solar cycle 24 are obtained from the website (http://umbra.nascom.nasa.gov/sdb/goes/particle). The linear speed of a CME,  , can be acquired from the CME catalog (http://cdaw.gsfc.nasa.gov/CME_list/, Yashiro et al. 2004) based on the Solar and Heliospheric Observatory/Large Angle Spectroscopic Coronagraph (SOHO/LASCO; Brueckner et al. 1995). A major source of uncertainty in statistical studies using CME velocity is the distortion of height measurements in coronagraphic images by projection effects. Shen et al. (2013), through multi-viewpoint analysis of 86 CMEs, found that the difference between de-projected and projected (from CDAW) CME speeds mostly varies between ± 150 km s
 .
.
3. Statistical analysis and results
3.1. Classical Correlation Analysis
The intensity-time profile of E ≥ 100 MeV protons for each SPE that occurred during 1997–2014 has been carefully checked. Only the SPEs that have obvious peak flux and are not overlapped by other events are included in the statistical study. The events with source locations distributed in the backside of the solar limb will not be included in the study, since X-ray emission of the associated flares is occulted. The longitudinal area well connected with the Earth should be located in the west hemisphere of the Sun. Consequentially, 52 SPEs with source locations in the west hemisphere of the Sun have been selected. The CME speed, SXR peak flux and peak flux of E ≥ 100 MeV protons for each SPE that occurred during 1997–2014 have been carefully checked, while the start-to-peak fluences  for each flare have been calculated. The parameters of solar activities associated with 52 SPEs and peak intensities of E ≥ 100 MeV protons are presented in Table 1. In the table, columns are sequentially presented with the following parameters: sequential number, year, date, SXR peak flux time, flare position, SXR FI, flare duration from the flare onset to flare peak time, start-to-peak fluence (
 ), CME speed and peak intensity of E ≥ 100 MeV protons (
 ). The CME speed associated with the SPE that occurred on 2005 January 20 estimated by Gopalswamy et al. (2005) is 3242 km s
 , which will be used in the paper.
Table 1. The Flares and CMEs Associated with 100 MeV SPEs during 1997–2014
| No. | Year | Date | Time | Location | FI |

|

|

|

|
|---|---|---|---|---|---|---|---|---|---|
| yyyy | mm/dd | hh:mm | (SXR peak flux) | (min) | (erg  ) ) |
(km s ) ) |
(pfu) | ||
| 1 | 1997 | 11/04 | 05:58 | S14W33 | X2.1 | 6 | 0.01155 | 785 | 2.55 |
| 2 | 1997 | 11/06 | 11:50 | S18W63 | X9.4 | 6 | 0.08264 | 1556 | 46.3 |
| 3 | 1998 | 04/20 | 10:00 | S43W90 | M1.4 | 43 | 0.02135 | 1863 | 6.98 |
| 4 | 1998 | 05/02 | 13:35 | S15W15 | X1.1 | 11 | 0.01782 | 938 | 9.06 |
| 5 | 1998 | 05/06 | 08:00 | S11W65 | X2.7 | 11 | 0.06832 | 1099 | 4.89 |
| 6 | 1999 | 06/04 | 07:03 | N17W69 | M3.9 | 11 | 0.00822 | 2230 | 0.158 |
| 7 | 2000 | 06/10 | 17:02 | N22W38 | M5.2 | 22 | 0.02982 | 1108 | 1.62 |
| 8 | 2000 | 07/14 | 10:24 | N22W07 | X5.7 | 21 | 0.21983 | 1670 | 408 |
| 9 | 2000 | 07/22 | 11:34 | N34W56 | M3.7 | 17 | 0.02143 | 1230 | 0.343 |
| 10 | 2000 | 09/12 | 12:17 | S17W09 | M1.0 | 42 | 0.01618 | 1550 | 0.393 |
| 11 | 2000 | 10/16 | 07:28 | N04W90 | M2.5 | 48 | 0.03414 | 1336 | 0.302 |
| 12 | 2000 | 11/08 | 23:28 | N10W75 | M7.4 | 46 | 0.07974 | 1738 | 349 |
| 13 | 2000 | 11/24 | 14:55 | N22W07 | X2.3 | 22 | 0.06073 | 1245 | 0.361 |
| 14 | 2001 | 01/28 | 16:00 | S04W59 | M1.5 | 20 | 0.01105 | 916 | 0.30 |
| 15 | 2001 | 03/29 | 10:15 | N14W12 | X1.7 | 18 | 0.07982 | 942 | 0.213 |
| 16 | 2001 | 04/02 | 21:51 | N18W82 | X20 | 19 | 0.51648 | 2505 | 0.542 |
| 17 | 2001 | 04/10 | 05:26 | S23W09 | X2.3 | 20 | 0.14403 | 2411 | 0.478 |
| 18 | 2001 | 04/12 | 10:28 | S19W42 | X2.0 | 49 | 0.09402 | 1184 | 1.49 |
| 19 | 2001 | 04/15 | 13:50 | S20W85 | X14.4 | 31 | 0.25496 | 1199 | 145 |
| 20 | 2001 | 11/04 | 16:20 | N06W18 | X1.0 | 17 | 0.04175 | 1810 | 56.8 |
| 21 | 2001 | 11/22 | 22:30 | S15W34 | M9.9 | 8 | 0.14749 | 1437 | 4.03 |
| 22 | 2001 | 12/26 | 05:40 | N08W54 | M7.1 | 68 | 0.12046 | 1446 | 50.2 |
| 23 | 2002 | 04/21 | 01:51 | S14W84 | X1.5 | 68 | 0.26383 | 2393 | 22.9 |
| 24 | 2002 | 08/22 | 01:57 | S07W62 | M5.4 | 10 | 0.01191 | 998 | 1.71 |
| 25 | 2002 | 08/24 | 01:12 | S08W81 | X3.1 | 23 | 0.17615 | 1913 | 29.3 |
| 26 | 2003 | 05/31 | 02:24 | S07W65 | M9.3 | 11 | 0.01741 | 1835 | 0.881 |
| 27 | 2003 | 10/26 | 18:19 | N02W38 | X1.2 | 57 | 0.26114 | 1537 | 0.986 |
| 28 | 2003 | 10/29 | 20:49 | S15W02 | X10 | 12 | 0.28513 | 2029 | 110 |
| 29 | 2003 | 11/02 | 17:15 | S20W56 | X8.3 | 22 | 0.34059 | 2598 | 49.4 |
| 30 | 2003 | 11/04 | 19:29 | S19W83 | X28.0 | 21 | 0.86426 | 2657 | 0.986 |
| 31 | 2004 | 11/07 | 16:06 | N09W17 | X2.0 | 24 | 0.10911 | 1759 | 0.540 |
| 32 | 2004 | 11/10 | 02:13 | N09W49 | X2.5 | 14 | 0.06934 | 3387 | 0.37 |
| 33 | 2005 | 01/15 | 23:02 | N15W05 | X2.6 | 37 | 0.27696 | 2861 | 0.568 |
| 34 | 2005 | 01/17 | 09:52 | N15W25 | X3.8 | 123 | 0.56903 | 2547 | 28.1 |
| 35 | 2005 | 01/20 | 07:01 | N14W61 | X7.1 | 25 | 0.48219 | 3242 | 698 |
| 36 | 2005 | 08/22 | 17:27 | S12W65 | M5.6 | 41 | 0.00741 | 2738 | 0.373 |
| 37 | 2006 | 12/13 | 02:40 | S06W24 | X3.4 | 26 | 0.22844 | 1774 | 88.7 |
| 38 | 2006 | 12/14 | 22:15 | S05W31 | X1.5 | 68 | 0.04576 | 1042 | 2.33 |
| 39 | 2011 | 06/07 | 06:41 | S21W64 | M2.5 | 25 | 0.02209 | 1255 | 3.63 |
| 40 | 2011 | 08/04 | 03:57 | N15W49 | M9.3 | 16 | 0.02209 | 1315 | 1.57 |
| 41 | 2011 | 08/09 | 08:05 | N17W83 | X6.9 | 17 | 0.08782 | 1610 | 2.3 |
| 42 | 2012 | 01/23 | 03:59 | N28W36 | M8.7 | 11 | 0.05849 | 2175 | 1.99 |
| 43 | 2012 | 01/27 | 18:37 | N27W71 | X1.7 | 60 | 0.15467 | 2508 | 10.6 |
| 44 | 2012 | 03/13 | 17:41 | N18W62 | M7.9 | 29 | 0.07503 | 1884 | 3.619 |
| 45 | 2012 | 05/17 | 01:47 | N12W89 | M5.1 | 22 | 0.03269 | 1582 | 12.8 |
| 46 | 2012 | 07/06 | 23:08 | S18W50 | X1.1 | 7 | 0.01036 | 1828 | 0.482 |
| 47 | 2012 | 07/12 | 16:49 | S16W09 | X1.4 | 72 | 0.16495 | 885 | 0.255 |
| 48 | 2013 | 09/29 | 23:37 | N15W40 | C1.6 | 48 | 0.00854 | 1179 | 0.15 |
| 49 | 2014 | 01/07 | 18:32 | S15W11 | X1.2 | 28 | 0.1004 | 1830 | 4.31 |
| 50 | 2014 | 02/20 | 07:55 | S15W67 | M3.0 | 30 | 0.01821 | 948 | 0.437 |
| 51 | 2014 | 04/18 | 13:03 | S16W41 | M7.3 | 32 | 0.0479 | 1208 | 0.768 |
| 52 | 2014 | 09/10 | 17:45 | N16W06 | X1.6 | 24 | 0.11688 | 1425 | 0.757 |
Trottet et al. (2015) used the bootstrap method (Wall & Jenkins 2012) to estimate the statistical uncertainty of the correlation coefficient. Because our sample is only comprised of 52 SPEs, we also use the bootstrap method (Wall & Jenkins 2012) to estimate the statistical uncertainty of correlation coefficients. These correlation coefficients were calculated for N pairs of values chosen at random within the set of N observations. This procedure was repeated 5000 times. We use CC(X, Y) to indicate the classical correlation coefficient between parameters X and Y. To investigate the properties of longitudinal dependence of peak intensity for E ≥ 100MeV on the associated CME speed, FI and SXR fluence, the correlation coefficients between  and CME speed, flare intensity and SXR fluence for SPEs with source locations in the three longitudinal areas have been calculated and are shown in Figures 1, 2 and 3 respectively.
Charged particles always propagate along interplanetary magnetic field lines, even when undergoing perpendicular diffusion (Bieber et al. 2004, Qin 2007; Qin et al. 2013; Qin & Zhang 2014; Qin & Wang 2015). Therefore, the largest fluxes of flare-accelerated particles are always observed in a well-connected region. The source locations of flare-accelerated particles are mainly distributed in the longitudinal area ranging fromW40 toW70, which can be seen in figure 2.3 in the paper Reames (1999). To investigate whether there is really a longitudinal area within which high-energy particles accelerated by the flare have the largest fluxes, we derive the correlation coefficients between peak intensities of E ≥ 100 MeV protons and the parameters of solar activities in three longitudinal areas: W0–W39, W40–W70 and W71–W90, shown in Figures 1, 2 and 3 respectively.
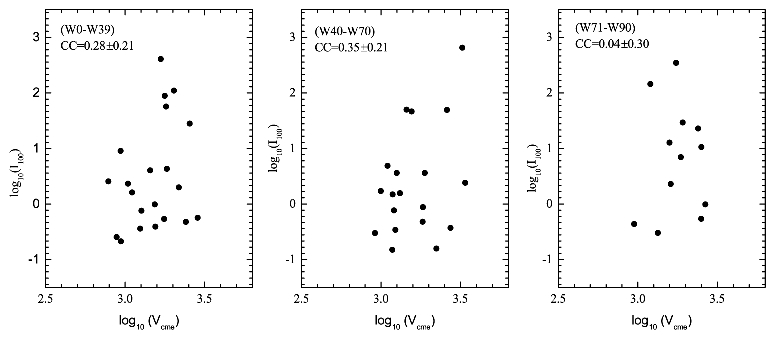
Fig. 1 Scatter (log-log) plots of  versus CME speed in the three longitudinal areas.
Download figure:
Standard image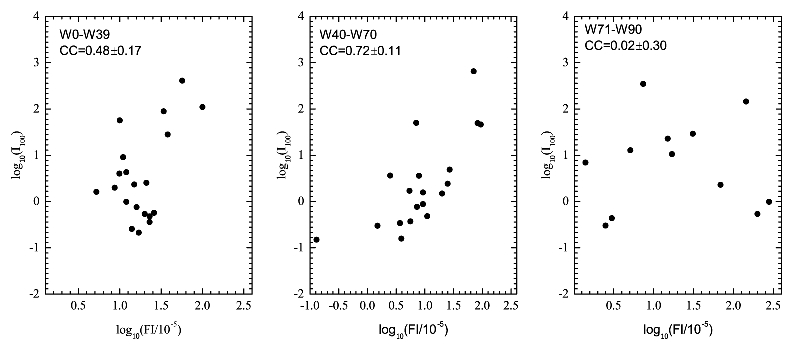
Fig. 2 Scatter (log-log) plots of  versus SXR peak flux in the three longitudinal areas.
Download figure:
Standard image
Fig. 3 Scatter (log-log) plots of  versus FI in the three longitudinal areas.
Download figure:
Standard imageWe can see from Figure 1 that in the three longitudinal areas W0–W39, W40–W70 and W71–W90, the correlation coefficients CC( ,
,  ) are 0.28 ± 0.20, 0.26 ± 0.22 and 0.18 ± 0.34 respectively, suggesting that the peak intensities of E ≥ 100 MeV protons have poor correlation with CME speed.
We can also see from Figures 2 and 3 that in the three longitudinal areas W0–W39, W40–W70 and W71–W90, the correlation coefficients CC( ,
,  FI) are 0.48 ± 0.17, 0.67 ± 0.13 and 0.02 ± 0.30 respectively, while CC(
 ,
,  ) in the three longitudinal areas are 0.25 ± 0.21, 0.84 ± 0.07 and 0.27 ± 0.30 respectively. It is obvious that both CC(
 ,
,  FI) and CC(
 ,
,  ) are highly longitudinally dependent, and in the longitudinal area W40–W70 (hereafter well connected region), CC(
 ,
,  FI) and CC(
 ,
,  ) reach their largest values of 0.72 ± 0.11 and 0.84 ± 0.07 respectively. It is evident that SXR fluence has a better correlation with the peak intensities of E ≥ 100 MeV than SXR peak flux.
If we do not divide the SEP events into three longitudinal areas, the derived correlation coefficients between the peak flux of E ≥ 100 MeV protons and the CME speed, FI and SXR fluence for all SPEs are shown in Figure 4. We can see from Figure 4 that CC( ,
,  ), CC(
 ,
,  FI) and CC(
 ,
,  ) are only 0.24 ± 0.13, 0.43 ± 0.11 and 0.47 ± 0.10 respectively. It is evident that if the SPEs are not divided into three longitudes, the property of high longitudinal dependence for the peak intensity of SEPs on a solar flare will not be revealed.

Fig. 4 Scatter (log-log) plots of  versus CME speed, FI and SXR fluence, from left to right respectively.
Download figure:
Standard image3.2. Partial Correlation Analysis
The partial correlation between two variables is considered by nullifying the effects of the third (or fourth, or more) variable on the variables being considered, which has been used by Trottet et al. (2015) to analyze the correlation between peak intensities of 15–40 MeV protons and the parameters of associated solar activities. To investigate how CME speed, SXR peak flux and SXR fluence independently affect the peak intensities of E ≥ 100 MeV protons in the well connected region, partial correlation coefficients between peak intensities of E ≥ 100 MeV protons and the parameters of associated solar activities, together with their statistical uncertainties from the bootstrap method, have been calculated for SPEs in the well connected region. We use CC (X, Y) to indicate the partial correlation coefficient between parameters X and Y. For the SPEs with source location in the well connected region, CC
 (
( ,
,  ), CC
), CC (
( ,
,  FI) and CC
 (
( ,
,  ) are –0.21 ± 0.25, 0.32 ± 0.23 and 0.68 ± 0.14 respectively, suggesting that in the well connected region, only SXR fluence can significantly affect the peak intensities of E ≥ 100 MeV protons, but SXR peak flux has little influence on the peak intensities of E ≥ 100 MeV protons; moreover, CME speed has little influence on the peak intensities of E ≥ 100 MeV protons. For all SPEs with source locations ranging from W0 to W90, the classical correlation coefficients between
  and CME speeds, flare intensities and SXR fluence have been calculated and are shown in Figure 4; CC
 (
( ,
,  ), CC
), CC (
( ,
,  FI) and CC
 (
( ,
,  ) are only 0.03 ± 0.14, 0.13 ± 0.14 and 0.21 ± 0.14 respectively. Although CC
 (
( ,
,  ) is still the largest one for all SPEs, it is much smaller than the one for SPEs with source locations in the well connected region.
4. Summary and Discussion
In the present study, correlation coefficients between the peak intensity of E ≥ 100 MeV protons,  , and the SXR emission of associated solar flares, and the correlation coefficients between
  and CME speed have been calculated. The results are summarized as follows.
Both the classical and partial correlation analysis suggest CME speed has a poor correlation with the peak intensity of E ≥ 100 MeV protons, while only SXR fluence has a good correlation with the peak intensity of E ≥ 100 MeV protons, and only SXR fluence can significantly affect the peak intensity of E ≥ 100 MeV protons. The statistical correlation analysis suggests that E ≥ 100 MeV protons may be mainly accelerated by concurrent flares.
The well connected region may not be exactly in the longitudinal area ranging from W40 to W70. The correlation coefficients between flares and SEP intensities should be calculated in many more longitudinal areas to precisely look for a well connected region if the number of SPEs is large enough. Anyway, the result of the paper suggests that the correlation coefficient between peak intensity of E ≥ 100 MeV protons and SXR emission reached its largest value for the SPEs with source locations in the well connected region and then declined dramatically for SPEs with source locations outside the well connected region. This kind of result is consistent with the concept that flares really contribute to the production of high-energy protons in large gradual SEP events and E ≥ 100 MeV protons may be mainly accelerated by concurrent flares.
Statistical results are usually given for the majority of cases, suggesting that flares dominate in the acceleration of high energy protons in most SPEs. The results of the paper do not rule out the possibility that a CME shock may play a key role in the production of high energy protons and even RSPs for some SEP events. For example, the solar origin of ground level enhancement that occurred on 2012 May 17 and 2014 January 6 may be the shocks driven by associated CMEs (Papaioannou et al. 2014, Thakur et al. 2014). The results of the paper also do not rule out the possibility that some SEP events with source locations outside the longitudinal area W40–W70 may also be well connected with the Earth. For example, the SEP event that occurred on 2003 October 28 was also well connected with Earth at the early phase of the SEP event (Miroshnichenko et al. 2005).
The statistical results in the paper Dierckxsens et al. (2015) show that the correlation between proton peak flux and CME speed decreases with energy, while the correlation with FI or SXR peak flux shows the opposite behavior, and the proton peak flux correlation with CME speed is stronger than the correlation with FI below 15 MeV and becomes weaker above 20 MeV, suggesting that CME shock is an effective accelerator for E ≤ 15 MeV protons. The statistical results in the paper Trottet et al. (2015) show that only SXR fluence and CME speed can significantly affect the peak intensities of (15–40) MeV protons; SXR peak fluxes make no additional contribution to the peak intensities of (15–40) MeV protons. The flux of solar protons decreases quickly with energy according to the solar proton energy spectra (Xapsos et al. 2000), suggesting that 15–40 MeV protons are mainly composed of protons with energy around 15 MeV. By combining our results with those obtained in the two papers Dierckxsens et al. (2015) and Trottet et al. (2015), we may conclude that a CME shock can be an effective accelerator for low energy protons, while a solar flare may be an effective accelerator for both low and high energy protons.
It should be noted that some flares accompanied by strong SXR flares are, in some cases, not accompanied by SPEs if the flares are not accompanied by fast CMEs. Klein et al. (2010) suggested that flare-accelerated particles might be trapped in the flare site if radio emissions at decimeter and longer wavelengths are absent. In other words, the flare is confined. If the solar flare is eruptive, CMEs can open a rather large magnetic configuration above the solar active region and make it easier for flare-accelerated particles to escape.
The SEP event that occurred on 2001 April 2 was accompanied by a very strong X20 flare and very fast CME with a speed of 2505 km s ; however the peak flux of E ≥ 100 MeV protons was only 0.542 pfu. The SEP event that occurred on 2003 November 4 was also accompanied by a very strong X28 flare and a very fast CME with a speed of 2657 km s
 ; however the peak flux of E ≥ 100 MeV protons was only 0.986 pfu, suggesting that the flux of particles not only depends on properties of the associated flare and CME, but also depends on properties of the magnetic field over the associated active region and conditions of magnetic connection between the source location of the SEP event and observer.
Acknowledgements
We are very grateful to the anonymous referee for her/his reviewing of the paper and for helpful suggestions. This work was jointly funded by the National Basic Research Program of China (973 Program, Grants 2012CB957801 and 2014CB744203), the National Natural Science Foundation of China (Grants 41074132, 41274193, 41474166, 41304144, 11303017 and 11533005), and the National Standard Research Program (Grant 200710123). The SXR data including the flare start, peak and end time, and the SXR fluence were obtained freely from NOAA (ftp://ftp.ngdc.noaa.gov/STP/space-weather/solar-data/solar-features/solar-flares/x-rays/goes). The data on SPEs that occurred during solar cycle 23 were obtained freely from NOAA (http://spidr.ngdc.noaa.gov/spidr), while the data on SPEs that occurred during solar cycle 24 were also obtained freely from NOAA (http://umbra.nascom.nasa.gov/sdb/goes/particle). The catalog of linear speed for each CME was funded in the early phase by AFOSR and NSF. Currently, the catalog resides at the CDAW Data Center at Goddard Space Flight Center and is supported by NASA's Living with a Star program and the SOHO project (http://cdaw.gsfc.nasa.gov/CME_list).