
Abstract
The full array of the Large High Altitude Air Shower Observatory (LHAASO) has been in operation since July 2021. For its kilometer-square array (KM2A), we optimized the selection criteria for very high and ultra-high energy γ-rays using data collected from August 2021 to August 2022, resulting in an improvement in significance of the detection in the Crab Nebula of approximately 15%, compared with that of previous cuts. With the implementation of these new selection criteria, the angular resolution was also significantly improved by approximately 10% at tens of TeV. Other aspects of the full KM2A array performance, such as the pointing error, were also calibrated using the Crab Nebula. The resulting energy spectrum of the Crab Nebula in the energy range of 10-1000 TeV are well fitted by a log-parabola model, which is consistent with the previous results from LHAASO and other experiments.
Export citation and abstract BibTeX RIS
I. INTRODUCTION
The Crab Nebula is one of the very few celestial bodies corresponding to a recorded historical supernova explosion. It is powered by a spinning pulsar with a 33 ms period and a fluctuating magnetized relativistic pulsar wind [1]. It is well studied in almost all wavelength bands from radio to gamma rays. The photons with energy just below 1 GeV are produced by synchrotron radiation, and the higher energy signal is dominated by inverse Compton scattering [2]. Moreover, the Crab Nebula is one of the most luminous sources in the TeV γ-ray energy band.
In 1989, very high energy (VHE) γ-ray emission from the Crab Nebula was first discovered by the Whipple Collaboration [3]. Since then, it has been detected by both Imaging Atmospheric Cherenkov telescopes [2, 4] and air shower arrays [5−7]. MAGIC detected the Crab Nebula in both the lower energy band, measuring the spectrum down to 77 GeV [8], and at higher energies above 10 TeV [9]. Furthermore, the Crab Nebula has been detected above 10 TeV by the VERITAS collaboration [10], HESS collaboration [11], and LST collaboration [12]. The highest energy range was explored by air shower arrays. HAWC and Tibet ASγ [13] detected γ-ray signals around 100 TeV from the Crab Nebula. The result from the Large High Altitude Air Shower Observatory (LHAASO) has extended the spectrum beyond 1 PeV [14, 15]. Meanwhile, MAGIC and VERITAS have detected pulsed emission from the Crab pulsar at TeV energies [16, 17]. Therefore, considering the stable flux and consistent measurements from different experiments, the very high energy regime is commonly used as a "standard candle" to verify the detector performance, including pointing accuracy, angular resolution, background rejection power, and flux determination.
With the start of operation of the full array of the kilometer-square array (KM2A) in 2021, we have re-evaluated the performance of the array and optimized the γ-ray selection criteria, resulting in a significant improvement in sensitivity. After describing the KM2A full array in Section II, we present the optimization of the KM2A full array in Section III. We present the observation of Crab Nebula in Section IV. In the last section we discuss our results and draw conclusions.
II. LHAASO AND KM2A FULL ARRAY
LHAASO (100.01° E, 29.35° N) is a large hybrid extensive air shower (EAS) array located at Haizi Mountain in Daocheng, Sichuan Province, China, whose construction was completed in July 2021. It consists of three sub-arrays [18]: the KM2A for γ-ray astronomy above 10 TeV and cosmic ray physics, the Water Cherenkov Detector Array (WCDA) for γ-ray astronomy above a few hundreds of GeV, and 18 wide field-of-view air Cherenkov telescopes (WFCTA) for cosmic ray physics from 10 TeV to 1 EeV. The KM2A has a field-of-view (FoV) of 2 sr and covers 60% of the sky. A study of the performance of the KM2A half array has been published [19].
The full array of the KM2A started operation in 2021. The layouts of the KM2A half array and full array are shown in Fig. 1. The number of detectors increased in the full array, and they are also more uniformly distributed. As a result, the performance should differ between the two configurations. In principle, the sensitivity of the full array can be enhanced with more suitable data selection criteria.

Fig. 1 (color online) LHAASO layout: the red squares represent the electromagnetic detectors (EDs) and the blue circles represent the muon detectors (MDs). The top panel shows the KM2A half array finished in 2019, which consists of 2365 EDs and 578 MDs; the bottom panel shows the KM2A full array finished in 2021, which consists of 5216 EDs and 1188 MDs. The central white rectangle in the bottom panel indicates the LHAASO-WCDA array region.
Download figure:
Standard imageAn event reconstruction algorithm was developed and applied to the data of the half array. The lateral distribution of shower secondary particles was fitted by a modified Nishimura-Kamata-Greisen (NKG) function [20]:

Here, r is the distance to the air shower axis,  is the total number of particles, s is the age of the shower, and
  is the Molière radius. The density at a fixed distance of 50 m from the shower axis (
 ) was used to estimate the primary energy [19]. The primary direction was reconstructed by fitting the relative arrival times of shower particles to a conical plane [21]. The pointing accuracy of the half KM2A for γ-ray events is estimated to be better than 0.1° and its angular resolution is less than 0.3° above 100 TeV [19].
In this study, the Monte Carlo (MC) data for γ-ray showers were generated using CORSIKA [22] and G4KM2A [23, 24], as previously described in [19]. The same event reconstruction algorithm was applied to the full array data.
III. OPTIMIZATION OF GAMMA-RAY SELECTION CRITERIA
This work focused on the enhancement in performance of the full array for γ-ray source detection by refining the data selection criteria based on the data collected from the KM2A between August 2021 and August 2022. To ensure the reliability of the improvements, we also validated the new selection criteria using data collected between August 2022 and August 2023.
The data selection criteria in [19] are as follows: (1) the shower core is located in the area of the KM2A half array shown in the top panel of Fig. 1; (2) the reconstructed zenith angle is less than  ; (3) the number of particles detected within 40 m from the shower core is larger than that within 40−100 m; (4) the number of electromagnetic detectors (EDs) and the number of particles for the reconstruction are both greater than 10; and (5) the shower age, a parameter in the NKG function, ranges from 0.6 to 2.4. The cut on the value of the γ/hadron discrimination parameter varies with different energy bands. In this work, the data selection criteria in [19] were called the cuts-ha (half-array) data selection criteria, and we derived the cuts-fa (full-array) data selection criteria after optimization.
A.
 hadron discrimination optimization

The low proportion of γ-rays in cosmic rays makes it challenging to distinguish them, which is crucial for ground-based γ-ray astronomy experiments. Various experiments have employed different methods to address this issue. The air Cherenkov telescopes use the shape of the Cherenkov image to discriminate γ-rays and hadrons. Water Cherenkov detectors, such as the HAWC and LHAASO-WCDA [25], take advantage of the different lateral distributions of showers.
When passing through the Earth's atmosphere, a γ-ray will interact with an atomic nucleus in the atmosphere and generate an electromagnetic shower, which is muon-poor, but a background cosmic ray ion will generate a muon-rich hadronic shower. Therefore, the ratio between the measured number of muons and electrons is utilized by the LHAASO-KM2A to discriminate γ-rays from cosmic ray ions. In this study, the same parameter  was employed for discriminating between γ-rays and hadrons [19], where
  and
and  represent the number of muons and electrons, and 0.0001 is included to account for cases with
  = 0.
= 0.
Figure 2 displays the reconstructed core distribution of the cosmic-ray events after the application of the cuts-ha data selection criteria. It is clear that the density is higher at the edge of the array, that is, at a low distance D from the edge. As shown in Fig. 3, more cosmic-ray events are also observed at larger zenith angles. However, there is no concentration of gamma-rays at large zenith angles and at the edge of array, which indicates a weaker rejection power at these regions. In fact, the rejection power is directly related to  (the number of fired detectors), and cosmic-ray events with fewer
  have a higher possibility to be misidentified as photon-like events. Thus, the cosmic-ray events are mainly concentrated at the edge of the array or at large zenith angles, where the rejection power is weaker. The distributions of
  for cosmic-ray events and γ-ray showers are shown in Fig. 4. The data for γ-rays were obtained from the simulation, whereas the data for the cosmic-ray background events were acquired from experimental measurements considering the much larger statistics than the simulation and a negligible contamination from gamma rays. It is obvious that the
  of cosmic-ray showers is less than that of γ-ray showers. Therefore, we can further reduce the background by applying a cut on
  .
.

Fig. 2 (color online) Distribution of the reconstructed core positions for cosmic-ray background events in the KM2A using experimental data after applying the cuts-ha data selection criteria. The color represents the number of cosmic-ray background events, with the maximum value set to 30. The regions of missing events at the edges of the circle are due to the absence of detectors at those positions.
Download figure:
Standard image
Fig. 3 (color online) Distributions of D, distance from the shower core position to the edge of the detector, (top) and zenith angle (bottom) before and after applying the threshold for . The red and blue histograms represent gamma-rays and cosmic-rays, respectively.
Download figure:
Standard image
Fig. 4 (color online) R distributions of the simulated γ-ray (red) and observed cosmic-ray events after γ/hadron discrimination (blue) in the reconstructed energy bin from 39.8 to 63.1 TeV.
Download figure:
Standard imageBased on the information mentioned above, we set a  threshold for each energy bin below 100 TeV by maximizing the significance of the Crab Nebula as presented in Table 1. The number of cosmic-ray events close to the edge of the array and at large zenith angles were reduced with the implementation of a threshold for
  , and the distributions of D and zenith angle for cosmic ray and gamma events became similar (see Fig. 3). As shown in Fig. 5, the number of cosmic ray events with poor muons decreased. In principle, the selection criteria of R should also be changed accordingly. Based on the experimental data collected by the KM2A full-array from August 2021 to August 2022, the significance of the Crab Nebula reaches its maximum in each reconstructed energy bin with a consistent cut of R o approximately −2.4, as depicted in Fig. 6. This indicates that the γ/hadron selection criteria remains constant with respect to the shower energy, in contrast with the previous criteria.
Table 1. Optimized  threshold for each energy
  bin under 100 TeV.

| (10.0,15.8) | (15.8,25.1) | (25.1,39.8) | (39.8,63.1) | (63.1,100.0) |
|---|---|---|---|---|---|

| 20 | 30 | 44 | 58 | 64 |

Fig. 5 (color online) R distributions of simulated protons with the  threshold (top) and without the
  threshold (bottom) in various reconstruction energy bins. The color represents the normalized distribution of R in different energy bins in logarithmic scale.
Download figure:
Standard image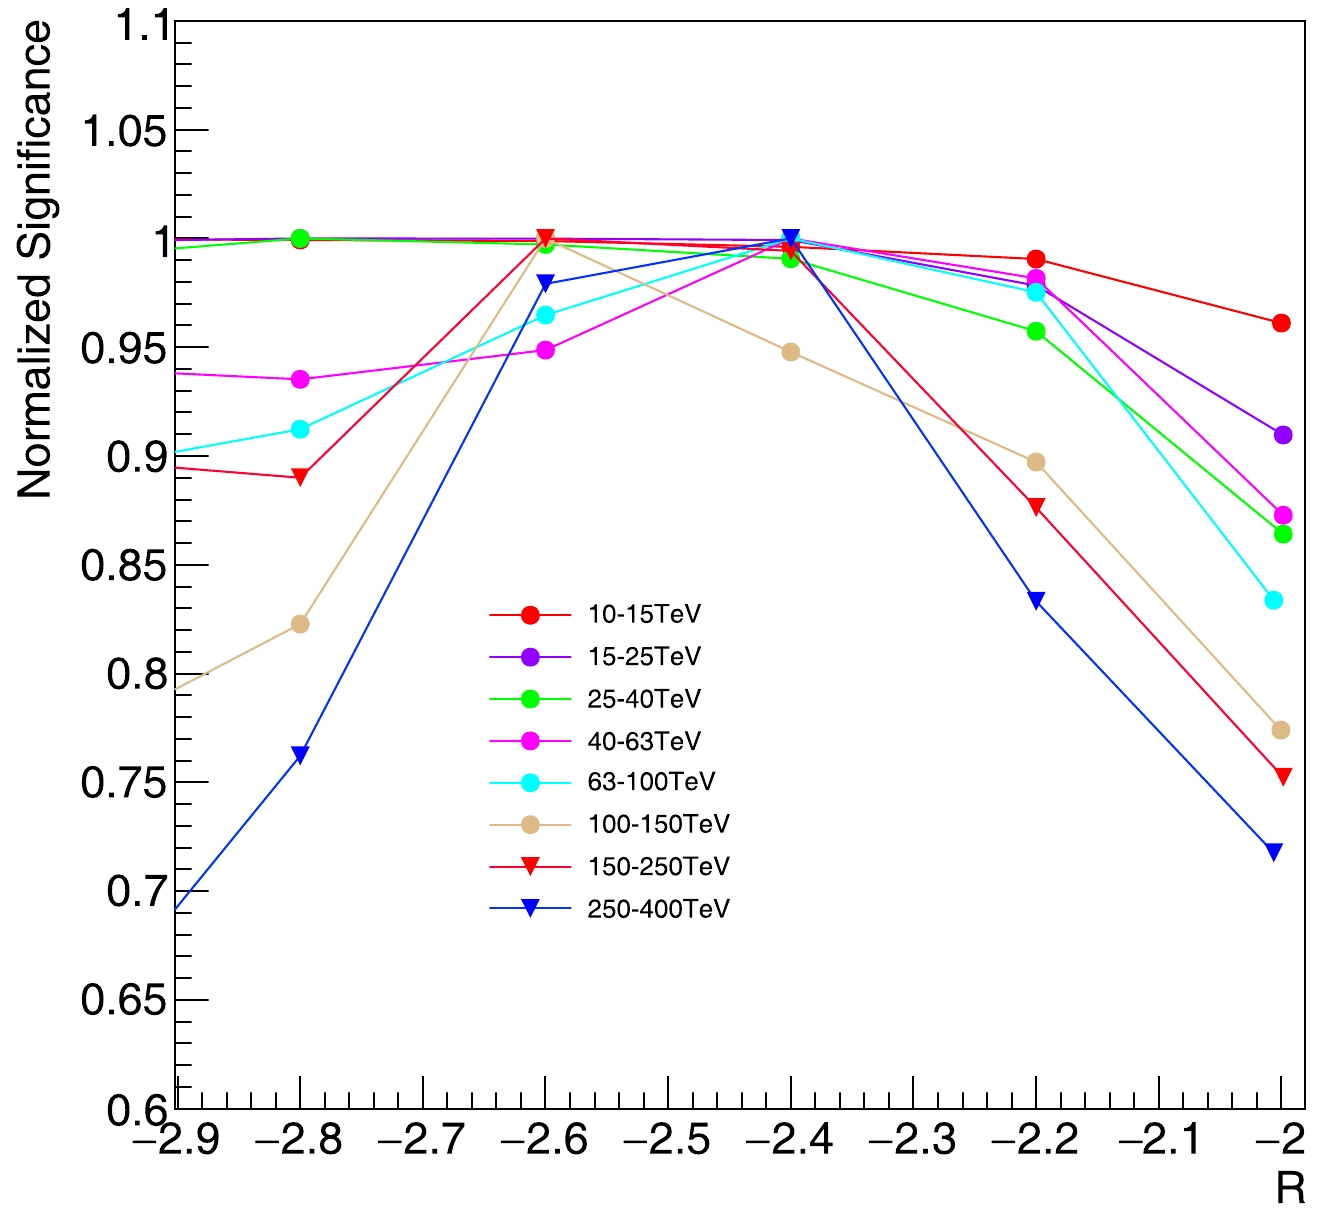
Fig. 6 (color online) Distribution of normalized significance of the Crab Nebula with different R cut levels at each energy band. All the datasets are normalized to their maximum values for better comparability. The normalized significance is calculated as the ratio of the significance to the maximum significance.
Download figure:
Standard imageFinally, the following new data selection criteria were established: (1) the shower core is located in the area of the KM2A full array shown at the bottom of Fig. 1; (2) the zenith angle is less than  ; (3) the number of particles for the reconstruction must be greater than 10; (4) for all the reconstructed energy bins, R must be less than −2.4; and (5) for each energy bin, distinct thresholds for
  are established.
B. Results of optimized hadron discrimination

Even though a large fraction of cosmic-ray events are rejected by the above criteria, especially using R, the muon cut, there are still residual events. Figure 7 shows the survival fraction, defined as the ratio of the number of events after γ/hadron discrimination to the total number of γ-ray or cosmic-ray events. The fraction varies from  to
to  for γ-rays. The rejection power of cosmic-ray induced showers is better than
  above 100 TeV, which is increased by approximately 5 times compared with the value for the half array using the cuts-ha data selection criteria. Moreover, when applying these cuts-fa data selection criteria, the evolution of the survival fraction with energy is smoother than that obtained with the application of the cuts-ha data selection criteria.

Fig. 7 (color online) The survival fraction of γ-ray events (represented by squares, as per the simulation) and cosmic ray background events (represented by inverted triangles, as per observational data) varies with energy after applying γ/hadron discrimination cuts. A blue symbol represents the survival fraction of γ-rays and cosmic rays with the cuts-fa data selection criteria, whereas the red symbol represents the fraction with the cuts-ha data selection criteria.
Download figure:
Standard imageThe effective area of the KM2A for gamma rays was also calculated using simulated events, and it varied with zenith angle and energy. Figure 8 shows the effective area of the KM2A full array at three zenith angles,  , and
, and  . The effective area increases with energy and reaches a constant value at an energy above 400 TeV. The effective area is more than
  above 10 TeV and
  above 100 TeV for a zenith angle of
  .
.

Fig. 8 (color online) Effective area of the KM2A full array for γ-ray showers at three zenith angle ranges after applying the data selection criteria. The error bars are too small to be seen. The gray dashed line represents the actual area of the detector.
Download figure:
Standard imageThe ratio of quality factor, defined as  , was used to quantify the improvement in sensitivity. Here,
  , where
  and
and  represent the survival ratio of γ-rays and cosmic rays, respectively. The value of
  was obtained from the simulation and
  was derived from experimental data. Figure 9 illustrates the quality factor ratio values across various energy bins using two sets of samples. The ratio is approximately 1.41 at 20 TeV and approximately 1.18 at 125 TeV, showing a clear improvement in performance at tens of TeV.

Fig. 9 (color online) Quality factor  =
= in different energy bins. The error bars represent the level of uncertainty in the measurement. Top: Results from August 2021 to August 2022; Bottom: Results from August 2022 to August 2023.
Download figure:
Standard imageIV. RESULTS FOR THE CRAB NEBULA
After optimizing the data selection criteria, we calibrated the performance of the KM2A for γ-ray source detection using the Crab Nebula as a standard candle. The data used in this analysis were collected by the KM2A full-array from August 2021 to August 2022. The data used to verify this optimization (significance and angular resolution) was collected from August 2022 to August 2023. The operational status of each detector was monitored in real time, and only detectors in normal condition were used in the reconstruction [26, 27]. To ensure a stable array performance, the numbers of live EDs and muon detectors (MDs) were greater than 5200 and 1180, respectively. The total effective observation time was of 353.2 days, from August 2021 to August 2022. With a trigger rate of 900 Hz, the number of events recorded by the KM2A full array was  . The background estimation was performed using the direct integral method (DIM) [28], a widely adopted technique utilized by the ARGO-YBJ and HAWC experiments, as well as the KM2A half array [19]. The data selection criteria and the γ/hadron discrimination parameter were discussed in the previous section.
Figure 10 shows the significance of detection of γ-ray in each energy bin from the Crab Nebula using the two different data selection criteria. The significance of γ-ray detection is evidently enhanced with the implementation of the cuts-fa data selection criteria and remains consistent with different datasets. The differential significance is increased by up to 20%, and the integral significance is increased by approximately 15%. The Crab Nebula is observed at a significance of 59.4 σ (53.3 σ with the cuts-ha data selection criteria) at 40−100 TeV.

Fig. 10 (color online) Comparison of significance of detection of γ-rays from the Crab Nebula using two data selection criteria. The black dots represent the significance obtained using the cuts-fa data selection criteria, whereas the blue squares represent the significance obtained using the cuts-ha data selection criteria. The graph on the top shows the results using data collected from August 2021 to August 2022, whereas the graph on the bottom shows the results using data collected from August 2022 to August 2023.
Download figure:
Standard imageThe position of the Crab Nebula γ-ray emission was fitted using a two-dimensional Gaussian function. The deviations in position, compared with the known declination and right ascension, obtained in different energy bins are illustrated in Fig. 11. The pointing is consistent with the Crab Nebula's position within the 1 σ statistical error. From the observations of the Crab Nebula, the pointing error of the KM2A for γ-ray events is estimated to be less than  , even considering the statistical error.

Fig. 11 (color online) Deviation of the measured centroid of γ-ray emission declination and right ascension from the Crab Nebula relation to the known position (22.02, 83.63) as a function of energy.
Download figure:
Standard image
Figure 12 shows the angular resolution obtained from observation of the Crab Nebula at different energy bins after the two γ/hadron discrimination cuts. The  was obtained by fitting the angular distribution with a Gaussian function, which can be used to calibrate the performance of the KM2A. Although the Crab Nebula γ-ray emission is slightly extended [11], it is negligible compared with the Pointing Spread Function (PSF) of the KM2A. It is clear that the angular resolution is improved with the cuts-fa selection criteria and is consistent with the results from MC data. Another independent dataset also confirmed this improvement. The distribution of events as a function of angular distance from the Crab Nebula direction shows good consistency between the simulated and observed data.

Fig. 12 (color online) Distribution of events as a function of the angle from the Crab Nebula direction for both experimental data and MC simulation. The top graph was obtained with the cuts-fa data selection criteria. The middle (2021-2022) and bottom (2022-2023) graphs show the angular resolution in different energy bins. The red squares (dots) represent the angular resolution obtained from experimental (MC) data using the cuts-fa data selection criteria, whereas the blue squares (dots) represent the angular resolution obtained from experimental data using the cuts-ha data selection criteria.
Download figure:
Standard imageThe energy spectrum was obtained using a 3D likelihood method [29], in which the morphological and spectral information were fitted simultaneously. A detailed study indicated that a log-parabola function properly described the spectral behavior of the Crab Nebula [14]. The function form assumed for the forward-folded fit is as follows:

The spectral parameters  , a, b, as well as the positional parameters σ, RA, Dec were selected to maximize the test statistic:

 represents the likelihood value for the signal-plus-background hypothesis, whereas
  represents the value for the background-only hypothesis. The convolution function was obtained by combining the PSF and dN/dE. In this study, we maximized TS and obtained the six parameters (three from dN/dE and three positional parameters) simultaneously using the Tminuit package [30] in root.
The obtained inferred SED of the Crab Nebula is shown in Fig. 13. The resulting differential flux ( ) in the energy range from 10 to 1000 TeV is as follows:

Fig. 13 (color online) Spectrum of the Crab Nebula measured by the KM2A full array using the cuts-fa data selection criteria (red dots). The blue dotted line is the best-fit result using a log-parabola model. The remaining points represent the results of other experiments, including HEGRA [2], HESS [4], MAGIC [31], ARGO-YBJ [32], Tibet ASγ [13], HAWC [21], and previously published LHAASO results [14].
Download figure:
Standard image

where  . For a log-parabola model, the computed TS value amounts to 13464, representing a significant increase of 2334 compared to the cuts-ha data selection criteria. The SED obtained in this work is generally consistent with several previous experimental results. The systematic error for SED measurement mainly comes from the atmospheric model and is independent of the detector. Therefore, the systematic error of the full array does not have a significant change in comparison with previous results of the half array [19].
V. DISCUSSION AND CONCLUSIONS
The performance of the KM2A full array for γ-ray source detection was evaluated using 350 days of data, with the Crab Nebula being analyzed as a "standard candle." The performance was optimized by adjusting the γ/hadron discrimination parameter and setting a threshold for  . Compared with previous studies, the significance of the Crab Nebula was increased by approximately 20%. Additionally, it was found that the pointing error of the KM2A full array was less than 0.03°, with an angular resolution estimated to be less than 0.2° above 100 TeV. The spectrum from 10 TeV to 1000 TeV can be well fitted by a log-parabola model with a spectral index of
  , which is consistent with previous measurements by other detectors.
Our study highlights a significant improvement in sensitivity below 100 TeV, which is beneficial for identifying more low-energy γ-ray sources such as binaries and micro-quasars. However, sources at large zenith angles are disadvantaged by this data selection criteria. In the future, the data will be further optimized specifically for observations at large zenith angles.
ACKNOWLEDGEMENT
We would like to thank all staff members who work year-round at the LHAASO site, 4400 meters above sea level, to maintain the detector and keep the water recycling system, electricity power supply, and other components of the experiment operating smoothly. We are grateful to the Chengdu Management Committee of Tianfu New Area for the constant financial support for research with LHAASO data.
Footnotes
- *
Supported by the National Key R & D Program of China (2018YFA0404201, 2018YFA0404202, 2018YFA0404203, 2018YFA0404204), the National Natural Science Foundation of China (12022502, 12205314, 12105301, 12261160362, 12105294, U1931201), the Youth Innovation Promotion Association CAS (2022010) and in Thailand by the National Science and Technology Development Agency (NSTDA), and the National Research Council of Thailand (NRCT): High-Potential Research Team Grant Program (N42A650868)