
Abstract
We investigate the mechanical and microstructural changes of the densified silica glass under uniaxial loading-unloading via atomistic simulations with a modified BKS potential. The stress–strain relationship is found to include three respective stages: elastic, plastic and hardening regions. The bulk modulus increases with the initial densification and will undergo a rapid increase after complete densification. The yield pressure varies from 5 to 12 GPa for different densified samples. In addition, the Si–O–Si bond angle reduces during elastic deformation under compression, and 5-fold Si will increase linearly in the plastic deformation. In the hardening region, the peak splitting and the new peak are both found on the Si–Si and O–O pair radial distribution functions, where the 6-fold Si is increased. Instead, the lateral displacement of the atoms always varies linearly with strain, without evident periodic characteristic. As is expected, the samples are permanently densified after release from the plastic region, and the maximum density of recovered samples is about 2.64 g/cm3, which contains 15 % 5-fold Si, and the Si–O–Si bond angle is less than the ordinary silica glass. All these findings are of great significance for understanding the deformation process of densified silica glass.
Export citation and abstract BibTeX RIS
1. Introduction
Silica glass is a typical inorganic oxide glass material, which has a three-dimensional topological network structure connected by SiO4 tetrahedron. Research on the structure and mechanical properties of the silica glass has attracted much attention in various fields, such as condensed matter physics,[1,2] materials science,[3] geophysics.[4]
Densification is an important special property of silica glass. As reported,[5–8] the maximum densification is about 21 % recovered from ∼ 20 GPa. This phenomenon was first discovered by Bridgman et al. in the 1950s.[9] They experimentally observed that the recovered silica glass was permanently densified when the external pressure higher than 5–10 GPa. Subsequently, a lot of researches were dedicated to explain the permanent densification mechanism and to characterize the microstructure.[10–16] It was observed that a network topology structure can change from SiO4 tetrahedron to SiO6 octahedron at about 17–25 GPa using infrared spectroscopy.[10] Performing high-energy x-ray diffraction experiments, Benmore et al.[11] found that the average Si–O bond length and the Si–O coordination number increase linearly with the pressure when it is over 15 GPa. In addition, decreases of Si–O–Si and O–Si–O angles of silica glass[12,13] and decrease of ring size in the intermediate-range order[3,8] were observed for the densification. Generally, it is very difficult to detect the atomic structures experimentally. These microstructural changes during compression provide an ideal basis for atomic simulation.
Nowadays, molecular dynamics (MD) simulations have been widely used to study structures and dynamic response of silica glass.[17–26] Zeidler et al.[17] used MD and experiments to establish the relationship between the ring size and Si–O coordination number of silica glass under cold compression conditions, which is helpful for understanding the densification process. Huang et al.[18] simulated the cold and hot compression of silica glass. They studied the effect of temperature on the microstructural changes during compression. In some fields, optical devices are susceptible to damage under intense irradiation, so it is vital to understand the damage mechanism under shock compression. By simulating shock compression, Kubota et al.[19,20] mainly studied the transformation in intermediate-range order of silica glass in elastic and plastic regime. Renou et al.[21] focused on the structural change of silica glass in elastic regime up to ∼ 8 GPa. Their results showed that the structural changes of silica glass are dominated by free volume in the elastic compression. Shock compression is an extreme case of one-dimensional strain process that contains shear effects. Some researchers have studied the effect of shear on the deformation of silica glass under the external pressure.[22,23]
However, it is still little known about the one-dimensional strain induced response of densified silica glass. In this work, we explore the microstructural and mechanical response of differently densified silica glass under uniaxial loading-unloading based on atomistic simulations. The different silica glass samples are obtained by the pressure quenching method. The rest of this paper is organized as follows: computational details are given in Section 2, results and discussion are given in Section 3, conclusions are lastly drawn in Section 4.
2. Computational details
The BKS potential[27] is a two-body potential based on the Buckingham potential with an added Coulombic term, which can accurately reproduce the static structure and dynamic characteristics of silica glass.[23,28–30] In this work, to avoid the possible nonphysical effect at small interatomic distance and to improve calculation stability, the modified BKS potential improved by Barmes et al.[31] is employed, which is expressed as follows:
where rij represents the interatomic distance, atoms i,j = {Si, O}, rc = 6 Å,  Å,
Å,  Å; A0 = e2 / 4π ε0 = 2.307 × 10⁻²⁸ J ⋅ m, qSi = 2.4, qO = −1.2; parameters Aij, Bij, Cij, and aij, bij, cij are taken from Refs. [27,31], as listed in Table 1.
Table 1. Values of Aij, Bij, Cij, and aij, bij, cij are taken from Refs. [27,31].
| Aij/J | Bij/m−1 | Cij/J⋅m6 | aij/(J/m2) | bij/(J/m) | cij/J | |
|---|---|---|---|---|---|---|
| O–O | 2.225 × 10⁻¹⁶ | 2.760 × 10¹⁰ | 2.804 × 10−77 | 1.510 × 10² | −7.925 × 10⁻⁸ | 1.100 × 10⁻¹⁷ |
| Si–O | 2.884 × 10⁻¹⁵ | 4.873 × 10¹⁰ | 2.139 × 10−77 | 3.413 × 10² | −9.361 × 10⁻⁸ | 3.925 × 10⁻¹⁸ |
| Si–Si | 0.0 | 0.0 | 0.0 | 0.0 | 0.0 | 0.0 |
The densified silica glass is prepared by the pressure quenching method which has been previously used by Huang et al.[32] to study the transition between brittleness and ductility. The 44 × 44 × 66 primitive super cells of β-cristobalite (2.2 g/cm3, the typical density of ordinary glass[33]) is used as an initial configuration containing 3066624 atoms (1022208 Si, 2044416 O). Firstly, the initial configuration is melted at 6000 K for 200 ps under different pressures (0, 2, 4, 7, 10 GPa). Then, the molten silica glass is cooled from 6000 K to 300 K for 100 ps. As reported in the literature,[34] the silica glasses prepared by different cooling rates (1, 5, 25, 50, 100 K/ps) show little difference. Thus, we just consider the same cooling rate of 57 K/ps for all the samples. Next, the pressure of the system is reduced to 0 GPa within 100 ps. Finally, the samples are equilibrated at 300 K under 0 GPa for 100 ps. The densities of the final samples (denoted as S1–S5) are 2.20, 2.31, 2.41, 2.54, 2.66 g/cm3, and the proportions of 3-fold, 4-fold, 5-fold, and 6-fold Si atoms of S1–S5 are given in Table 2.
All the MD simulations are performed using the open source software large scale atomic/molecular massively parallel simulator (LAMMPS[35]). The velocity-Verlet algorithm is used to integrate the equations of motion with a time step of 1 fs. X, Y, Z directions are set to periodic boundary conditions. The Nose–Hoover thermostat[36] is used to control pressure and temperature. The free parameters regulating the response time are chosen to be Tdamp = 0.1 ps and Pdamp = 1 ps. For silica glass samples S1–S5, the uniaxial loading-unloading process is along the Z direction in the NVT ensemble at 300 K. The samples are uniformly strained up to 50 % and unloaded from different strains at a strain rate of 1010 s−1.
Table 2. The proportions of 3-fold, 4-fold, 5-fold, and 6-fold Si atoms of S1–S5.
| 3-fold Si/% | 4-fold Si/% | 5-fold Si/% | 6-fold Si/% | |
|---|---|---|---|---|
| S1 | 0 | 98.94 | 1.01 | 0 |
| S2 | 1.06 | 96.55 | 1.87 | 0.01 |
| S3 | 1.05 | 94.87 | 3.53 | 0.04 |
| S4 | 1.06 | 90.49 | 7.77 | 0.18 |
| S5 | 1.04 | 84.26 | 13.67 | 0.53 |
3. Results and discussion
3.1. Stress–strain relationship
We first explore the stress-strain relationship of all the samples under uniaxial compression. As shown in Fig. 1, with the increase of strain (1 − V/V0), the Z-direction normal stress σz and the maximum shear stress τmax = (σz − σx)/2 change significantly in three stages: elastic, plastic and hardening regions. In the elastic region, the bulk modulus of the silica glass samples decreases approximately linearly with strain, which is consistent with the "elastic anomaly" described in the hydrostatic compression literature.[22,37] Uniaxial compression does not change this anomalous behavior. When the strain reaches about 0.1, the change of maximum shear stress indicates the silica glass samples occur plastic flow, and the bulk modulus increases slowly with strain. The maximum shear stress and shear modulus are basically unchanged, showing a plateau curve. In the hardening region, the bulk modulus of the samples rapidly increases with strain, which makes the samples more resistant to deformation. By comparing the stress-strain curves of S1–S5, we find that the bulk modulus increases with the initial densification, showing the trend of downward parabola, and the densified samples enter the compressive hardening stage earlier than S1.
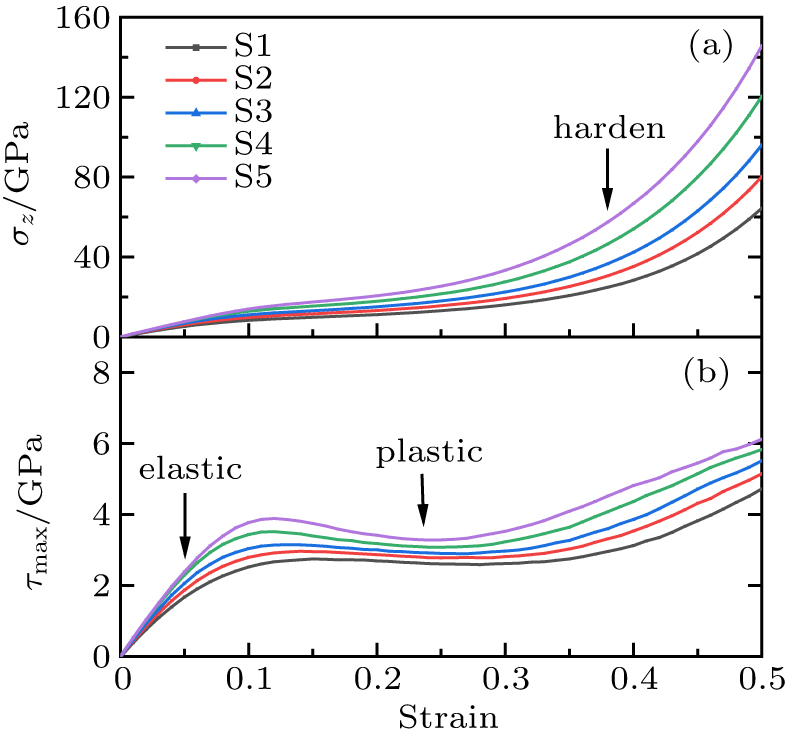
Fig. 1. Normal stress (a) and maximum shear stress (b) as a function of strain for different silica glass samples (S1–S5). Three stages are displayed, and hardening tendency increases with initial densification.
Download figure:
Standard imageThe density-pressure curves are shown in Fig. 2 and compared with experimental data. The results of S1 under uniaxial compression in elastic region are agreement with shock compression experiments.[21] The high strain rate in our study is actually close to the shock compression condition. After elastic region, the results of simulation and hydrostatic compression experiments[38,39] show similar trends and values. Tracy et al.[40] mentioned that the elevated temperature provides an additional compression mechanism to make it denser compared with cold compression (300 K) when the shock pressure is in the range 20–35 GPa. The temperature in our simulation remains at 300 K, so the density change in the high pressure region is consistent with the hydrostatic compression experiments. It can also be seen from Fig. 2 that the curves of S1–S5 rise in parallel in the elastic region, and all samples show a softening and approach the curve of ordinary glass S1 with the increase of pressure. The apparent inflection points in the curves imply that the yield pressure increases with the initial densification of sample (S1: ∼ 5 GPa, S5: ∼ 12 GPa). All the density-pressure curves converge at about 12 GPa, showing that the density changes of all the samples remain consistent with each other under high pressure conditions.
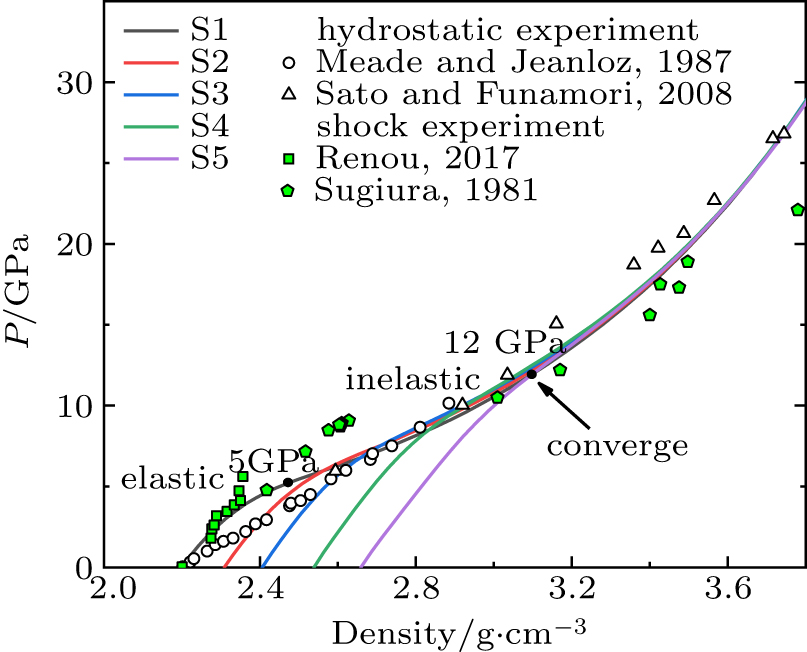
Fig. 2. Pressure-density relation for silica glass samples: present study compared with the experiments. Curves S1–S5: under uniaxial compression; circle and triangle: hydrostatic experimental data obtained by Meade et al.[38] and Sato et al.;[39] square and pentagon: shock experimental data obtained by Renou et al.[21] and Sugiura et al.[41] Yield pressure of densified silica glass ranges from 5 to 12 GPa. All curves converge at 12 GPa.
Download figure:
Standard image3.2. Densification and microstructure analysis
In order to study the permanent densification of silica glass, we simulated the uniaxial unloading processes of ordinary glass S1 (2.2 g/cm3). Figure 3 shows the pressure–density curves of S1, including unloading from different strains. The density of the glass unloaded from point A (corresponding to the elastic region in Fig. 1) is still the same as the initial sample, and the coincidence of loading and unloading curves shows the elastic reversible property. It can be seen that the plastic deformation of silica glass is accompanied by permanent densification when the compression is released from point B (P ∼ 8 GPa). When the pressure is higher than 25 GPa, the unloaded sample reaches the maximum densification (20 %), consistent with the hydrostatic experiments (21 %).[5,6,42,43] This result indicates that uniaxial compression does not change the maximum densification of silica glass. When the plastic flow of silica glass occurs, the pressure states at the same density in the loading and unloading paths are obviously inconsistent, which indicates that an irreversible structural transition has occurred. This hysteresis phenomenon also exists in hydrostatic compression simulations.
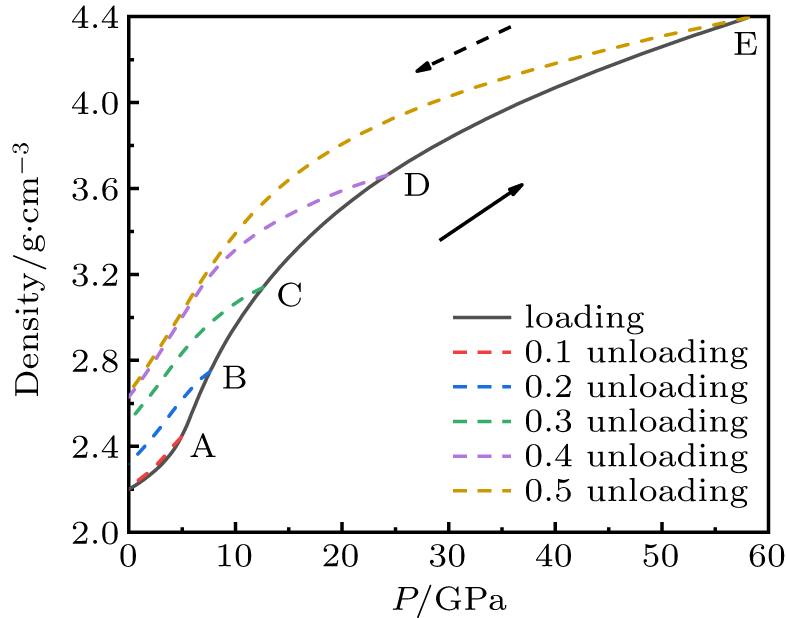
Fig. 3. Density as a function of pressure for S1 during uniaxial loading-unloading. Densification and hysteresis are both shown. A, B, C, D and E correspond to strains of 0.1, 0.2, 0.3, 0.4, and 0.5, respectively. The solid line represents the loading path, and the dotted lines are the unloading paths.
Download figure:
Standard imageGenerally, the densification mechanism of silica glass can be partially shown by the change of short-range orders. The pair radial distribution function (RDF), bond angle distribution (BAD), and coordination number are used to characterize atomic rearrangement during uniaxial compression. Figure 4 shows the Si–Si, Si–O and O–O pair RDFs of S1 at different strains and unloaded from different strains. It can be seen from Figs. 4(a)–4(c) that the first peak positions of Si–O, Si–Si, O–O RDFs shift significantly with strain after elastic region, indicating that the bond length has changed. The Si–O bond length increases from 1.625 Å to 1.675 Å. The Si–Si and O–O bond lengths decrease from 3.185 Å to 3.055 Å and from 2.635 Å to 2.385 Å, respectively. At the strain of 0.3 (density: 3.14 g/cm3) (P ∼ 12 GPa), the first peak of the Si–Si pair RDF splits into two peaks obviously. This phenomenon could also occur in the hydrostatic compression by MD simulation.[22] By analyzing the RDFs of silica glass up to 4.42 g/cm3, Njuyen et al.[30] proposed the splitting is caused by O atoms connected SiOx (x = 4, 5, 6) units. Above the strain of 0.4 (density: 3.66 g/cm3) (P ∼ 24 GPa), a new second peak appears in O–O pair RDF at 3.4 Å. This result is consistent with densified silica glass (3.59 g/cm3).[30] The peak splitting and the new peak all occur in the compressive hardening region. As shown in Figs. 4(d)–4(f), the bond length of the silica glass unloaded from different strains is restored to the initial state and the splitting of the peak and the new second peak disappear. These characteristics cannot represent irreversible densification (Fig. 3).
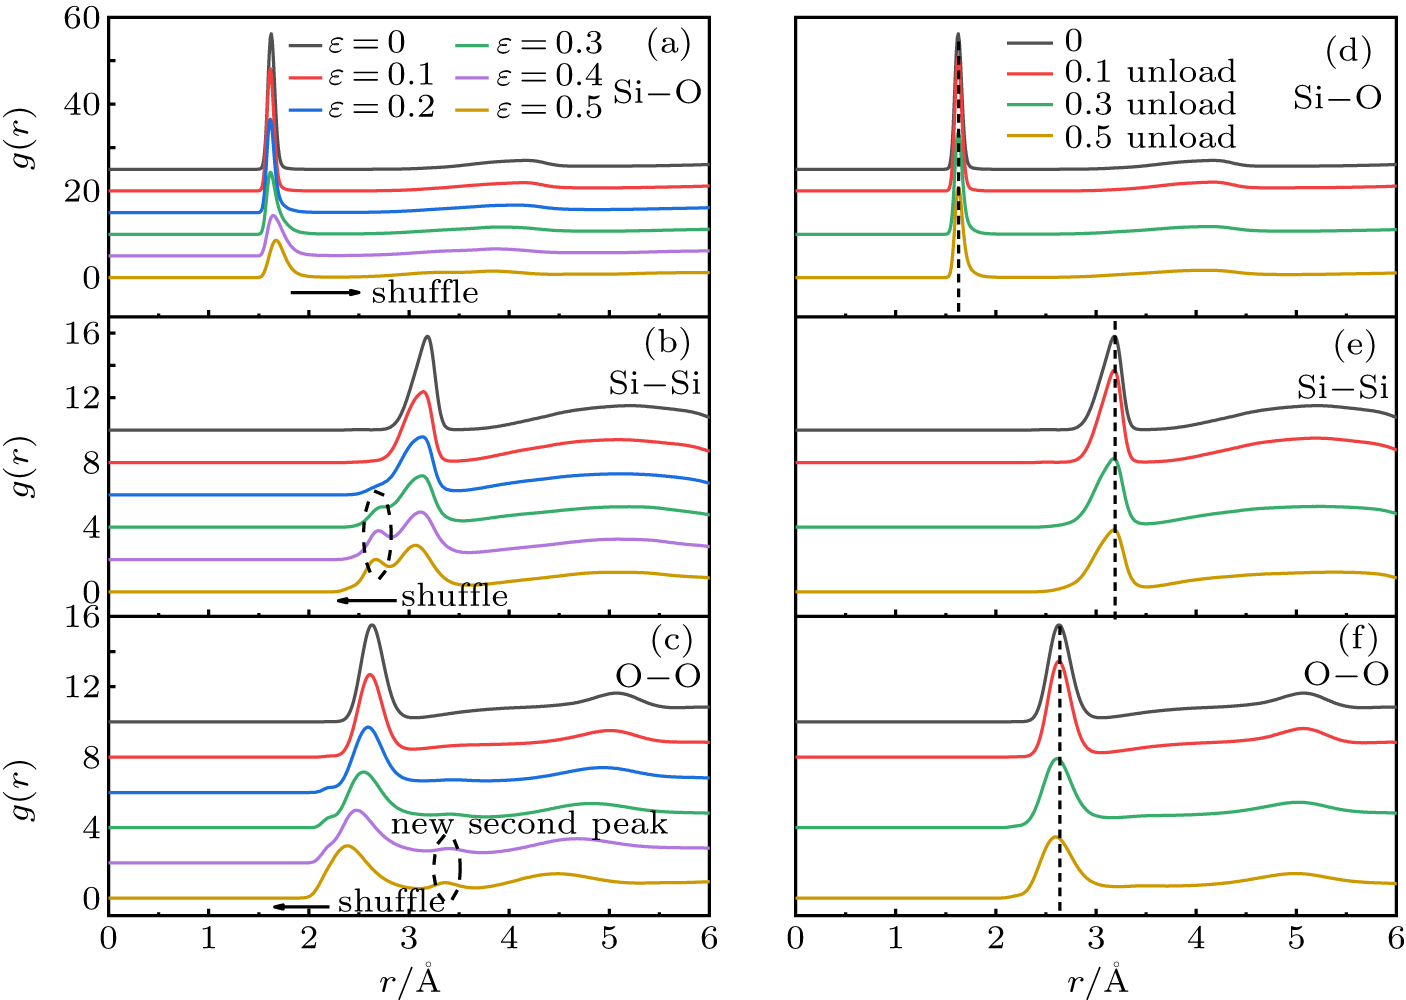
Fig. 4. RDFs of Si–O (a) Si–Si (b) O–O (c) for S1 at different strains. RDFs of Si–O (d) Si–Si (e) O–O (f) for glass unloaded from different strains. The arrows indicate the change of the peak position. The RDFs of the unloaded sample are consistent with the initial state.
Download figure:
Standard imageFigure 5 shows the Si–O–Si and O–Si–O BADs of S1 at different strains and unloaded from different strains. It can be seen from Fig. 5(a) that the Si–O–Si bond angle decreases with strain. A new second peak appears at 100° when the plastic flow of silica glass occurs, which indicates that a new connection mode between the tetrahedrons appears. The MD simulation of hydrostatic compression has the similar results.[22] When the strain higher than 0.3, the O–Si–O bond angle decreases and peak splitting occurs at 78°. Figures 5(c) and 5(d) show that the BADs of the silica glass unloaded from the elastic region are consistent with the initial state. The intertetrahedral Si–O–Si angle decreases when silica glass is unloaded from inelastic region. The previous study[43] has shown that the reduction is related to the densification mechanism of silica glass. Figure 5(d) shows that the peak of the O–Si–O BAD broadens, indicating that the SiO4 tetrahedrons in the unloaded glass are deformed. These irreversible changes of bond angles show plastic behavior related to permanent densification.
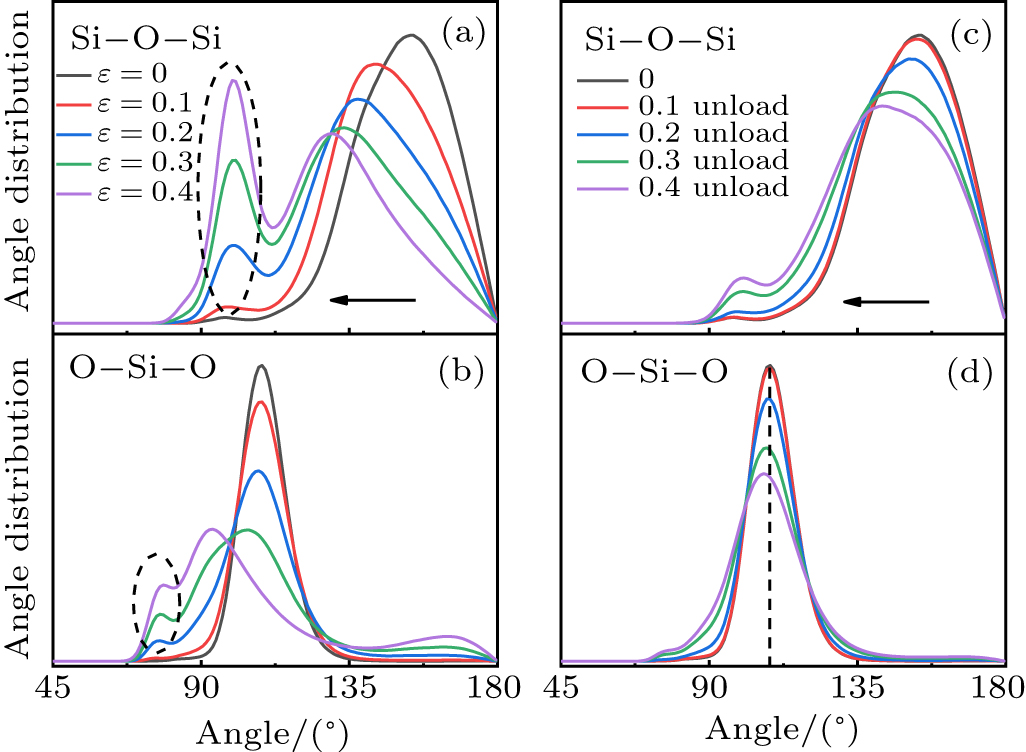
Fig. 5. BADs of Si–O–Si (a) O–Si–O (b) for S1 at different strains. BADs of Si–O–Si (c) O–Si–O (d) for glass unloaded from different strains. The arrows indicate the change of the peak position. The Si–O–Si bond angle of silica glass unloaded from the inelastic region becomes smaller.
Download figure:
Standard imageAs shown in Fig. 6, we integral the Si–O pair RDF of S1 at different strains.  , where n represents the number of O atoms per unit volume, r is the radius length from the central Si atom. As strain increases, the average Si–O coordination number obtained by the platform of curves nearly increases from 4 to around 6. This indicates that 4-fold coordinated Si converts to 5-fold or 6-fold Si during compression. Especially at 0.3 strain (P ∼ 12 GPa) the coordination number has changed significantly. This is different from a MD simulation about hydrostatic compression of silica glass up to 20 GPa,[37] which shows the coordination number of Si–O is not obviously changed. The pressure range for appearance of the Si–O coordination defects in experimental studies is wide, which is a controversial issue. Some measurements[8,10,44] have shown that Si–O coordination number increases when the pressure above 20 GPa. Benmore et al.[11] found that the Si–O coordination number increases linearly with the pressure above 15 GPa. The shear effect in uniaxial compression may promote the conversion of SiO4 tetrahedron to SiO5 and SiO6 octahedron.
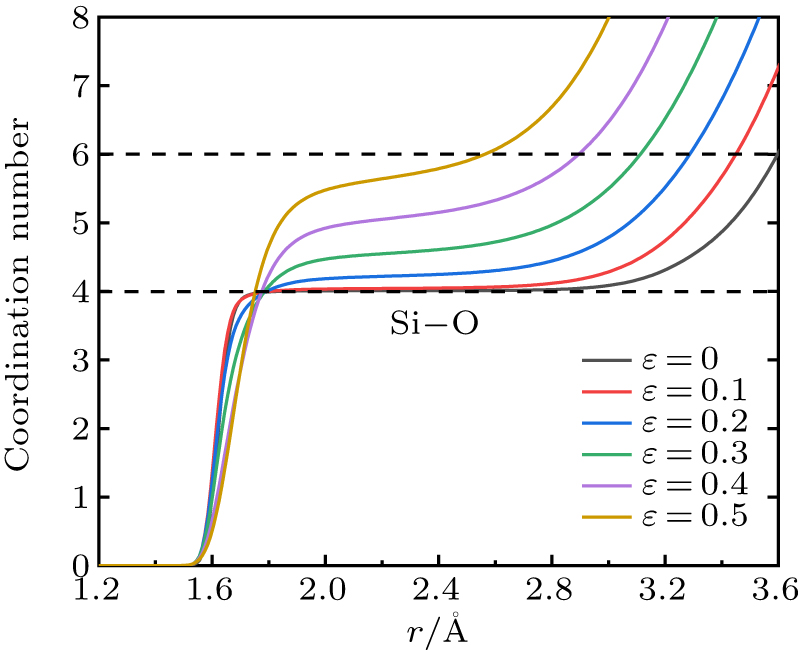
Fig. 6. Si–O coordination number curves of S1 at different strains. The average coordination number of Si–O increases with strain from 4 to around 6.
Download figure:
Standard imageFigure 7 shows the fractions of 4-fold, 5-fold, 6-fold coordinated Si atoms of S1 during uniaxial compression. In the elastic region, the network topology structure of silica glass is made of SiO4 tetrahedron. When compressed into the plastic region, the 5-fold Si atoms increase linearly with strain. The fraction of 5-fold Si atoms reach ∼ 45 % at strain of 0.3 (P ∼ 12 GPa). In the hardening region, a large number of 4-fold Si atoms are converted into 5-fold and 6-fold Si atoms. The fraction of 5-fold Si atoms increases first and then decreases. When compressed from 0.4 to 0.45 strain, the fraction of 5-fold Si atoms decreases from 56 % to 46 %. Here 6-fold Si atoms converted from small part 5-fold Si and 4-fold Si increase rapidly with strain. The fraction of 6-fold Si atoms reaches ∼ 50 % at strain of 0.45 (P ∼ 36 GPa). Using MD to simulate hydrostatic compression, Liang et al.[45] have inferred that the appearance of 5-fold Si drives plastic behavior. Combining the stress-strain curve (Fig. 1), we analyze that the microscopic behavior of plastic flow is a large increase of 5-fold Si atoms and the conversion of 6-fold Si results in a rapid increase of bulk modulus in hardening region. In addition, the recovered fully densified silica glass still has 15 % 5-fold Si atoms, not shown here. This also shows the irreversible plastic behavior similar to the change of Si–O–Si BAD.
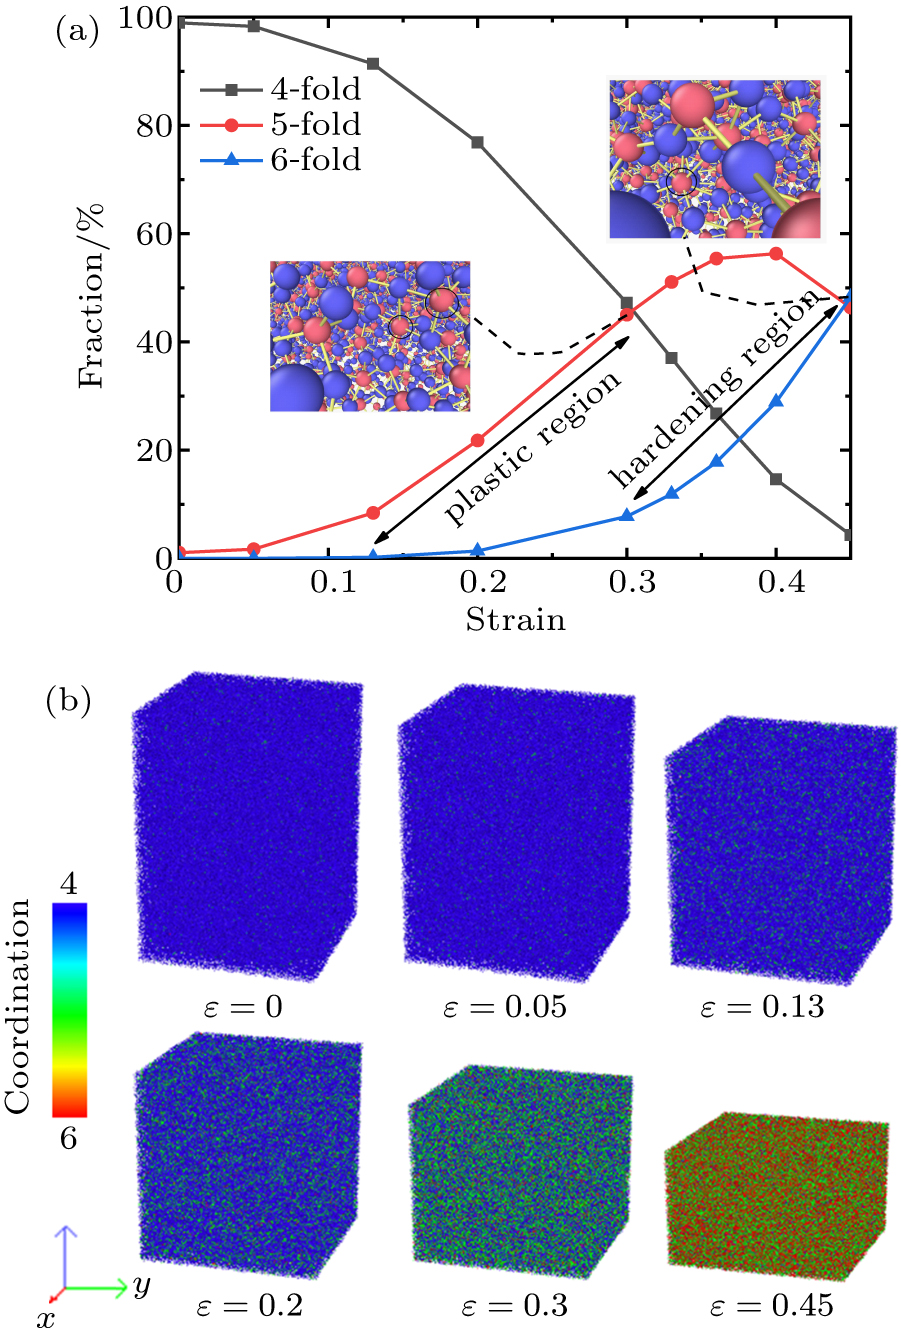
Fig. 7. (a) Fractions of 4-fold, 5-fold, 6-fold coordinated Si atoms versus strain. Pink atoms: Si, blue atoms: O in the insert figure). Here 5-fold Si increases linearly with strain in plastic region and 6-fold Si increases mainly in hardening region. (b) Color micrographs of Si atoms according to the coordination number CN color bar. The figure only includes Si atoms. The cutoff distance for coordination is set to 2.4 Å.
Download figure:
Standard imageIn addition, we track the atoms (N = 130238) in the region (20 nm < Z < 22 nm) of the initial sample, and calculate the displacement in the X–Y plane (![$R(i)=\sqrt{{[x(i)-{x}_{0}(i)]}^{2}+{[y(i)-{y}_{0}(i)]}^{2}}$](https://content.cld.iop.org/journals/1674-1056/29/10/108101/revision2/cpb_29_10_108101_ieqn4.gif) , where i represents the atomic number, x0 (i) and y0 (i) represent the atomic positions at the initial state). As shown in Fig. 8(a), the average displacement in the X–Y plane does not show periodic characteristic and increases linearly with strain in all regions, reflecting the atomic diffusion law of silica glass during uniaxial compression. Figure 8(b) shows the microstructure in X–Y plane at different strains colored by R(i). First, all atoms diffuse uniformly in the X–Y plane in elastic region. Then, the degree of local atomic diffusion significantly increases as shown from the view at 0.13 strain and 0.3 strain, which may be related to the formation of SiO5 and SiO6, corresponding to the increase of 5-fold Si and 6-fold Si in Fig. 7(a).
, where i represents the atomic number, x0 (i) and y0 (i) represent the atomic positions at the initial state). As shown in Fig. 8(a), the average displacement in the X–Y plane does not show periodic characteristic and increases linearly with strain in all regions, reflecting the atomic diffusion law of silica glass during uniaxial compression. Figure 8(b) shows the microstructure in X–Y plane at different strains colored by R(i). First, all atoms diffuse uniformly in the X–Y plane in elastic region. Then, the degree of local atomic diffusion significantly increases as shown from the view at 0.13 strain and 0.3 strain, which may be related to the formation of SiO5 and SiO6, corresponding to the increase of 5-fold Si and 6-fold Si in Fig. 7(a).
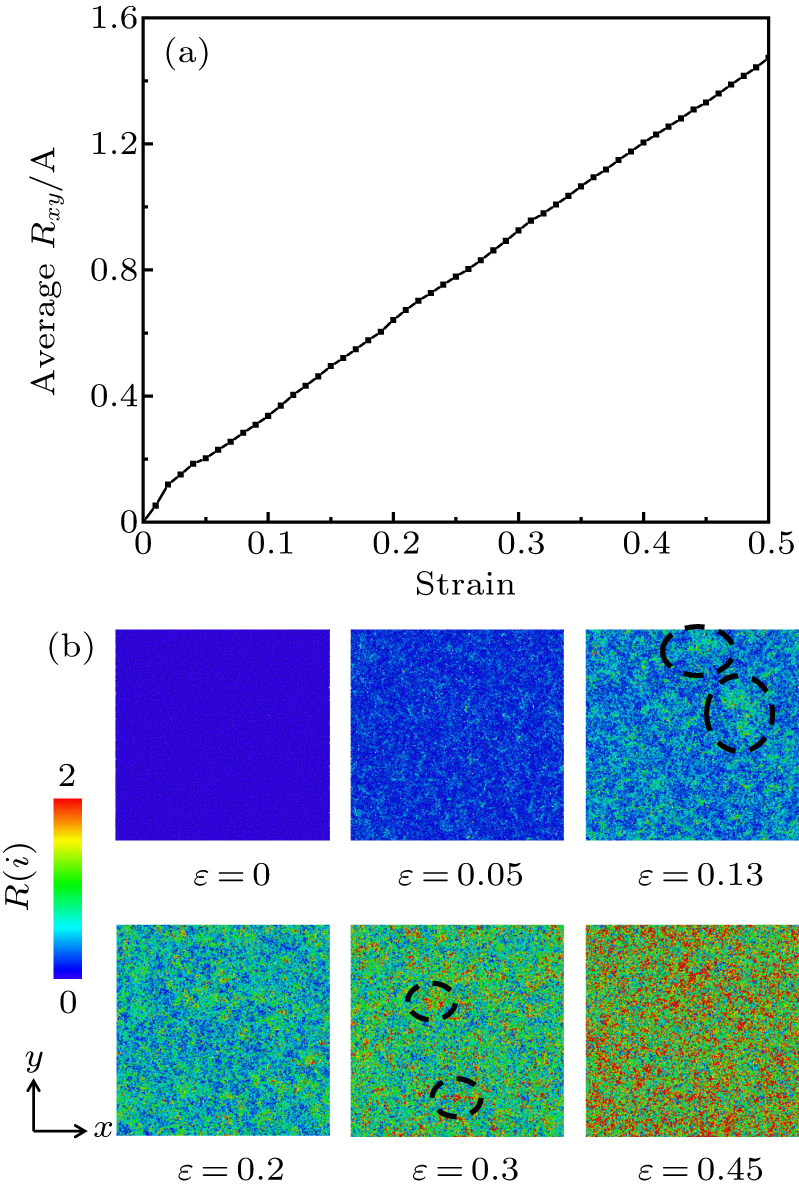
Fig. 8. (a) Average atomic displacement as a function of strain, and (b) microstructure of atoms in X–Y plane at different strains according to the R(i) color bar. The law of atomic lateral diffusion during uniaxial compression is shown.
Download figure:
Standard image3.3. The effect of initial densification
In this subsection, the uniaxial loading-unloading processes of densified silica glass samples S2–S5 are compared. Figure 9 shows the density of unloaded silica glass at 0 GPa as a function of the maximum strain reached. Sample S5 is not further densified after loading-unloading. There is no densification for S1–S4 unloaded from elastic region. Silica glass samples S1–S4 are permanently densified when unloaded from plastic region, and reach the maximum density (2.64 g/cm3) from the hardening region. From the comparison of S3 and S4 curves, it can be inferred that the larger the initial density, the smaller the strain required to reach the maximum density.
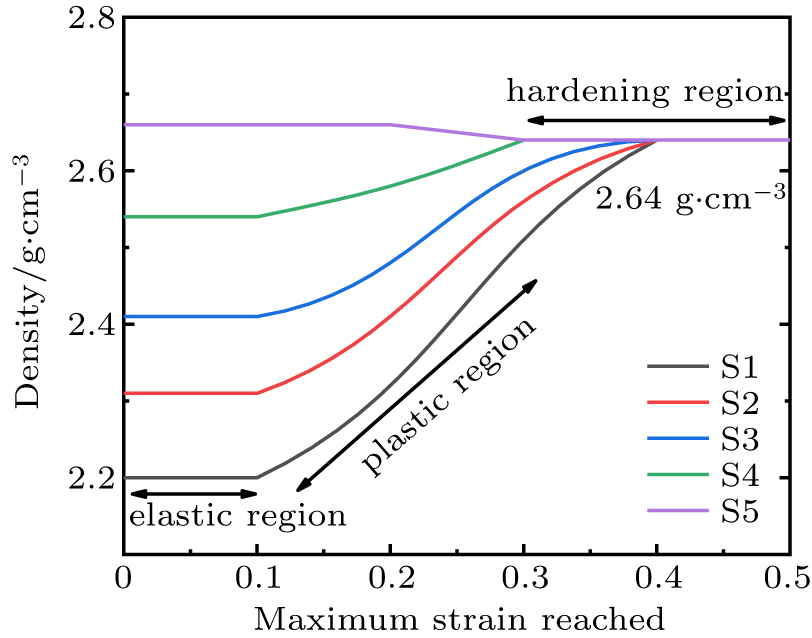
Fig. 9. The density of recovered glass at 0 GPa as a function of the maximum strain reached. Results for all the samples are displayed.
Download figure:
Standard imageFigures 10(a) and 10(b) show the pressure–density curves for S3 (2.41 g/cm3) and S5 (2.66 g/cm3), including unloading from different strains. The data of fully densified S5 are compared with the experimental data.[42] The loading and unloading curves for S3 and S5 in the elastic region coincide, in agreement with the experimental results for hydrostatic compression on intermediate densified[6] and fully densified[42] silica glasses. In this region, the densified silica glasses exhibit elastic behavior. However, the pressure on the densified silica glasses was below 10 GPa in those experiments. Above elastic region, there is a hysteresis in the loading and unloading curves and silica glass is permanently densified due to plastic flow. It is interesting that the S5 sample does not exhibit second densification, while there is also a hysteresis in the volume response of loading and unloading. The structural changes of high-density silica glass S5 under uniaxial compression are shown in Fig. 11 and Table 3.
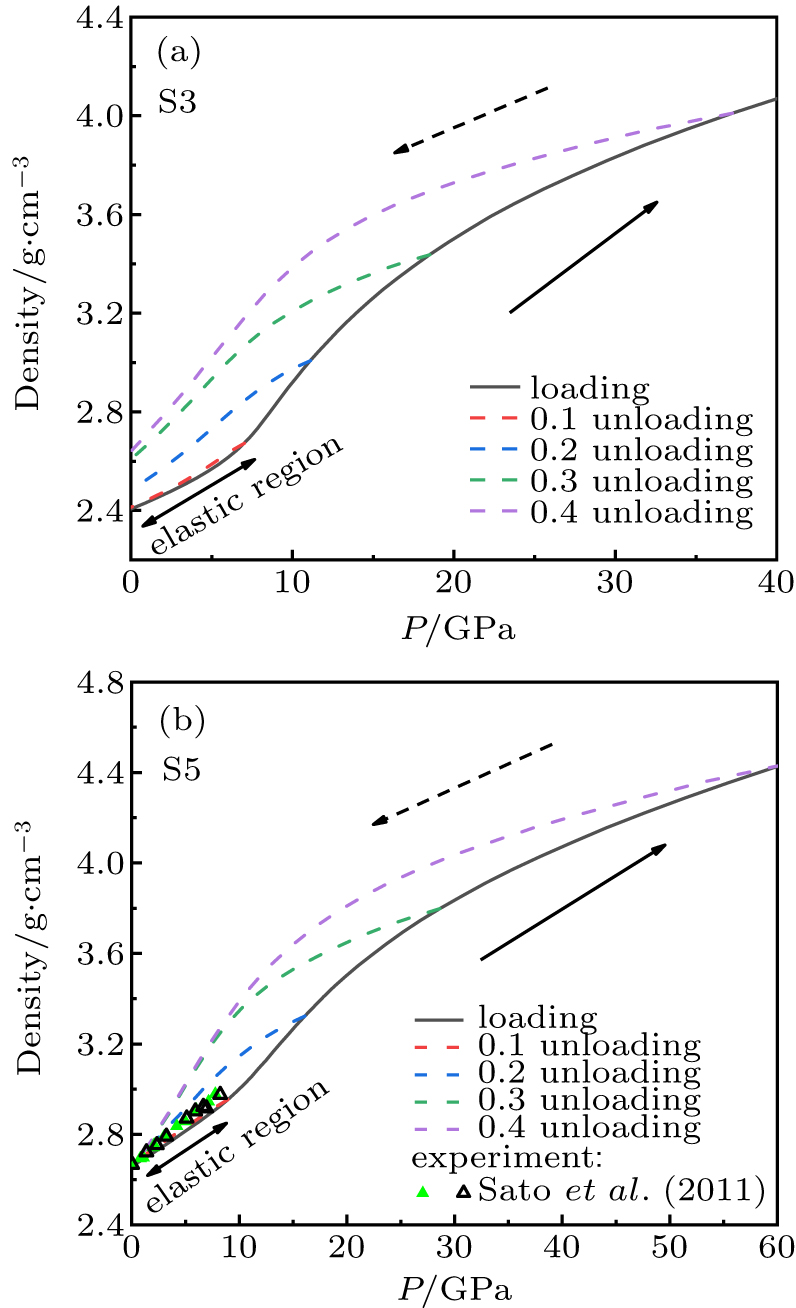
Fig. 10. Density as a function of pressure for S3 (a) and S5 (b) during uniaxial loading-unloading. Solid and hollow triangles represent the hydrostatic experimental data on compression and decompression obtained by Sato et al.[42].
Download figure:
Standard image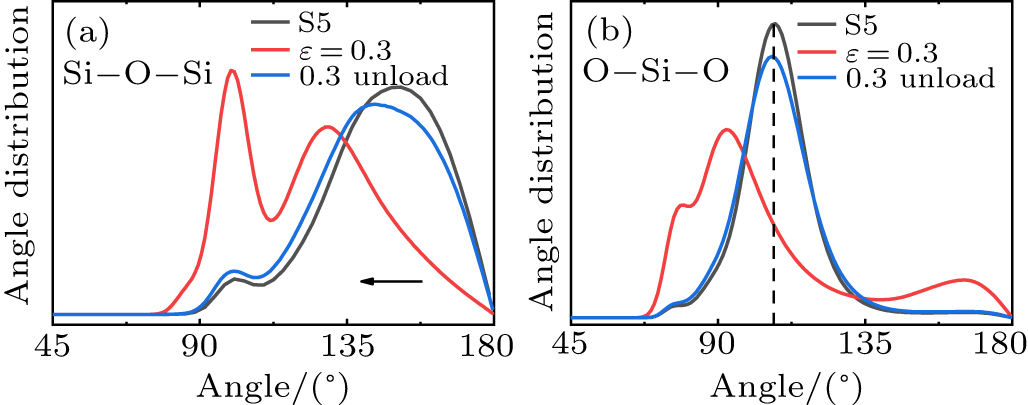
Fig. 11. BADs of Si–O–Si (a) O–Si–O (b) for the initial state, 0.3 strain, unloaded state of S5. The arrows indicate the change of the peak position. The Si–O–Si bond angle becomes smaller.
Download figure:
Standard imageFigure 11 shows the Si–O–Si and O–Si–O BADs of the initial state, 0.3 strain, and unloaded state of S5. It can be seen from Fig. 11(a) that the Si–O–Si bond angle decreases after undergoing loading-unloading for S5. This appears as a structural change in plastic deformation. Figure 11(b) shows that the O–Si–O bond angle of silica glass is not changed when unloaded from 0.3 strain. Table 3 shows the proportions of 4-fold, 5-fold, and 6-fold Si atoms of the initial state, 0.3 strain, and unloaded state of S5. The unloaded sample contains ∼ 15 % 5-fold Si atoms, which is consistent with the result of the fully densified silica glass unloaded from the hardening region for S1. Different from S1, the proportions of 4, 5, and 6-fold Si atoms for the unloaded state are basically consistent with the initial state, and there appears no second densification.
Table 3. The proportions of 4-fold, 5-fold, and 6-fold Si atoms of the initial state, 0.3 strain, and unloaded state of S5.
| 4-fold Si/% | 5-fold Si/% | 6-fold Si/% | |
|---|---|---|---|
| S5 | 84.26 | 13.67 | 0.53 |
| 0.3 strain | 10.58 | 53.37 | 34.88 |
| 0.3 strain_unload | 81.93 | 15.89 | 0.66 |
4. Conclusions
In this wok, MD simulations are conducted to investigate the mechanical behavior and microstructural change of densified silica glass in the uniaxial loading-unloading process. Firstly, the stress-strain curves can be divided into the elastic, plastic and hardening regions. As for the same densified glass, the bulk modulus rapidly increases with strain after complete densification. Comparison of different samples determines that the bulk modulus varies with the initial densification, showing the increase of downward parabola. In addition, the pressure–density curve is in agreement with the shock experiments in elastic region and hydrostatic compression in the inelastic region. The yield pressures of densified silica glass samples are different, and the pressure–density curves finally converge at about 12 GPa.
The microstructure analysis shows several characteristics in the different compressive stages. In the elastic compression, the main performance is the decrease of the Si–O–Si bond angle. When the silica glass is plastic deformed, the 5-fold Si atoms increase linearly with the stain. In the hardening stage, the RDF analysis shows that the peak of Si–Si splits into two peaks and a new peak appears at 3.4 Å in the O–O pair RDF. Meanwhile, SiO4 tetrahedron begins to convert into SiO6 octahedron, which results in the rapid increase of bulk modulus. The lateral displacement of atoms in the X–Y plane increases linearly with strain in all regions, reflecting the law of atomic diffusion during uniaxial compression.
In addition, the loading-unloading processes show that permanent densification occurs when silica glass is unloaded from the plastic region, and all the samples reach the maximum density (2.64 g/cm3) after unloading processes. The larger the initial density, the smaller the strain required to reach the maximum density. Furthermore, the decrease of the Si–O–Si angle and the presence of 5-fold Si defects (∼ 15 %) in recovered fully densified glass represent the irreversible plastic behavior of densification.
Footnotes
- *
Project supported by the National Natural Science Foundation of China (Grant Nos. 51727807 and 11875318), Beijing Institute of Technology Research Fund Program for Young Scholars, and Yue Qi Young Scholar Project in CUMTB.