


Abstract
This paper describes the experimental monitoring of pancreatic oxidative metabolism in laboratory mice that combines the methods of fluorescence and diffuse reflectance spectroscopy and laser speckle contrast imaging with a pancreatic ischemia model. The combined measurements show a close dependence of tissue metabolism on blood and oxygen supply. We show that deactivation of complex I and complex II occurs in mouse pancreatic tissue during prolonged hypoxia. We conclude that complex I can potentially undergo more intensive deactivation when oxygen is lacking than complex II. We have demonstrated that the methods described can be applied in minimally invasive surgery of the pancreas to assess its viability.
Export citation and abstract BibTeX RIS
1. Introduction
Acute destructive pancreatitis is one of the urgent problems in abdominal surgery, due to its high probability of complications and mortality. The average mortality rate of pancreatitis is 20%–45%. However, it can reach up to 85% in cases of infected pancreatic necrosis and 100% in its fulminant form [1]. Microcirculation disorders of the pancreas play an important role in the pathogenesis of acute pancreatitis and include a number of changes, such as vasoconstriction, ischemia–reperfusion, increased vascular permeability and impairment of nutritive tissue perfusion [2, 3]. One of the most important of these factors is injury to the pancreas caused by ischemia and reperfusion [4]. Ischemia is an initiating factor or an aggravating mechanism of pancreatic microcirculatory injury in acute pancreatitis. Reduced blood flow and alterations to microvascular integrity lead to tissue anoxia and are a major cause of the development and spread of necrosis zones in the pancreas.
Information about blood microcirculation and metabolic processes in organ tissues is important to distinguish normal tissue from inflammatory or necrotic processes during surgery. One of the main problems surgeons face in pancreatic pathology is the lack and low quality of diagnostic information. This problem is even more relevant to minimally invasive surgical operations. In recent decades, the minimally invasive approach has become more widespread for diagnostic and surgical treatment of patients with pathologies of abdominal organs, including the pancreas [5]. Compared to open surgery, minimally invasive surgery can decrease operational morbidity and mortality and also reduce the patient's recovery time and rehabilitation costs [6]. Informative rapid diagnostic methods will allow a surgeon to assess the patient's condition in a timely manner during surgical operations and choose the right tactics. In this regard, it is of interest to expand the capabilities of minimally invasive technologies to assess the state of pancreatic tissue, support early diagnosis, and treat various complications of acute pancreatitis.
At the present stage of development of the technologies used in medical diagnostics, optical methods for assessing the state of biological tissues have become widespread [7]. This approach includes various spectroscopic and imaging techniques for studying biological tissues in vivo in real time without the invasive acquisition of tissue samples. These methods allow the evaluation of metabolic processes, absorber content, blood perfusion, and oxygenation. Optical methods can increase the prevalence and effectiveness of minimally invasive abdominal interventions in clinical practice by providing additional diagnostic information for the surgeon in real time.
Fluorescence spectroscopy (FS) is one of the most widespread optical spectroscopic methods for in vivo diagnosis. This method is based on the excitation of fluorescence in endogenous and exogenous tissue fluorophores with UV or visible optical radiation to record fluorescence emission spectra. It is well known that the tricarboxylic acid cycle (also known as the Krebs cycle) provides electron carriers in the form of nicotinamide adenine dinucleotide (NADH) and flavin adenine dinucleotide (FADH2) that donate their electrons to complex I and II, respectively, enabling the respiratory chain to function. Thus, assessment of the NADH and FADH2 amounts in cells allows the estimation of cellular and tissue oxidative activity and may be used to assess metabolic activity and the functioning of complexes I and II [8]. During ischemic conditions, NADH produced by glycolysis accumulates in cytoplasm. Moreover, NADH and FADH2 inside mitochondria cannot be oxidized by complex I and complex II, respectively. Therefore, the amounts of NADH and FADH2 may be utilized as a marker for oxygen deprivation or hypoxia. The detection of such changes by fluorescence spectroscopy is one of the most promising directions of in vivo diagnostics. Note that the content of FADH2 can be estimated by the fluorescence of its oxidized form (FAD). Despite the fact that the study of NADH and FAD fluorescence has been successfully carried out over the past 50 years [9, 10], a relatively small number of studies have been performed at the level of organs. However, the results of experiments on a particular organ or area of the body can be more successfully extrapolated to clinical practice than studies at the cellular level [11].
Since metabolic activity, blood microcirculation, and oxygen saturation are closely interrelated, it makes sense to study these parameters together. A multimodal approach seems more promising for complex diagnostics of different aspects of pathological processes in tissues. Many optical methods have been developed to assess blood microcirculation, as well as to study biochemical reactions closely related to blood-supply disorders, such as diffuse-reflectance spectroscopy and imaging [12, 13], laser Doppler flowmetry and imaging [14, 15] and laser speckle-contrast imaging (LSCI) [16]. The LSCI method was originally introduced as a simple and efficient approach for full-field imaging of blood flow, allowing the retrieval of information about the structures involved in the formation of a blood flow signal. The temporal and spatial statistics of the speckle pattern can be used to obtain information on the motion of scattering particles [17–19]. Moreover, by analyzing information about changes in the diffuse reflectance spectra of tissues, one can extract information about their morphological and physiological state. The diffuse reflectance spectroscopy (DRS) technique has been developed to assess peripheral blood flow and the oxygenation saturation state [20]. This method is able to provide continuous non-invasive measurement of changes in the oxygenated (HbO2) and deoxygenated (Hb) haemoglobin concentrations. By recording a diffuse reflectance spectrum, it is possible to determine the oxygen saturation of the tissue, using the spectrum's shape (its slope, area under the curve) on the basis of mathematical simulations of the relation between the reflectance and the concentration of the chromophores mentioned above [12].
Therefore, the aim of the current work is to study the feasibility of the combined application of optical spectroscopic and imaging techniques for the multimodal diagnosis of pancreatic tissue states. In the present study, we aim to introduce the technique of ischemic monitoring by measuring redox-state-dependent NADH and FAD fluorescence, tissue oxygen saturation, and perfusion in a mouse pancreatitis model. Experiments were performed on occluded pancreatic tissue to determine the complex I- and complex II-coupled respiration. These measurements allowed us to compare the measurements of NADH and FADH2 utilization.
2. Materials and methods
2.1. Experimental setup
The experimental setup included three channels, to implement FS, DRS, and LSCI techniques (figure 1). The LSCI channel included a CMOS camera DCC3260M (Thorlabs, Inc. USA) with 1936 × 1216 pixels and a 5.86 µm pixel size combined with a 34 mm Mitutoyo plan apochromat objective MY5X-802 (Thorlabs, Inc. USA), which were used to record raw speckle images. The object under study was illuminated by a 10 mW laser source operating at a 635 nm wavelength (Edmund Optics Inc. USA). The image recording rate of the camera was 15 FPS, the exposure time of the camera was 9 ms for all measurements.
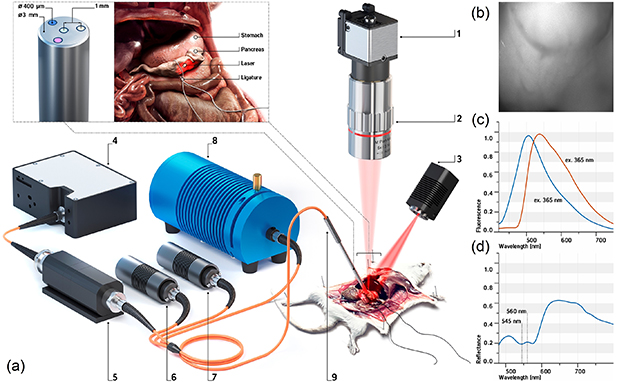
Figure 1. (a) A schematic illustration of the experimental setup and pancreas ligation procedure: (1) CMOS camera, (2) 5× objective, (3) 635 nm laser, (4) CCD spectrometer, (5) fiber-to-fiber adapter with filter holder, (6) 365 nm LED, (7) 450 nm laser, (8) halogen light source; (9) fiber optical probe; (b) raw speckle image; (c) normalized fluorescence spectra at 365 nm and 450 nm excitation, and (d) diffuse reflectance spectra of pancreatic tissue.
Download figure:
Standard image High-resolution imageIn this study, we also performed a series of experiments with a fiber-optic probe containing emitting and collecting fibers, which was used to measure fluorescence and diffuse reflectance intensity. The optical fibers (400 µm) were located around a central fiber, which delivered the collected light to the spectrometer. The numerical aperture of the fibers was 0.22.
The FS channel included 365 nm and 450 nm light sources. The choice of these wavelengths was due to the requirement to excite NADH and FAD fluorescence. The light collected from the tissue was filtered by an optical filter to attenuate backscattered radiation and then analyzed by a CCD spectrometer (Ocean Optics, USA) in the range of 400–900 nm. FGL400 and FGL495 filters (Thorlabs, Inc. USA) were used to attenuate backscattered radiation from the sources. These filters were only used in the FS channel and were then removed from the measurement in the DRS channel. For safety reasons, as well as to keep photobleaching of the tissue at an acceptable level, the probe radiation power of the 365 nm excitation wavelength at the output of the fiber probe did not exceed 1.5 mW. The output power at the 450 nm excitation wavelength did not exceed 3.5 mW.
The DRS channel included an HL-2000-FHSA tungsten–halogen light source (Ocean Optics, USA) with a wavelength range of 360–2400 nm. The optical power of the halogen lamp used did not exceed 5 mW. Thus, in the excitation regions of the main biological tissues' fluorophores, the lamp had very low power values, which were insufficient to observe significant fluorescence.
Before measurements, the experimental setup was calibrated. A calibration spectrum was measured on a flat Spectralon diffuse reflectance standard (Ocean Optics, USA) and a dark signal was recorded to correct diffuse reflectance and fluorescence spectra. System control and further data processing were performed using a personal computer with custom software developed in the Matlab program environment. The study protocol in the FS and DRS channels using a different configuration of optical fiber is described in detail in [21, 22].
2.2. Modeling pancreatic ischemia
The experimental study was performed on clinically healthy male Balb/c mice. The mice were obtained from the 'Andreevka' vivarium (Russian Federation). The basic rules of maintenance and care corresponded to the standards of the sanitary and epidemiological requirements for the device, equipment and maintenance of experimental biological clinics, as well as the "Guide for the Care and Use of Laboratory Animals" and GLP principles. The experiment was approved by the Ethics Committee of Orel State University (record of the meeting No. 10 of 16.10.2017). During the study, the mice were anesthetized with Zoletil 100 at standard dosages. The animals were placed on a special fixing platform in a supine position. A transverse laparotomy was performed on each animal and access was provided to the upper section of the posterior wall of the abdominal cavity in the retroperitoneal space. The pancreas was placed on a laboratory table while preserving the integrity of the blood vessels. The thickness of the mouse pancreas was less than 1 mm. A ligature made of polyester filament was then applied to the area of the pancreatic head, which provided compression of the main feeding vessels. The ligature overlay scheme is shown in figure 1. Additionally, a sterile gauze pad dipped in a 0.9% sodium chloride solution was placed in the surgical field.
The animal was then placed under the optical system to visualize the area under study and to record sequences of frames (see figure 1). Measurements were made in the area of the pancreatic body. The fiber probe was placed in the middle of the visualized area and both fluorescence and reflectance spectra were recorded three times at each measurement stage. The images and spectra were recorded before ligation and every 5 min after ligration for an hour. This protocol helped to minimize movement artifacts and photobleaching. At the end of the study, the animal was withdrawn from the experiment in accordance with experimental rules.
2.3. Data analysis
The images obtained by the LSCI method were processed with a custom-developed algorithm in an online mode [23]. The standard spatio-temporal algorithm was used to obtain speckle contrast images. The calculation of speckle contrast was performed using the following equation:
where  is the averaging symbol, n is the averaging window n × n( n = 7), k is the number of consecutive frames (k = 20),
  is the average intensity in the window n × n and σ is the standard deviation in the n × n
window.
is the average intensity in the window n × n and σ is the standard deviation in the n × n
window.
The fluorescence measurements were scaled to 1. The initial calibration was performed before recording diffusion reflectance spectra. The reflectance spectra were calculated by the equation:
where R(λ) is the measured diffuse reflectance of biological tissue; Rspectralon(λ) is the measured diffuse reflectance of spectralon; Rb (λ) is the background spectrum obtained with the light source turned off.
Normalization makes it possible to eliminate the effect of light source intensity and receiver sensitivity on the measurement of spectral characteristics of biological tissues.
The degree of blood oxygen saturation in tissue (tissue saturation) can be determined using reflection coefficients at the wavelengths corresponding to the isobestic and nonisobestic points of oxy- and deoxyhemoglobin by the following equation [24–26]:
where R(λ) is the measured diffuse reflection at the chosen wavelength; µHb and  are the absorption coefficients of deoxygenated and oxygenated blood, respectively [27]; λ1 and λ2 are the wavelengths of nonisobestic and isobestic points, respectively. The formula is based on a different formula given in the paper by Spott et al[ 28], which is based on a formula given in Ishimaru [29].
The registered oxygen saturation is the value averaged over the entire diagnosed volume and represents the saturation of mixed blood [30]. The oxygenation can be calculated using several combinations of nonisobestic and isobestic points, which makes it possible to obtain information from different tissue layers by selecting the respective wavelengths. In this study, 560 nm and 545 nm in the green region were chosen as the nonisobestic and isobestic point, respectively.
The relationship of the parameters was estimated using Pearson's correlation coefficient (95% confidence level).
3. Results and discussion
Consecutive registration of the spectral signals was performed. At each stage of recording, speckle contrast, fluorescence at two excitation wavelengths and diffuse reflectance spectra were recorded.
First, the setup shown in figure 1 was used to record the sequence of frames. At each stage, a sequence of 20 frames was recorded. After image processing with the spatio-temporal algorithm, spectral contrast images were obtained (see figure 2). LSCI was used for full-field visualization for the control of changes in blood flow in the ischemic pancreas.
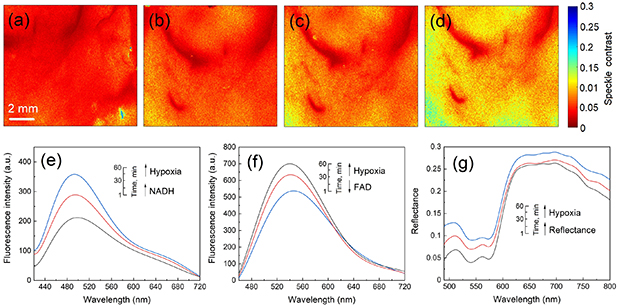
Figure 2. Spatio-temporal speckle contrast images of the pancreas before (a) and during (b)–(d) the ligating procedure. The scale bar equals 2 mm. For visual analysis of the dynamics of the flow of scattering particles, the values of the calculated spatio-temporal contrast in the images have been converted to pseudo colours, where a high velocity of the flow of scattering particles corresponds to red, and a low velocity, to blue. Examples of changes in the fluorescence spectra during the ligating procedure at 365 nm (e) and 450 nm (f) excitation, and diffuse reflectance spectra (g).
Download figure:
Standard image High-resolution imageFigure 2 shows a gradual increase of speckle contrast values after ligating the pancreas, which indicates a reduction of blood flow and development of the tissue ischemia required to study oxidative metabolism. The slow change of speckle contrast and its oscillations indicate that venous blood flow still occurred.
The results of the measurements and calculations made according to the FS and DRS methods are shown in figure 3. Figure 3(a) demonstrates the temporal dynamics of the signal (excitation wavelength of 365 nm) registered during ischemic modeling. The direction of the signal changes at an excitation wavelength of 365 nm was consistent with previous observations demonstrating increased fluorescence of NADH during ischemia [31–33]. The rate of NADH production (slope figure 3(a) is a direct reflection of the efficiency of the tricarboxylic acid cycle. Under conditions of hypoxia, with a lack of oxygen, which serves as the final electron acceptor in the respiratory chain of mitochondria, the oxidation rate of NADH is limited to the rate associated with complex I. The course of oxidative phosphorylation reactions becomes impossible, while the concentration of NADH increases.

Figure 3. Correlation between (a) NADH fluorescence and time of ligation, (b) FAD fluorescence and time of ligation, (c) NADH fluorescence and FAD fluorescence (confidence level is 95%). The maximal level of fluorescence was taken as 1.
Download figure:
Standard image High-resolution imageTo meet the need for ATP, the cell switches to anaerobic glycolysis, which results in NAD+ being reduced to NADH with the formation of pyruvate and ATP. The absence of NADH oxidation through the electron transport chain and an increase in the concentration of NADH as a result of glycolysis leads to an increase in the intensity of NADH fluorescence in the cell during hypoxia [9, 10]. The increase of NADH fluorescence intensity (figure 3(a)) is recorded simultaneously with the increase in average speckle contrast.
The changes in FAD fluorescence during ischemia were the opposite of those found for NADH (figure 3(b)). The contrasting changes observed in NADH and FAD fluorescence during ischemia after excitation at different wavelengths are also consistent with the observations made by others [32]. It is also possible that during ischemia, there is some decrease in the fluorescence signal associated with the effect of FAD photobleaching.
The results of this research also make it possible to analyze the work of mitochondrial complexes. Figure 3(c) shows the relationship of complex I and II in hypoxia. It is obvious that there is a more efficient operation of complex II and an insufficiency of complex I. In other words, the maximal velocity of FADH2 utilization was considerably smaller than the maximal velocity of NADH utilization, which is suggestive of a considerable complex II reserve capacity. There is a 40% increase in NADH intensity with a 25% decrease in FAD fluorescence. Thus, the changes in coenzyme fluorescent intensity are very sensitive at detecting early signs of tissue ischemia.
The relationship of fluorescence parameters with the level of tissue oxygenation was also analyzed. Cellular energy production in aerobic conditions depends on oxygen availability. During the artificially induced ischemic condition, blood flow is ceased, leading to a decrease in oxygen supply. The slope of the line in figure 4(a) characterizes the rate of oxidative reactions in a continuing ischemic condition.
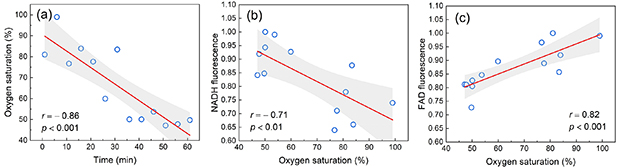
Figure 4. Correlation between (a) oxygen saturation and time of ligation, (b) NADH fluorescence and oxygen saturation, (b) FAD fluorescence and oxygen saturation (confidence level is 95%). The maximal level of fluorescence was taken as 1.
Download figure:
Standard image High-resolution imageAs can be seen from figure 4(a), during an hour of artificial ischemia there was a twofold decrease in oxygenation. Figures 4(b) and (c) characterize the sensitivity of the respiratory complexes to oxygen. These figures also confirm the observation of a more pronounced insufficiency of complex I.
The Pearson correlation coefficient was calculated to prove the interconnection of the data obtained. The results of this analysis are presented in figure 5.

Figure 5. Pearson correlation results for the main variables (Pearson correlation matrix).
Download figure:
Standard image High-resolution image
It is worth noting that when fluorescence was excited at 365 nm, a partial excitation of FAD fluorescence also occurred. This can be observed in the slope of the integral spectrum at 530–540 nm. At the same time, if we assume that FAD can affect the fluorescence spectra of NADH, then under hypoxic conditions this should be visible as a decrease in the signal. However, we see a significant increase in the signal. Along with this increase, the large deviations of the NADH values can be explained by the influence of FAD. Under hypoxic conditions, the remaining fluorophores (collagen, elastin, lipopigments, etc) do not undergo quantitative changes and thus do not change during dynamic measurements, and are an additive component.
4. Conclusions
The development and verification of novel diagnostic techniques and criteria for the visualization and analysis of inflamed and necrotic tissues in minimally invasive surgery is a rapidly growing field of research. We have demonstrated that the methods described, based on the analysis of the intensity of fluorescence, diffuse reflectance, and speckle contrast can be applied in minimally invasive surgery of the pancreas to assess its viability.
The metabolic status of cells and tissues is important for assessing their functional state. The application of a multimodal spectroscopic approach offers the advantage of monitoring the redox state of the pancreas. The combined measurements of fluorescence, diffuse reflectance intensity, and speckle contrast demonstrate the close dependence of tissue metabolism on blood and oxygen supply. We have shown that deactivation of complex I and complex II occurs in mouse pancreas tissue during a prolonged hypoxic condition. We concluded that complex I can potentially undergo more intensive deactivation when oxygen is lacking than complex II.
The experimental results of this study will be used to adjust the techniques of FS, DRS, and LSCI for application in standard minimally invasive surgical tools. In particular, it is planned to integrate these methods into a standard laparoscopic technique.
Acknowledgments
This study was supported by the European Union's Horizon 2020 research and innovation programme under the Marie Skłodowska-Curie grant agreement No. 839888 (data analysis). This study was also supported by the Russian Science Foundation under project No. 18-15-00201 (experimental study).