


Abstract
With the ever-increasing application range of nanoscale light–matter interactions, the study of individual nanostructures or particles becomes a crucial task. Over the last decade, it was proven that bespoke light fields tailored at the nanoscale can act as multi-purpose tools for the in-depth optical investigation at the single-particle level. Here we show that by tightly focusing cylindrical vector beams, a focal electromagnetic field landscape can be engineered, enabling the measurement of position-dependent resonance spectra. This method extends the existing nano-optics toolbox and can find a wide range of applications in spectroscopy.
Export citation and abstract BibTeX RIS

Original content from this work may be used under the terms of the Creative Commons Attribution 4.0 licence. Any further distribution of this work must maintain attribution to the author(s) and the title of the work, journal citation and DOI.
1. Introduction
Studies of light–matter interactions at the single-particle level provide extensive insight into structural properties of, e.g., molecules [1–3], nanostructures [4–7], and novel materials [8, 9]. With this knowledge, current needs in sensing, optical detection, or photovoltaics can be addressed. In most scenarios the usual tool—a Gaussian beam (GB)—is utilized, featuring a homogeneous field distribution. In contrast, strongly confined or focused laser beams yield complex fields with nanoscale features [10–14]. The focal field landscape is directly linked to the properties of the input beam and, therefore, can be easily tailored. In that context, higher-order laser modes are of particular interest. For example, the first-order Hermite–Gaussian modes were used to study individual nanoantennas and for excitation of dark modes [6, 15, 16]. Tightly focused higher-order Laguerre–Gaussian modes were proposed and used for enhancing the ripple structure of the scattered electromagnetic field [17, 18].
Another interesting group of laser modes are vector beams with polarization states changing about the optical axis. Under tight focusing, e.g. azimuthally and radially polarized vector beams resemble the field lines of magnetic and electric dipoles (ED), respectively. Just recently, such tightly focused cylindrical vector beams have proven to be capable of selectively addressing magnetic and electric resonances in individual nanosystems [19–22], of revealing the nanoscale morphology of organic semiconductors [23, 24], and for higher harmonic generation [25–28]. Furthermore, the 3D structure of focused beams turned out to be advantageous in determining the shape and orientation of sub-wavelength particles [4, 5, 7], and they opened up new avenues in Raman spectroscopy [29–33]. It is also important to note here that the excitation with an electron beam and the analysis of its energy loss is a very powerful technique as well, which has been used to study the resonances of individual nanoparticles [34, 35].
In this article, we propose and implement a versatile addition to the experimental toolbox of structured-light-based methods for the study of individual nanosystems. We show that the focal distributions of tightly focused light beams also enable polarization-dependent spectroscopic studies of individual nanoparticles, granting access to a variety of different properties of the system under study in a single-beam scenario. For instance, it allows for measuring resonance spectra for different excitation schemes by simply displacing the particle relative to the beam axis, without the need for changing the input field. Furthermore, the simultaneous recording of far-field emission patterns in momentum space also enables the identification of resonant modes. Although some of those techniques have been utilized already for the investigation of nano-systems, we now show with our proof-of-concept study how powerful the combination of these building-blocks can be.
2. High-NA focusing and experimental setup
The focal fields we utilize for this proof-of-concept demonstration result from tight focusing of cylindrical vector beams. They were chosen due to their symmetry properties. To illustrate the effect of high numerical aperture (NA) focusing, figure 1(a) shows the cross-section of the electromagnetic energy density in the focal plane for an azimuthally polarized beam at a wavelength of 700 nm and an NA of 0.9. These focal fields were calculated using vectorial diffraction theory [10, 12]. Apart from the transversely polarized electric and magnetic field components (x and y), which carry all the energy of the beam before focusing, the focal spot features a very strong longitudinal (z) magnetic field component. This z-component arises from the non-paraxial propagation of the light field. Consequently, due to the complex focal spot, a sub-wavelength particle will interact with a strongly position-dependent field. On the optical axis, for example, the particle will be excited by the z-component of the magnetic field only. On the other hand, if the particle is displaced away from the optical axis by ∼400 nm, it will dominantly overlap with linearly polarized transverse electric and magnetic fields, similar to the case of a GB or plane wave illumination. Importantly, the local in-plane polarization depends on the chosen direction of the displacement itself. Hence, different light–matter interaction schemes can be realized within a single beam.
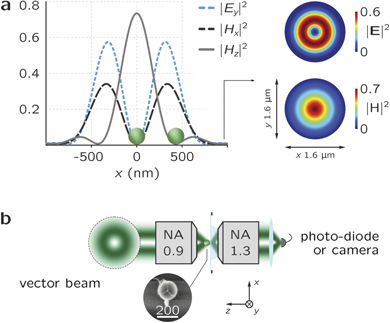
Figure 1. (a) Electromagnetic energy density of focused azimuthally polarized vector beam for a numerical aperture of NA = 0.9 and λ = 700 nm, normalized to the total energy density  . A sub-wavelength particle is excited by different fields at on-axis and off-axis positions in the focal plane. (b) Simplified schematic of the experimental setup and a micrograph of the Si particle. [19] John Wiley & Sons. © 2015 by WILEY-VCH Verlag GmbH & Co. KGaA, Weinheim.
Download figure:
Standard image High-resolution imageFor our study, we use a silicon nanosphere with an outer diameter of 185 nm. Such high refractive index scatterers have been shown to support magnetic and electric multipolar resonances in the visible spectral range [19, 36–41]. Recently, their lowest-order resonance—a magnetic dipole (MD) mode—has been of particular interest [40, 42].
For the experiment, the particle is placed on a glass substrate and illuminated by a laser beam focused by a microscope objective with a high NA of 0.9 (see figure 1(b)). As a light source we use a fiber-based broadband system spectrally filtered with an acousto-optical tunable filter. The resulting incoming beam is quasi-monochromatic (1 nm spectral bandwidth). The laser power behind the focusing microscope objective is on the order of tens of μW, depending also on the chosen wavelength. We use four different modes of the incoming laser beam: an x-polarized fundamental GB, an azimuthally polarized vector beam (AB), a radially polarized vector beam (RB), and a counter-rotating azimuthally polarized vector beam (CAB) [43]. Input beams sculpted in their polarization distributions are generated from an originally linearly polarized GB using a liquid-crystal-based theta cell (ArcOptix) [44] and a half-wave plate. The sample is mounted on a 3D piezo-stage that allows for precise positioning of the particle relative to the focal spot. The optical signal is collected in transmission by an immersion microscope objective of NA = 1.3. The total transmitted power can be recorded with a photo-diode, or the k-spectrum of the scattered light in the back-focal plane can be imaged on a camera and analyzed (for more details, see references [6, 19]).
3. Towards single-particle spectroscopy with structured light
To show that with the configuration and ingredients discussed above, real and k-space spectroscopy at the single-particle level is possible, the particle is raster scanned across the focal plane while recording the transmitted light. We choose a scan field of 2 μm × 2 μm, a step-size for the scan of 50 nm, and consequently perform 41 steps in both x and y directions. For each position, we record and average 500 data points with the photo-diode. In the next step, we change the wavelength and repeat the measurement. Running the experiment wavelength-by-wavelength allows for precise positioning of the particle with respect to the optical axis without being affected by chromatic aberrations of the focusing system.
For the sake of brevity, we show the transmission scan images for various incoming beams at a fixed wavelength tuned to the MD resonance λMD (figure 2). Here, the particle responds strongly to the oscillation of the local magnetic field. To facilitate the interpretation of the experimental data, each raster scan is shown together with the respective calculated focal maps of the electric (top left) and magnetic (bottom left) energy densities corresponding to the excitation beam. For completeness, the inset on the top right of each sub-figure also shows the experimental results of the raster scan measured in reflection. For all four cases and the chosen wavelength, we can see that the experimental scan images resemble the respective magnetic energy density distributions |H|2, which is in line with the statement above that the particle response is dominated by the MD. We attribute minor discrepancies to deviations of the experimental fields from the ideal calculated distributions and the particle asymmetries. However, we note here that the dependence of the scan images (and later also of the recorded spectra) on the particle shape is an important feature of our method. It can eventually allow for retrieving those shape deviations, but one needs to discriminate experimentally between the particle- and beam-induced asymmetries. For this purpose, the focal fields can be probed first using a nano-interferometric technique such as the one presented in reference [45]. With the exact knowledge about the excitation field, information about the particle itself can be deduced.
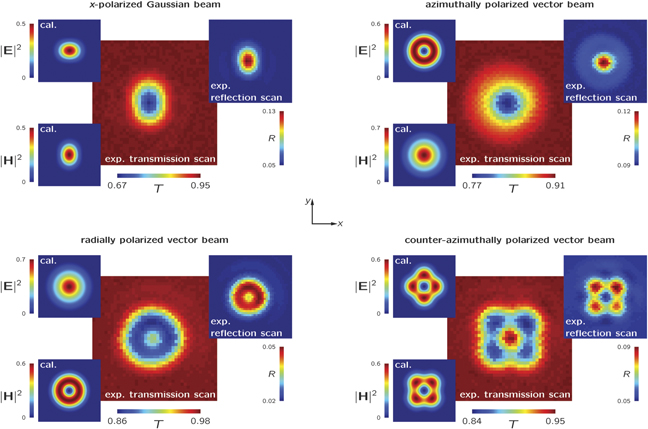
Figure 2. Theoretically calculated focal fields and experimental raster scans through the focal planes of tightly focused beams at the magnetic dipole resonance λMD (see figure 3) recorded in transmission. The insets on the left show the calculated distributions of the electric (top left) and magnetic (bottom left) energy densities (normalized to the total energy density and calculated using vectorial diffraction theory [10]). The insets on the top right depict the experimental raster scans in reflection. At λMD, the scan images resemble the focal maps of the magnetic field |H|2 only. Each map is 2 μm × 2 μm large.
Download figure:
Standard image High-resolution imageIn the next step, we probe experimentally the resonance spectrum of the particle in the visible spectral range. In the beginning, we place the particle on the optical axis of a focused GB. Since the on-axis focal field is transverse and consists equally of eclectic and magnetic field components, the recorded spectrum features fingerprints of all resonances expected for the investigated spectral range (pink line in figure 3(a)). We find the MD, ED, and magnetic quadrupole (MQ) resonances, respectively. In our previous work, we showed that by placing the same particle on-axis in the foci of tightly focused vector beams, either the magnetic or the electric or higher-order resonances can be addressed selectively [19]. As an example, we show the results of selective on-axis excitation for AB (pink line). In such a case, the focal on-axis field resembles the field lines of a magnetic-dipole mode [46]. Consequently, the spectra will exhibit fingerprints of magnetic-type resonances only. However, if we displace the particle off-axis by ∼400 nm, the local field is transverse, resembling a plane wave or GB excitation. Indeed, this is exactly what we find experimentally (see green line in figure 3(a)). The corresponding spectrum is the result of averaged measurements at eight different off-axis positions at a radial distance of ∼400 nm. It exhibits all the spectral features we observed before for the GB illumination.
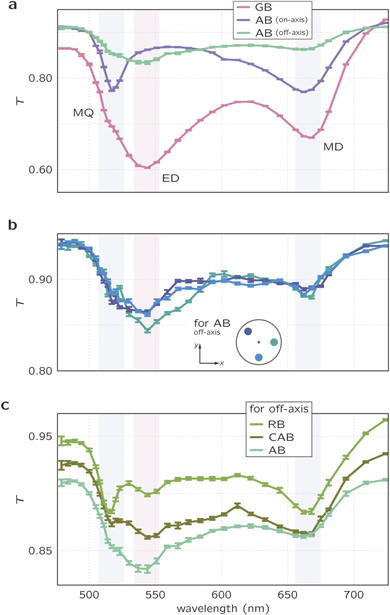
Figure 3. (a) Experimental resonance spectrum of the Si nanosphere recorded under different illuminations: linearly polarized Gaussian beam (GB) on-axis, azimuthally polarized beam (AB) on-axis, and off-axis. When the particle is placed in the center of tightly focused AB, only magnetic modes can be excited (pink line). (b) Exemplary spectra of the particle recorded at different azimuthal positions of tightly focused AB (at a radial distance of ∼400 nm). (c) Resonance spectra showing the complete spectrum of three resonances under off-axis illumination with AB, RB, and CAB.
Download figure:
Standard image High-resolution imageTherefore, different types of spectra can be recorded within a single beam scenario without the necessity of switching to another illumination scheme. The fact that the resonances for both excitation schemes (GB on-axis and AB off-axis) appear with significantly different strengths is a direct consequence of the spatial overlap of the field with the sub-wavelength particle. Each curve is also normalized to the transmission of the respective beam through the air-glass interface. These normalization levels are different as well because of the polarization depend Fresnel coefficients.
The method discussed here has also an additional advantage. Since the focal field of a tightly focused azimuthally polarized beam is cylindrically symmetric, the off-axis measurement can be equivalently carried out at any azimuthal coordinate and also analyzed separately. Figure 3(b) depicts exemplary spectra for three different azimuthal positions. As mentioned above, the differences of the spectra for various azimuthal positions can provide information about the particle symmetry if the focal field itself has been pre-characterized and is known precisely [45].
The off-axis excitation scenario presented for an azimuthally polarized vector beam can be applied in the same way for all other vector beams. Figure 3(c) shows the resonance spectra of the particle excited at an off-axis position for RB and CAB excitation. The strength of the off-axis electromagnetic fields varies between the beams (see top insets in figure 2) and, therefore, the three spectra are offset with respect to each other. As a side-note, we also come back shortly to the scan image for radially polarized light shown in figure 2. Although the raster scan resembles the shape of the focal magnetic energy density, it features a significant on-axis response at the wavelength of the MD resonance. This interesting detail is caused by the fact that the ED resonance can still be excited off-resonantly—here by the on-axis longitudinal electric field—because the ED resonance is rather broad spectrally [36].
The proof-of-concept experimental spectra presented in this section were recorded using a photo-diode. In the following, we would like to discuss an extension of the proposed idea of spectroscopy with structured light by analyzing the light scattered off the nanosphere in the far-field.
4. k-space spectroscopy
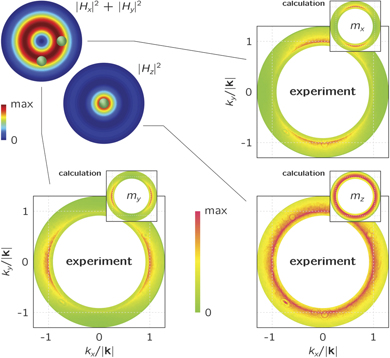
The versatile capability of different illumination schemes at the nanoscale using vector beams stems from the 3D focal landscapes created upon tight focusing. The MD resonance, for instance, can be excited with a tightly focused AB, placing the particle on-axis or off-axis. However, the orientation of the MD moment differs for these positions. In figure 4, we show the distribution of the transverse (|Hx |2 + |Hy |2) and longitudinal (|Hz |2) components of the focal magnetic energy density (compare also with figure 1(a)). If the particle is placed in the center of the focal spot, it is excited by a longitudinal magnetic field. This means that the scattered light will have the properties of the light emitted by a z-oriented MD moment. Experimentally, this can be observed via replacing the photo-diode with a camera and imaging the back focal plane of the microscope objective. For the on-axis position, the intensity distribution of the scattered light in k-space is cylindrically symmetric (see figure 4, bottom right)—a clear signature of a dipole oscillating along the optical axis for the given situation. A displacement of the particle to an off-axis location, where it dominantly overlaps with the transverse magnetic field, will accordingly excite a transverse magnetic mode. The in-plane orientation of the dipole moment depends on the local magnetic field direction, that is, the azimuthal coordinate. Note that the magnetic field of an azimuthally polarized vector beam is radially polarized. When the particle is displaced along the x-axis, we identify the emission of an x-polarized MD. Analogically, a displacement of the particle along the y-axis results in the same emission pattern rotated by 90°. The insets in figure 4 depict theoretically calculated radiation in k-space for transverse and longitudinal MDs placed close to a plane dielectric interface [47].
Figure 4. For the Si nanoparticle placed at different positions in the focal plane of a tightly focused azimuthally polarized beam at λMD (energy densities of the transverse (|Hx |2 + |Hy |2) and longitudinal (|Hz |2) components are shown), different emission patterns of the MD are observed in the back focal plane of the collection lens (k-space). The insets show theoretically calculated emission patterns of transversely and longitudinally oriented point-like magnetic dipole moments.
Download figure:
Standard image High-resolution image
A dipole oscillating along a certain direction emits light in a given manner, and its axis can be identified [1]. Therefore, the proposed technique of spectroscopy with structured illumination can be further extended to k-space. Back focal plane imaging realized for different wavelengths can provide a deeper knowledge about the system under study.
5. Conclusions
In conclusion, we have presented an advanced spectroscopy method for the optical study of individual nanoscopic particles or systems. Enabled by electromagnetic fields tailored at very small length scales, multiple spectra can be recorded and various interaction schemes can be realized within a single beam scenario. Spectra recorded for different positions of the sample with respect to the focal fields may help to reveal its geometrical and optical parameters. We envision that this method can also help to improve recently proposed nanometrology schemes [42].
Acknowledgments
The authors acknowledge fruitful discussions with Gerd Leuchs.
Data availability statement
The data that support the findings of this study are available upon reasonable request from the authors.