


Abstract
Thermoelectric material SnSe has aroused world-wide interests in the past years, and its inherent strong lattice anharmonicity is regarded as a crucial factor for its outstanding thermoelectric performance. However, the understanding of lattice anharmonicity in SnSe system remains inadequate, especially regarding how phonon dynamics are affected by this behavior. In this work, we present a comprehensive study of lattice dynamics on Na0.003Sn0.997Se0.9S0.1 by means of neutron total scattering, inelastic neutron scattering, Raman spectroscopy as well as frozen-phonon calculations. Lattice anharmonicity is evidenced by pair distribution function, inelastic neutron scattering and Raman measurements. By separating the effects of thermal expansion and multi-phonon scattering, we found that the latter is very significant in high-energy optical phonon modes. The strong temperature-dependence of these phonon modes indicate the anharmonicity in this system. Moreover, our data reveals that the linewidths of high-energy optical phonons become broadened with mild doping of sulfur. Our studies suggest that the thermoelectric performance of SnSe could be further enhanced by reducing the contributions of high-energy optical phonon modes to the lattice thermal conductivity via phonon engineering.
Export citation and abstract BibTeX RIS

Original content from this work may be used under the terms of the Creative Commons Attribution 4.0 licence. Any further distribution of this work must maintain attribution to the author(s) and the title of the work, journal citation and DOI.
1. Introduction
Owing to its capability of converting waste heats into electricity, thermoelectric materials provide a sustainable approach for energy crisis and environmental protection [1, 2]. The great potential of thermoelectric generators has motivated the enthusiastic search for candidate materials with a high figure of merit, zT = S2 σT/(κe + κl), which is a measure of the efficiency of turning heat into electricity. Here, S, σ, and κe are the Seebeck coefficient, electrical conductivity, and electronic thermal conductivity, respectively, κl is the lattice thermal conductivity, which is related to the lattice dynamics. According to the formula, reducing the lattice thermal conductivity via phonon engineering is an effective way to realize the high thermoelectric performance [3, 4]. SnSe possesses intrinsically a low lattice thermal conductivity, and its surprisingly high zT has drawn accumulating interests in recent years [5–7]. Theoretical calculations suggest that the intrinsic low thermal conductivity arises from the giant lattice anharmonicity induced by the instability of the resonant bonding and Sn lone pair [8, 9]. Inelastic neutron scattering (INS) measurements have shown that the zone center low-lying optical phonons become softened and broadened as temperature increases [8, 10]. This behavior is an indicator of lattice anharmonicity. However, we still need more information to quantitatively evaluate the importance of the intrinsic lattice anharmonicity to phonon softening, which may shed light on our approach to the optimization of thermoelectric performance via phonon engineering. Moreover, very recently, Peng et al reported that the lattice thermal conductivity was largely reduced by introducing mild sodium and sulfur dopant into SnSe [11]. Later on, Zhao et al also reported that the lattice thermal conductivity of SnSe could be evidently reduced via sulfur doping [12]. Therefore, it is essential to investigate the lattice dynamics in the doped samples.
At a specific pressure, the evolution of the measured phonon frequencies as a function of temperature can be expressed as [13–17]:

This equation could be further written as:

where γj is the isotherm mode Grüneisen coefficient, describing the variation of phonon frequency of a given optical mode caused by the change of the volume [18], and α is the volume thermal expansion coefficient. The first term on the right side represents the shift induced by anharmonic multi-phonon scattering. The second term corresponds to the shift of phonon frequencies caused by the quasiharmonic lattice thermal expansion. Since the overall thermal expansion coefficient of SnSe system is positive, the contribution of the second term to the phonon softening depends on the sign of the Gruneisen parameter. Generally, Gruneisen parameter varies distinctly for different phonon modes [18, 19]. Therefore, to understand the phonon dynamics in SnSe, it is crucial to reveal how the intrinsic lattice anharmonicity and the thermal expansion affect the softening of individual phonon modes, respectively.
In the present work, we performed systematic measurements to investigate the lattice dynamics on Na0.003Sn0.997Se0.9S0.1. Lattice anharmonicity is evidenced by pair distribution function (PDF), inelastic neutron scattering and Raman measurements. In combination of the INS, Raman scattering, we analyzed the phonon softening and broadening of the optical modes, and found that there are highly active multi-phonon scattering processes, which is closely related to lattice anharmonicity. Frozen phonon calculations also reveal the strong anharmonicity effect. Our studies indicate that the high-energy modes also actively take part in the lattice thermal conductivity. This suggests that the performance of SnSe could be further enhanced by altering the properties of high-energy phonon modes via phonon engineering approach.
2. Methods
2.1. Experiments
High-quality doped and parent SnSe single crystals were synthesized by modified Bridgeman method, as described in previous studies [11, 12]. High-resolution time-of-flight neutron powder diffraction experiments were carried out at BL-09 SPICA of J-PARC. Single crystals of Na0.003Sn0.997Se0.9S0.1 with the weight of 2.5 g was grounded into powders and sealed into a V-Ni sample cell with the temperatures varied from 15 K to 410 K. Rietveld refinements of the neutron powder diffraction (NPD) data were conducted with the Z-Rietveld software [20]. Time-of-flight neutron total scattering measurements were carried out at the BL-21 NOVA of J-PARC. Single crystals of both Na0.003Sn0.997Se0.9S0.1 and Na0.02Sn0.98Se were ground into powders with the mass of 2.8 and 3.2 g, respectively. The samples were sealed into the V-Ni cell with a metallic O-ring, and the temperature varied from 50 to 600 K. Neutron PDF, G(r), was obtained by Fourier-transforming the structure function, S(Q) with the maximum Q value of 40 Å−1. Such a large Q value corresponds to the d spacing of 0.16 Å, which is enough to acquire a high-resolution PDF. The PDF patterns were refined using the program PDFGUI [21]. High-resolution neutron scattering experiments were performed at the cold neutron time-of-flight chopper spectrometer BL-14 AMATERAS of J-PARC [22]. The single crystal of Na0.003Sn0.997Se0.9S0.1 with a total amount of 4.8 g was mounted onto the aluminum plate. The measurements were conducted in the high temperature stick for 100, 300, 450 and 600 K, using the incident beam energies of 7.74 and 15.16 meV. The consistency of the data at T = 300 K for the heating and cooling processes suggests that the sample degradation did not occur during the measurement. The data were reduced and visualized by using Utsusemi suite [23]. Raman scattering experiments were carried out under various temperatures using the LabRam Horiba HR800 UV spectrometer. The laser excitation with the wavelength of 532 nm was used for the measurement in the range of 20 to 200 cm−1. The instrumental resolution was set to be better than 1 cm−1.
2.2. Theoretical calculations
The combination of ab initio simulation package (VASP) [24] and PHONOPY [25] was employed to calculate the frozen-phonon potentials. Starting from the experimental results, the fully-relaxed crystal structure was obtained by using the density functional theory as implemented in VASP with the plane-wave energy cutoff set to be 500 eV. The core electrons were described by the projector augmented-wave pseudopotentials [26], and the exchange function was chosen to be the local density approximation [27]. A 6 × 12 × 12 Monkhorst-Pack k-point mesh was adopted for unit-cell calculations. The crystal structure was relaxed until the Hellmann–Feynman force on each atom was smaller than 0.001 eV Å−1. The relaxed lattice parameters, a = 11.304 Å, b = 4.121 Å and c = 4.296 Å, are well consistent with previous report [28]. Then a 2 × 4 × 4 supercell and the Γ-only K point were used for phonon-spectrum calculation, during which the force constants were generated based on finite-displacement method. Finally, the frozen-phonon potentials at Γ are obtained.
3. Results
3.1. Temperature dependence of phonon dispersion
In our studies, we performed systematic measurements on single crystals of Na0.003Sn0.997Se0.9S0.1. SnSe and Na0.02Sn0.98Se were also studied to verify our findings in Na0.003Sn0.997Se0.9S0.1. The crystal structure of Na0.003Sn0.997Se0.9S0.1 with Pnma space group is depicted in figure 1(a). It is analogous to that of black phosphorus [29], possessing a puckered layered structure with Sn (Na)–Se (S) bi-layers stacking along the a-axis. The nearest Sn (Na)–Se (S) covalent bonds form zigzag and armchair atomic chains along the b and c axes, respectively, leading to anisotropic electronic structures and transport properties [5]. Inelastic neutron scattering is the most effective probe to visualize the phonon dynamics in 3D crystalline solids. Figure 1(b) shows phonon dispersions along the Γ-X, Γ-Y and Γ-Z directions at T = 100 K taken from Na0.003Sn0.997Se0.9S0.1. Two low-lying optical modes, labelled as TO1 and TO2, can be easily identified around the zone center Γ. In the Γ-X direction, the band crossing occurs between the two low-lying optical modes and acoustic phonon modes at the zone boundary. Compared to the phonon dispersions at T = 100 K, one can notice evident softening of both optical and acoustic phonons at T = 600 K (see figure 1(c)). Figure 1(d) displays the temperature-dependent of the energies of TO1 and TO2 at Q = (0, 1, 1). It is clearly shown that TO1 and TO2 exhibit a softening of 0.85 meV and 0.60 meV from 100 K to 600 K, respectively.

Figure 1. (a) Crystallographic structure of Na0.003Sn0.997Se0.9S0.1. Sn (Na)–Se (S) covalent bonds form the zigzag and armchair shaped atomic chains along the b and c axes, respectively. Sn(Na) and Se (S) atoms are denoted as gray and green spheres, respectively. (b) Phonon dispersions measured at T = 100 K by using the incident neutron energy of 7.74 meV. The data were taken along [H, 1, 1], [0, K, 1] and [0, 1, L] directions, which correspond to Γ-X, Γ-Y and Γ-Z, respectively. (c) Same as panel (b), but taken at T = 600 K. The intensities were integrated over ±0.05 r. l. u.. The lower and upper transverse optical modes are labelled as TO1 and TO2, respectively. (d) and (e) Temperature-dependent peak positions and linewidths of TO1 and TO2 at Q= (0, 1, 1), respectively. The error bar of peak position of TO1 is 0.008, 0.012, 0.011, and 0.014 meV at T = 100, 300, 450 and 600 K respectively, and the error bar of the peak position of TO2 is 0.039, 0.031, 0.032, and 0.041 meV at T = 100, 300, 450 and 600 K respectively. That is, the error bars are smaller than the symbols.
Download figure:
Standard image High-resolution imageGenerally speaking, the increase of the phonon linewidth (or the scattering rate) is due to phonon–phonon scattering or electron–phonon coupling [30]. In the case of SnSe, first-principles calculations suggest that the scattering rate contributed by the phonon–phonon scattering is much more dominant [31], and the strength of electron–phonon coupling is considerably smaller than those evident electron–phonon coupling systems [32], for instance, cuprates [33] and manganites [34]. Moreover, previous angle-resolved photoemission spectroscopy measurements have not observed characteristic features of electron–phonon coupling, such as 'polaron satellite' or significant enhancement of the carrier effective mass [10, 35–39]. Therefore, we argue that the phonon–phonon scattering takes the dominant responsibility for the temperature dependence of the phonon linewidths. As shown in figure 1(e), the phonon linewidths of TO1 and TO2 increase by 0.28 meV and 0.15 meV from 100 K to 600 K, respectively. Interestingly, as will be shown later, a stronger linewidth broadening occurs in high-energy phonon modes, indicating that the phonon–phonon anharmonic scattering is crucial for the behavior of these modes.
3.2. Lattice parameters and pair distribution function
Sn/Na form bonds with seven neighboring Se/S atoms, which are labelled as d1, d2, d3, d4, d5, d6 and d7 (see figure 2(a)). Such a configuration gives rise to a highly distorted polyhedron structure surrounding Sn/Na site. To investigate how the atomic bonding length evolves as a function of temperature, we performed NPD measurements on Na0.003Sn0.997Se0.9S0.1 using two neutron diffraction instruments [see figure S3 (https://stacks.iop.org/NJP/22/083083/mmedia)], and the refinement results are illustrated in figure 2(b). We found that these Sn/Na–Se/S bonds show different temperature dependences. With temperature increasing, the variation of the nearest Sn/Na–Se/S bond d1 is very weak, d2, d4, d6 and d7 increase mildly at high temperatures, d3 monotonically shrinks, and d5 displays a non-monotonic trend and becomes shorter at high temperatures. The detailed neutron diffraction patterns and the temperature dependence of lattice parameters are presented in figures S3 and S4, respectively.

Figure 2. (a) The schematic of SnSe7 polyhedron with seven neighboring Sn/Na–Se/S bonds, which are labelled as d1–d7. (b) Temperature dependence of seven neighboring Sn/Na–Se/S bond lengths of Na0.003Sn0.997Se0.9S0.1. The empty and solid circles represent the data taken from NOVA and SPICA in J-PARC, respectively. Owing to the high resolution of the neutron diffractometer, the error bars are smaller than the symbols in the plot. (c) Temperature-dependent isotropic atomic displacement parameters of Sn and Se with the fitting of Debye model (solid lines). (d) Experimental pair distribution function (solid blue circles) over a range from 2 to 20 Å measured at T = 50, 300 and 600 K, respectively. The red lines are the fittings with Pnma space group. (e) The first PDF peak at various temperatures.
Download figure:
Standard image High-resolution imageFigure 2(c) illustrates the temperature dependence of the isotropic atomic displacement parameters (ADPs) for Sn/Na and Se/S. In the Debye model, we use the following formula to fit the temperature-dependent ADPs [40, 41]:

where ℏ, kB, θD, m and A are the reduced Planck constant, Boltzmann's constant, Debye temperature, average atomic mass and temperature-independent static disorder, respectively. The fitting result of A is ∼0 for both Sn/Na and Se/S, suggesting that we can ignore the static disorder in our samples. The Debye temperatures were determined to be 146(6) K and 204(9) K for Sn/Na and Se/S, respectively, being in excellent agreement with the values of 140 K for Sn and 195 K for Se in pristine SnSe [41].
In sharp contrast to the routine powder diffraction that provides average crystallography information, PDF analysis is a powerful technique to investigate local structures in crystals, where the peaks observed in the PDF spectra correspond to specific inter atomic distances [42]. Figure 2(d) shows the temperature dependence of the PDF of Na0.003Sn0.997Se0.9S0.1 over a wide range from 2 to 20 Å, in which the Pnma space group was adopted for the fitting. The good agreement between the model and the experimental data suggests that the doping of Na and S does not change the local structures of SnSe. As displayed in figure 2(b), at low temperatures, the bond length d1 is very close to d2, and correspondingly the first PDF peak at T = 50 K contains the contributions from both of the nearest and next nearest Sn/Na–Se/S pairs. Though d4 is larger than d3, the second PDF peak arise from the third and fourth nearest Sn/Na–Se/S pairs. And the PDF peaks centered ∼3.9 and 4.1 Å correspond to the nearest Se/S–Se/S pair and d5, respectively. As for d6 and d7, they contribute to the PDF peak centered around 4.9 Å. Compared to the low-temperature PDF spectrum, the peaks broadened and asymmetric with the decline of peak intensity at high temperature. Such behavior has also been observed in Na0.02Sn0.98Se (see figure S5).
At low temperatures, the potential energy curve can be described as a parabola near the bottom of the well, which gives rise to the symmetric Gaussian profile of the PDF spectrum at low temperatures. With further increasing the temperatures, the potential energy curve follows the anharmonic model with a steeper slope on the left side with respect to the equilibrium position, which gives rise to the asymmetric profile of the line shape at high temperatures. In thermoelectric materials [43–46] and perovskite halides [47, 48] with strong anharmonicity, their PDF peaks exhibit non-Gaussian profiles at high temperatures. Furthermore, Li et al proposed that the asymmetry of the PDF peak could be regarded as a reference to evaluate the lattice anharmonicity [46]. Here, as shown in figure 2(e), the profile of the first PDF peak follows the Gaussian function at T = 50 K, while it becomes asymmetry at T = 300 K, though d1 and d2 remain almost the same in this temperature range. However, as shown in figure 2(d), we could notice that the neighboring peak with multi-components exhibits drastic changes in both peak intensity and shape as the temperature increases. Therefore, it is difficult to exclude the influence of the neighboring peak on the first PDF peak. As will be shown later, the evidence of anharmonicity could be found in following sections.
3.3. Phonon anharmonicity
Considering that one-unit cell of SnSe comprises eight atoms, there are three acoustic (B1u + B2u + B3u) and 21 optical phonon vibration modes (4Ag + 2Au + 2B1g + 3B1u + 4B2g + B2u + 2B3g+ 3B3u) as predicted by group theory. Among them, 12 optical modes (4Ag + 2B1g + 4B2g + 2B3g) are Raman active. Figure 3 illustrates the Raman spectra of Na0.003Sn0.997Se0.9S0.1 taken at various temperatures from 80 to 450 K. The Raman modes Ag 1 (TO1 in figure 1), Ag 2, B3g, Ag 3 and Ag 4 can be clearly identified at T = 300 K, with the peak positions at 32.72, 71.33, 111.06, 132.78 and 150.06 cm−1, respectively, being in excellent agreement with previously reports [38]. The missing of the TO2 mode in Raman spectra could be due to the weak intensity of the TO2 mode in our experimental configuration. With the increase of temperature, we observed a pronounced phonon softening. The low-lying optical phonon modes derived from INS are plotted as well in figures 3(b) and (c), which are in good consistent with Raman measurements.
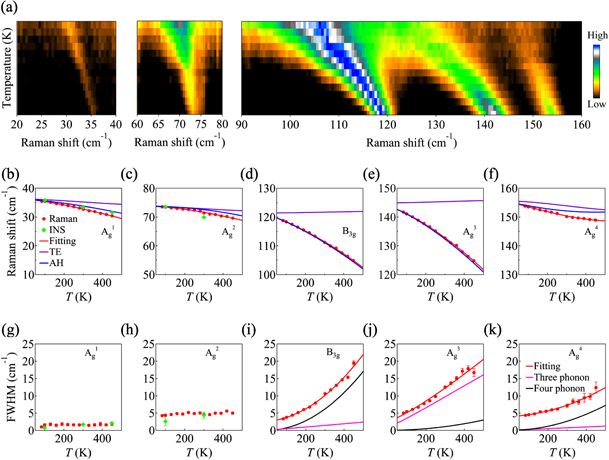
Figure 3. (a) Temperature-dependent Raman modes of Na0.003Sn0.997Se0.9S0.1. (b)–(f) The fittings of the temperature dependent behavior of Raman shifts. The red line denotes the fitting with the combination of phonon–phonon scattering and thermal expansion models. The purple and blue lines show the effect of thermal expansion and phonon–phonon scattering, respectively. The green diamonds are from our INS measurements, which are in good consistent with Raman measurements. (g)–(k) The fittings of linewidth of Raman modes as a function of temperatures. The pink and black lines represent the contributions from the three-and four-phonon scattering, respectively.
Download figure:
Standard image High-resolution imageTo understand the physical origin of the temperature dependence of the Raman shift, we adopted the model ω(T) = ω0 + ΔωE (T) + ΔωA (T) to fit the Raman data [16--18], where ω0 is the harmonic frequency at T = 0 K, ΔωE (T) corresponds to the shift of phonon frequencies caused by the quasiharmonic lattice thermal expansion, ΔωA (T) represent the shift induced by anharmonic multi-phonon scattering. Here, the shift induced by the lattice thermal-expansion could be expressed as [16, 18]:

The isotherm mode Grüneisen parameters of Ag 2, B3g, Ag 3 and Ag 4 are 1.22, −0.24, −0.31 and 1.11, respectively [19]. Since the isotherm mode Grüneisen parameter of Ag 1 is not reported in literatures, the calculated value of 2.83 was adopted [5]. For the anharmonic phonon–phonon scattering, both the three and four-phonon scattering processes were taken into consideration [49],

where  and
and  . The coefficients A and B represent the individual contributions of three and four-phonon anharmonic scattering, respectively. Figures 3(b)–(f) show the fittings of the optical phonon modes in Raman spectra. Obviously, both the thermal-expansion effect and the intrinsic anharmonic scattering contribute to the phonon softening of Ag
1, Ag
2 and Ag
4 modes. However, as shown in figures 3(d) and (e), the thermal-expansion effect is relatively weak and the anharmonicity effect plays the key role for the considerable softening of the B3g and Ag
3 modes.
. The coefficients A and B represent the individual contributions of three and four-phonon anharmonic scattering, respectively. Figures 3(b)–(f) show the fittings of the optical phonon modes in Raman spectra. Obviously, both the thermal-expansion effect and the intrinsic anharmonic scattering contribute to the phonon softening of Ag
1, Ag
2 and Ag
4 modes. However, as shown in figures 3(d) and (e), the thermal-expansion effect is relatively weak and the anharmonicity effect plays the key role for the considerable softening of the B3g and Ag
3 modes.
Moreover, the linewidth is also helpful for the evaluation of the temperature-dependent behavior. In figures 3(g) and (h), the linewidths of the Ag 1 and Ag 2 modes show only slight changes with temperature in both Raman and INS experiments. Such behavior has also been observed in parent SnSe and Na0.02Sn0.98Se in our studies (see figure 5), which suggests the weak anharmonicity effect on these modes. In figure 3(i)–(k), the temperature dependence of the linewidths of B3g, Ag 3 and Ag 4 modes are modeled with the following formula [49]:

where Γ(0) is the linewidth at T = 0 K. The detailed fitting parameters are summarized in table S1. In previous studies, three-phonon scattering was considered as the dominate phonon–phonon scattering process in SnSe system [50]. Based on our results, we found that the four-phonon process (black lines in figures 3(i) and (k)) is stronger than the three-phonon one (cyan lines in figures 3(i) and (k)) in B3g and Ag 4 modes, indicating that the four-phonon scattering process is also crucial in determining the intrinsic low lattice thermal conductivity of SnSe.
In order to acquire more information on the anharmonicity effect of the phonon modes in SnSe, we performed first-principles calculations to obtain the frozen-phonon potentials for Raman modes, and the results are illustrated in figure 4. Though the potentials of the Ag 1 and Ag 2 modes can be well fitted with high order polynomials, their deviation from the quadratic potential is not significant. We thus expect a weak anharmoncity effect in Ag 1 and Ag 2, which is in line with our experimental results shown in figure 3. In contrast, B3g, Ag 3 and Ag 4 modes largely deviate from the quadratic potential and higher order potentials have to be included to achieve a good fitting, suggesting they possess strong anharmonicity. In particular, the quartic potential is crucial to account for the phonon potentials of B3g and Ag 4 modes.
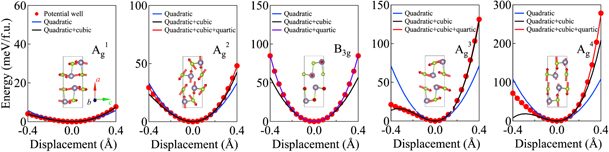
Figure 4. Frozen phonon potential of the observed Raman modes as a function of the displacement with various types of polynomial fittings. The inset shows the vibrations of the atoms of the corresponding phonon modes. We note here that the blue line (quadratic fitting) and the black line (quadratic plus cubic fitting) in B3g are overlapped, suggesting a negligible effect of the cubic term on the potential.
Download figure:
Standard image High-resolution image3.4. Doping effects by Raman scattering
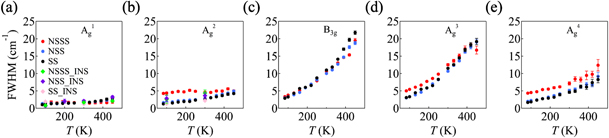
To obtain a better understanding of how the doping affects the lattice thermal conductivity, it is crucial to reveal the difference of linewidths of optical modes between pristine and doped SnSe. As shown in figure 5, compared to the pristine SnSe, the linewidths of Na-doped specimen remain basically the same, which suggests that Na dopant has very weak effect on the lattice thermal conductivity [6]. However, in contrast to pristine and Na-doped SnSe, our data in figures 5(b), (d) and (e) show that the linewidths of Ag 2, Ag 3 and Ag 4 in Na0.003Sn0.997Se0.9S0.1 are evidently larger at low temperatures. With further increasing the temperature, the differences of the linewidths of Ag 2 and Ag 3 between pristine SnSe and Na0.003Sn0.997Se0.9S0.1 become smaller. Such behavior is in line with the thermal transport measurement [12]. Our data indicates that mild sulfur doping could affect some particular modes of optical phonons and contribute to the reduction of the lattice thermal conductivity at low temperatures. In addition, though those high-energy optical phonon modes of pristine and Na doped SnSe show similar temperature dependence to those of Na0.003Sn0.997Se0.9S0.1, we found that the four-phonon process becomes the dominate phonon–phonon scattering process in Ag 3 at high temperatures (see figures S8 and S9), which further indicates that the four-phonon scattering process is important in the thermal conduction of SnSe system.
Figure 5. The temperature-dependence of full width at half maximum of parent and doped SnSe at the zone center. NSSS, NSS and SS denote Na0.003Sn0.997Se0.9S0.1, Na0.02Sn0.98Se and SnSe, respectively. The solid circles and diamonds represent the Raman and inelastic neutron scattering, respectively. Here, the INS data of pristine SnSe are from reference [8].
Download figure:
Standard image High-resolution image
4. Discussion
As shown in figure 2(e), with the temperature going up, the first PDF peak evolve from a symmetric Gaussian-like profile to a broadened asymmetric line shape, which is in line with previous theoretical calculations that the lattice anharmonicity of SnSe originates from the lattice instability of the Sn polyhedron, especially the d2 and d3 bonds [8]. However, the complexity here is that it is comprised of two sets of Sn–Se pairs, and the drastic change of the neighboring peak could also induce the asymmetry of the first PDF peak. Therefore, we emphasize that more evidence is provided in our studies by INS, Raman and frozen-phonon calculations, though our PDF data appears to be a sign of the rise of lattice anharmonicity in this material.
Our INS and Raman data reveal the noticeable softening and broadening of the optical phonons. As shown in figure 3, by fitting the Raman shifts as a function of temperature, we can identify various contributions to the phonon softening. The softening of Ag 1, Ag 2 and Ag 4 could be attributed to both lattice anharmonicity and lattice thermal expansion effect. However, for optical modes B3g and Ag 3, which also exhibit more pronounced temperature-dependence, the strong lattice anharmonicity is the predominant factor that leads to the phonon softening. In addition, the investigation of Raman linewidth of these phonon modes offers a deep insight into the lattice anharmonicity. As shown in figure 3(g)–(k), in contrast to the weak temperature-dependent behavior of Ag 1 and Ag 2 modes, the high-energy optical modes of B3g, Ag 3 and Ag 4 modes becomes much broader with increasing temperature. Such observations are also consistent with our frozen-phonon calculations. All these phenomena are related to strong anharmonicity.
Generally speaking, the dominant contribution to the lattice thermal conductivity is from acoustic phonon modes, owing to their typically high group velocities and long lifetimes. On the contrary, optical phonons often have negligible contributions. Therefore, the focus is usually on scattering the acoustic phonons in order to suppress the lattice thermal conductivity by means of nanostructuring and alloying. In SnSe, theoretical studies have proposed that the optical modes play a crucial role in the lattice thermal conductivity [51, 52]. According to theoretical investigations by Guo et al, the optical modes contribute more than 60% to the lattice thermal conductivity along b axis [51]. Besides, according to the calculated results by Romero et al, those optical phonons with ω > 100 cm−1 contribute ∼18% along a and b axes, and ∼35% along c axis [52]. The softening of the high-energy optical phonons and the broadening of the linewidths are a manifestation of strong anharmonicity of the optical phonons, which also indicates that they have evident effects on the reduction of the thermal transport. By comparing phonon modes in different compounds, one can also notice that mild sulfur dopants further suppress the lattice thermal conductivity, which could improve the thermoelectric performance in SnSe.
5. Conclusion
In summary, we have observed the anharmonicity effect in SnSe system through a combination of PDF, INS, Raman scattering and frozen-phonon calculations. We found that the strength of phonon anharmonicity varies for different phonon branches. The higher-energy modes B3g and Ag 3 exhibit strong temperature dependence of Raman shifts and phonon linewidths, suggesting the strong anharmonicity of the system. More interestingly, the lattice thermal conductivity could be reduced through mild sulfur dopant doping to increase the linewidths of the high-energy optical phonons. Our results offer a deep understanding of the lattice anharmonicity in SnSe system, and point out that reducing the contribution of high-energy optical modes to lattice thermal conductivity is helpful for optimizing the high thermoelectric performance in SnSe.
Acknowledgements
We acknowledge the financial support from the National Key R&D Program of China under Grant No. 2017YFA0402901, National Natural Science Foundation of China under Grants No. 51472036 and 11674296, the Key Research Program of the Chinese Academy of Sciences (Grant NO. XDPB01), the Innovative Program of Development Foundation of Hefei Center for Physical Science and Technology (2018CXFX002), CAS Interdisciplinary Innovation Team and TIA-Kakehashi under Grant No. TK17-52. P Wu is supported by the China Scholarship Council. We are grateful for the award of the beam time from J-PARC through the proposals: No. 2017B0278, 2017A0218 and 2017A0251. We appreciate the technical assistance from K Namba and M Shioya.