


Abstract
Ghost imaging obtains an image of an amplitude/phase object by spatial correlation between two separated light beams. In ghost imaging, two detectors are used in a counter-intuitive way. One is a multi-pixel detector that does not view the object in reference arm, and the other one is a single-pixel detector that does view the object but only record the total light power in object arm. Neither detector could recovery the object independently, but spatial correlation from two detectors allows the reconstruction of a ghost image of the object. Here for the first time we present ghost network analyzer for obtaining frequency properties of a target. Interestingly, this novel technique proves insensitive to the distortion introduced by nonlinear devices, while conventional frequency-domain measurement modalities such as network analyzer can hardly work properly with distortion. The proposed technique provides a breakthrough method for distortion-free dynamic frequency response analysis.
Export citation and abstract BibTeX RIS

Original content from this work may be used under the terms of the Creative Commons Attribution 3.0 licence. Any further distribution of this work must maintain attribution to the author(s) and the title of the work, journal citation and DOI.
1. Introduction
Conventional ghost imaging is used to capture the spatial proprieties of objects [1–6]. Recently, ghost imaging is extend to time domain for recording the temporal signal at picosecond level with a slow integrating detector without enough temporal resolution [7, 8]. In addition, the ghost imaging in light wavelength domain, known as ghost spectroscopy, is introduced for reconstructing absorption spectrum [9]. However, ghost imaging in frequency domain or time-frequency domain has not yet been demonstrated, which is of great importance in many fields and may open a new research area for dynamic frequency response analysis.
Various types of sources have been employed in both quantum and classical ghost imaging so far. In quantum ghost imaging, the quantum source provides entangled-photon pairs with strong spatial correlations via parametric down-conversion (PDC) [10–14] or correlated atom pairs via Bose–Einstein condensates [15]. In classical ghost imaging, the beams with classical correlations are generated by the thermal/pseudothermal light sources [16–22]. For ghost imaging, all these sources including the PDC source, laser, projector [23], tungsten lamp, near infrared light source [9, 24], long wave infrared source [25], terahertz source [26], x-rays source [27–29] and even sun [30], could produce radiation over a large range of the electromagnetic spectrum. Here, radio frequency (RF) is applied for ghost imaging in frequency domain, which is of high potential in applications of communication, high-frequency circuit and radar.
In this paper, we propose and experimentally demonstrate the frequency-domain ghost imaging, i.e. ghost network analyzer (GNA), using an RF noise source as the frequency-domain correlated signal source, for recovering frequency characteristics of a target. Furthermore, we also present GNA in time sequence, as called time-frequency ghost network analyzer (TGNA), to study the temporal characteristics of the time-varying frequency response. As a global algorithm, compressed sensing is impossibly applicable for traditional frequency analysis technology, such as network analyzer, which employs the point-by-point scanning. However, compressed sensing could be applied in GNA, which analyzes the measurement data globally, and further enhances the analysis efficiency. GNA is also demonstrated in our experiment to be robust and insensitive to the distortion.
2. Ghost network analyzer
The schematic of GNA is illustrated in figure 1. An RF source, generating temporal stochastic noise, is employed as a frequency-domain noise source, because the spectrum of temporal noise signals are still fundamentally stochastic noises. The noise signal is then equally divided into the reference and object arms by an RF power splitter. The waveforms of temporal noise in the reference arm are recorded by Channel 1 (CH1) of a 10-bit oscilloscope at a bandwidth of 500 MHz. The power spectral density (PSD) of the temporal noise signal is achieved with fast Fourier transform (FFT). In the object arm, an electronically tunable band-pass filter is used as a device under test (DUT), i.e. the frequency-domain object. The temporal electrical signal, which is transmitted through this filter, is measured by Channel 2 (CH2) of the oscilloscope with the same bandwidth as CH1. We only extract the average power from the captured data of CH2 numerically via software, implying that the CH2 here behaves as an RF power meter. Therefore, the CH1, which has high-frequency resolution, does not receive the signal transmitted through the DUT, while CH2 does receive the signal transmitted through the DUT but only acts as an RF power meter, i.e., a frequency-domain single-pixel detector with no frequency resolution. It is apparent that neither of these two channels could recover the frequency response of DUT independently. However, we experimentally demonstrate that the frequency response of DUT can be reconstructed by correlations between measurements of these two arms over a number of waveforms from the stochastic noise source. Similar to the spatial and temporal ghost imaging, the design of GNA also seems quite counter-intuitive.

Figure 1. The experimental set-up of GNA. PS: power splitter, DUT: device under test, RF: radio frequency, PSD: power spectral density, CH1: Channel 1, CH2: Channel 2.
Download figure:
Standard image High-resolution imageBecause this novel technique recovers the frequency response of DUT using ghost imaging in frequency domain, we call it as ghost network analyzer. Although the ghost imaging has been already applied successfully in spatial and temporal domain, our experiment is the first demonstration of the ghost imaging in frequency domain to recover frequency characteristics of a target.
To efficiently reconstruct the frequency response of DUT, we use compressed sensing method [31–38]. The ghost imaging using compressed sensing provides a higher signal-noise ratio with far less measurements than conventional ghost imaging [39]. Furthermore, compressive sensing enables the sub-Nyquist reconstruction of n data points from much less than n measurements. The compression ratio, i.e. the ratio of measurement records to data points of reconstructed frequency response, is 0.8 in the experiment. A detailed mathematical description of frequency recovery method used here is given in the appendix.
The frequency resolution fr of GNA is defined as the spacing of reconstruction data points along frequency. According to the appendix, fr is equal to the spectral spacing of the sampling of noise waveforms, i.e. FFT frequency resolution, which is expressed as

where fsampling denotes the sampling rate of oscilloscope and N = 2n is the number of sampling points of every noise waveform.
A tunable band-pass filter, as the DUT here, is electronically controlled by a voltage Uf. Its center frequency moves from ∼160 to ~360 MHz as Uf changes from 0.7 to 4.2 V. In experiment, n = 8192, 4096 and 2048, corresponding frequency resolution fr = 610 KHz, 1.22 MHz and 2.44 MHz according to equation (1). As shown in figures 2(a)–(d), GNA obtains experimentally the frequency response of the DUT under different frequency resolutions, with Uf = 1 V, 2 V, 3 V and 4 V, respectively, in comparisons of the results directly obtained by network analyzer.

Figure 2. Measurement comparison between network analyzer and GNA. (a)–(d) Uf = 1 V, 2 V, 3 V and 4 V, respectively. NA: network analyzer (red dashed lines), GNA resolution fr = 610 KHz (cyan lines), 1.22 MHz (green lines) and 2.44 MHz (blue lines).
Download figure:
Standard image High-resolution imageIt is apparent that GNA may exactly retrieve the frequency response of the DUT under different frequency resolutions with DUT center frequencies of ∼165, ∼205, ∼277 and ∼348 MHz. The capture time for GNA is as short as ∼0.1 s, when n = 2048. This implies that GNA is able to study the temporal property of DUT's frequency response by continuously recovering. We therefore call this as TGNA.
3. Time-frequency ghost network analyzer
As a demonstration of TGNA, we measure the time-varying frequency response of the DUT. When Uf is set to a triangle wave with period of 20 s and voltage of 0.7 to 4.2 V, the center frequency and bandwidth of passband of the DUT change accordingly and periodically over time. As shown in figures 3(b) and (c), TGNA measured every second the frequency responses, which are compared with the results by the network analyzer. As Uf changes over time, TGNA and network analyzer present a consistent trend of the passband change in time-frequency domain. The typical reconstruction time of compressed sensing algorithm using MATLAB is measured to be ∼0.1 s when n = 2048, with single-threaded CPU computation by a laptop. The reconstruction speed could be further improved by performing parallel processing or employing GPU-based high performance computing. In addition, the special hardware of high-speed data processing, such as FPGA, could also be applied for the real-time recovery of frequency response in GNA.

Figure 3. Measurement comparison between TGNA and network analyzer. (a) The waveform of control signal Uf for the electronically tunable band-pass filter. (b) The results from TGNA in time-frequency domain. (c) The measurements from network analyzer. NA: network analyzer.
Download figure:
Standard image High-resolution image4. Ghost network analyzer in the presence of distortion
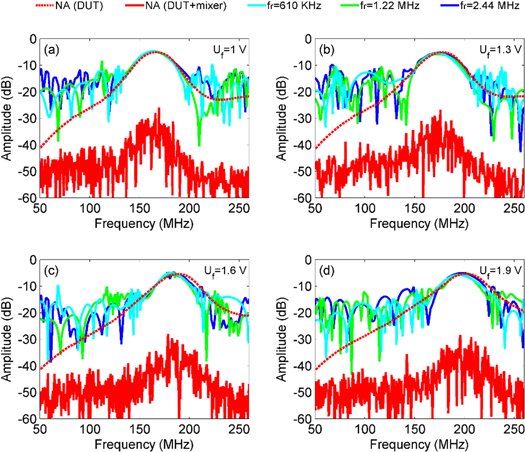
As a unique advantage, spatial or temporal ghost imaging is completely immune from distortion caused by turbid/scattering/nonlinear media [7, 40]. Here, this interesting feature is confirmed again for GNA. To introduce distortion in frequency domain, a mixer with bandwidth of 200 MHz is used to mix the signal of DUT with a noise, which is generated with function waveform generator. The mixer is actually a nonlinear device, since it produces new frequencies from DUT output and noise signal. When Uf = 1 V, 1.3 V, 1.6 V and 1.9 V, the frequency responses with mixer and without mixer are experimentally measured by network analyzer compared with the GNA, as shown in figures 4(a)–(d), respectively. Just like the conventional non-correlated imaging such as camera which is unable to capture clear image of an object with distortion in spatial domain, the network analyzer can hardly measure a DUT correctly with distortion in frequency domain. Furthermore, the DUT signal is randomly shifted by the noise frequency and thus spreads along a broad frequency band, leading to a small distribution at a certain frequency. That is why the readout of the network analyzer for the measurements of the frequency responses with mixer is noise-like and as so small as −50 dB. Interestingly, GNA can remarkably remove the distortion introduced by mixer and perfectly retrieve the frequency responses of the DUT as if there is no mixer. In principle, other nonlinear devices such as frequency divider/multiplier, FM/PM modulator/demodulator, RF envelope detector and frequency hopping device could also be regarded as 'transparent media' for GNA. Therefore, GNA may be a new powerful technique for the applications in communications, radar, electronic investigation and even electronic counter-countermeasures.
Figure 4. Measurement comparison between GNA and network analyzer when distortion is introduced by a mixer placed behind DUT. (a)–(d) Uf = 1 V, 1.3 V, 1.6 V and 1.9 V, respectively. NA: network analyzer with distortion (red lines)/without distortion (red dashed lines), GNA resolution fr = 610 KHz (cyan lines), 1.22 MHz (green lines) and 2.44 MHz (blue lines).
Download figure:
Standard image High-resolution image
5. Discussion and conclusions
As a kind of classical ghost imaging, GNA only requires a classical frequency-domain correlated signal source, i.e. a noise source [1, 2, 17, 22], just like the source in our proof-of-concept experiment. In principle, all the noises including thermal noise, shot noise and even cosmic microwave background radiation, which exist widely and inherently in electronic systems, are basically noise sources and can be utilized as a frequency-domain correlated signal source other than the specialized RF noise source for GNA. Therefore, GNA enables remote detection in a passive and covert way without local signal source. This unique characteristic is of high value for military radar.
Basically, GNA enables a low-cost way to measure frequency response of an electric device using an oscilloscope which is widely available in laboratory, rather than the network analyzer. For simplicity, we only measure the transmission frequency response of DUT here, but GNA could also be applied for measurement of reflection frequency response.
In conclusion, we propose and demonstrate the frequency-domain ghost imaging, i.e. ghost network analyzer, using radio frequency signal for frequency response measurement. As far as we know, this is the first ghost imaging extended to frequency domain. Moreover, the time-resolved frequency-domain ghost imaging, known as TGNA, is also implemented to measure a time-varying DUT in frequency domain. As an inherent advantage of ghost imaging, GNA is shown to be also perfectly immune from frequency-domain distortion. This means that many nonlinear electronic devices, such as mixer, RF envelope detector, FM/PM modulator/demodulator and frequency hopping device, are distortion for traditional frequency-domain measuring methods but dramatically transparent in GNA. Our study will lead the development of next-generation frequency-domain technology, which could overcome the fundamental bottlenecks in cost, anti-interference and stealth for conventional approaches and have potential applications in communications, radar, electronic investigation and even electronic counter-countermeasures.
Acknowledgments
This work is supported by the Beijing Natural Science Foundation (Grant No. 4194089); National Natural Science Foundation of China (Grant Nos. 61905015, 61975091, and 61975017); Open Research Fund Program of the State Key Laboratory of Low-Dimensional Quantum Physics (Grant No. KF201908); Beijing Institute of Technology Research Fund Program for Young Scholars.
: Appendix
The reconstruction algorithm of ghost network analyzer seeks for the solution which minimizes the L1-norm in the sparse basis [39]:

where T(f) is the frequency response of DUT, Ψ the transform operation to the sparse basis, fi the ith discrete frequency point in Fourier spectrum with FFT and PSDr(f ) the PSD of the temporal noise signal obtained by CH1. Ar is the average power of signal captured by CH2 in the rth measurement, which could be achieved by

where  is the PSD of the temporal noise signal obtained by CH2.
As a classic reconstruction algorithm for compressed sensing, orthogonal matching pursuit is applied for reconstruction here [41, 42].