
Abstract
REBa2Cu3O7−x (REBCO, RE = rare earth) compounds with different single RE elements were grown via TFA-MOD (metal-organic deposition of trifluoroacetates) to clarify their Tc values when grown by the same preparation method and their processing windows; here: the crystallisation temperatures at a constant process gas composition (pO2, pH2O). We focussed on the lanthanides (Ln) Nd, Sm, Gd, Dy, Ho, Er and Yb as substituents for Y in the REBCO phase and investigated their growth behaviour in terms of resulting physical (inductive Tc and Jc(77 K)) and structural properties (determined by XRD, SEM, TEM). All phases were grown as pristine films on LaAlO3 and SrTiO3 and compared to their respective nanocomposites with 12 mol% BaHfO3 for in-field pinning enhancement.
With regard to Tc and Jc(77 K), the optima of both values shift towards higher growth temperatures for increasing and decreasing RE ion size with respect to yttrium. Highest Tc values achieved so far do not show a trend that can solely be related to the RE ionic size. On the contrary, Tc,90 values of the LnBCO compounds from Sm to Er range between 94.0 and 95.3 K and are, therefore, significantly larger than the highest values of the average-size non-lanthanide, Y, with Tc,90 = 91.5 K. Jc,sf values at 77 K seem to plateau between 5 and 6 MA cm−2 from Sm to Er and are again clearly above the maximum values we ever achieved for Y with 4.2 MA cm−2. REBCO phase formations of the very small Yb and large Nd turned out to be more difficult and require further adjustment of growth parameters. All REBCO phases investigated here show distinct dependences of Tc on the lattice parameter c.
Export citation and abstract BibTeX RIS

Original content from this work may be used under the terms of the Creative Commons Attribution 4.0 license. Any further distribution of this work must maintain attribution to the author(s) and the title of the work, journal citation and DOI.
1. Introduction
In order to assess the suitability of a REBa2Cu3O7−x (REBCO or RE123, RE = rare earth) compound other than the well-established YBCO for coated conductor (CC) production, three main aspects have to be considered: price, process handling and performance. Moreover, all three have to be optimised simultaneously in order to raise the performance-cost ratio and make the material attractive for the market. Thus, CC production has to be cheap, simple and reproducible, and the product has to perform to the best of its possibilities and best at all operating conditions aimed for (i.e. temperature and magnetic field environment). But is there any room for improvement beyond YBCO, when years of YBCO research have passed [1–11]?
YBCO is indeed one of the cheapest precursor media that can be purchased on the market. YBCO targets for pulsed laser deposition (PLD), for example, cost roughly half of a GdBCO target. The same applies for the prices of salts used for metal-organic deposition (MOD), figure 1(a). Here, yttrium is also one of the cheapest amongst all RE acetates. However, those prices probably reflect demand rather than possible production cost. If the demand of another REBCO precursor was scaled to the demand of YBCO, prices might level, since world market prices for RE raw materials, figure 1(b), are only partially reflected in the prices of the precursor salts. Despite the rather cheap raw material for Eu, for example, the acetate is rather costly, while the overly expensive oxides of Tb and Dy have a rather low impact on the according costs of the acetates. Anyway, the pro rata cost for the rare earth element within the superconducting layer of a CC may rather be neglected when the entire production process is considered and prices for metallic substrates, buffer materials and processing costs are added to the sum.

Figure 1. Prices of the rare earth compounds: (a) prices per 10 g RE acetate (99.9% purity grade) in Euro [12]; (b) world market prices per kg RE2O3 (for different available grades of purity as given in the graph above the data points) in US Dollar [13]; insets: magnifications to the low-cost region.
Download figure:
Standard image High-resolution imageSeveral thin film deposition methods have qualified for REBCO CC production, such as physical vapour deposition techniques including PLD [14–16] and reactive co-evaporation [3, 16], as well as chemical methods including metal-organic chemical vapour deposition (MOCVD) [17] and chemical solution deposition (CSD) [6, 18]. All methods have their advantages and disadvantages, which have been examined carefully in several studies. Yet, when only the price is considered, techniques depending on high-vacuum equipment have clear disadvantages for large-scale production. Particularly cheap is the deposition from chemical solutions. CSD equipment consists of not more than a reel-to-reel-operated furnace with a deposition device, e.g. dip, spray, print or slot-dye coating. The entire CC architecture, including cap and buffer layers, can be processed 'all-chemically' [19]. However, with respect to the performance-cost ratio, mixed approaches may be the means of choice. Particularly, the deposition of the REBCO layer via CSD has clear advantages over other techniques, though: The preparation of the precursor solutions is utterly simple and therefore cheap, and the composition can be easily altered through solution mixing or additions of further soluble salts. With this, a plethora of inclusions for pinning enhancement is accessible: atomic-scale doping [20] on the RE [21–23], the Ba [24–26], and the Cu [27–29] site or secondary phase additions of various compositions (e.g. Y2O3 [30], BaZrO3 [31, 32], BaHfO3 [33–35], BaSnO3 [36], Ba2YTaO6 [37], Ba2YNbO6 [38]), forms (spherical, plate-like, rectangular, etc) and amount. Thereby, precipitates grown by CSD are known to lead to the largest reductions of the Jc anisotropy of REBCO with sometimes near-isotropic Jc in a certain field and temperature range, see e.g. [39–41].
Yet, most of the attention has been focussed on YBCO thin films and much less is known about the other lanthanide-REBCO compounds (LnBCO). In particular, comparative studies from a single source are rare and focus often on the comparison of crystal structures [42] or Tc values [43] or both [44, 45] and less on the performance, i.e. critical current (densities), Ic (resp. Jc), at interesting points in the temperature-magnetic field matrix. Certainly, very detailed investigations of individual LnBCO compounds have been reported, e.g. [46–48] and above all on GdBCO [49–51], but comparing such data with each other in order to define trends is problematic, especially when different deposition techniques are involved. The problem of comparability becomes most obvious when the growth of self-assembling nanostructures of the BMO3 type (M transition metal) within the REBCO matrix is examined. While PLD mostly leads to the formation of biaxially oriented nanoparticles and -rods, CSD tends to create randomly oriented particles of spherical shape. Those differences are caused by the different growth modes of the two techniques, which also lead to very distinct shapes of the grain boundaries (GB). The growth mode of PLD leads to columnar grains with straight GB perpendicular to the substrate interface; ex-situ deposition techniques, such as CSD, promote laminar grain growth resulting in rather meandering shapes [52].
Therefore, we optimised a number of different single-RE123 compounds and the according nanocomposites with BaHfO3 (BHO) via a CSD approach: the well-established TFA-MOD (metal organic deposition of trifluoroacetates). Our objective was to determine trends for the phase formation windows and structural and physical properties and thus to evaluate their suitability for CSD-grown CCs. For production, low furnace temperatures are of interest for economic reasons and wide processing windows for improved reproducibility of the properties and therefore increased robustness of the process. For a comprehensive comparison, a wide range of REBCO phases has been chosen from the largest RE element still known to form a stable superconducting RE123 phase, Nd, over Sm, Dy, Ho and Er, to the very small RE ion Yb. Those phases were compared to YBCO and GdBCO, for which we had obtained similar data in previous studies [35, 53]. Not part of the study were several Ln elements, whose corresponding RE123 phases are either metastable (La) or unstable (Ce, Tb), not superconducting (Pr) or would be radioactive (Pm). Also not included were Eu and Tm, mostly for timely reasons, as well as Lu due to expected difficulties for single-phase growth. We chose BHO as nanoscale flux pinning centres due to our expertise and good experience with this secondary phase with respect to pinning enhancement and reduction of the macroscopic anisotropy [35, 49]. For the current study, the windows of the growth temperatures at a constant gas composition with an oxygen partial pressure pO2 of 150 ppm have been accessed via inductively determined values of Tc and Jc. The record values of each system are compared to each other and brought into relation to structural characteristics, e.g. the c-axis parameter.
2. Experimental section
All REBCO systems studied here, pristine and with additional BHO nanoparticles, required separate precursor solutions, which were prepared after the same recipe based on the well-established TFA-MOD approach [2, 53–55]: The acetates of RE, Ba, and Cu (>99.99%, Alfa Aesar) were dissolved in water in a 1:2:3 ratio, mixed with an excess of trifluoroacetic acid (TFAH, 99.5+%, Alfa Aesar) to enforce a high degree of conversion of the salts into the trifluoroacetates, and stirred until the last remains of metal-organic salt were dissolved. The solutions were concentrated by means of a rotary evaporator to yield a viscid residue, which was re-diluted in ultra-dry methanol (>99.9%, H2O < 50 ppm, Carl Roth) and filled up to the final concentration of the rare earth of 0.25 mol l−1. In the case of the nanocomposite solutions, additional hafnium(IV)-2,4-pentanedionate (Hf(acac)4, 97+%, Alfa Aesar) and a similar molar amount of barium acetate were dissolved in water to enable a theoretical formation of 12 mol% BHO within the REBCO films. After adjusting the concentration, very small amounts of acetylacetone relating to roughly 60 mol% with respect to the RE element (or 1.5 vol%) were added to the solutions in order to make them insensitive to impurities such as water [53]. The additive leads to a momentary precipitation of copper acetylacetonate, which dissolves readily and permanently after a few minutes in an ultrasonic bath. Hereafter, the solutions were filtered through PTFE with 0.2 µm pore size.
These solutions were spin-coated on cleaned 10 × 10 mm2 (100)-oriented LaAlO3 (LAO) or SrTiO3 (STO) single crystal substrates with a rotation speed of 6000 rpm for 30 s, which leads to a final film thickness of (220 ± 20) nm. Subsequently, the films were heat-treated as described in [53], whereby the oxygen partial pressure pO2 during the crystallization was kept at 150 ppm and the oxygen for the final oxygenation process was introduced after the oxygenation temperature of 450 °C had been reached. The cooling step between crystallization and oxygenation was carried out in dry nitrogen with the same pO2 and gas flux as used during the film growth.
The superconducting characteristics of the films were analysed by inductive techniques: the self-field critical current density Jc,sf at 77 K with a calibrated Cryoscan (Theva, 50 µV criterion), the transition temperature Tc by a self-designed and calibrated mutual inductance device. Here we show Tc,10, Tc,50 and Tc,90 which are defined as the temperatures at which the net induced voltage reaches 10, 50 and 90% of the value in the normal state. The layer thicknesses were determined by atomic force microscopy (AFM; Dimension Edge, Bruker) on 50 µm wide bridge structures. Those bridges were prepared by photolithography with an image reversal resist (AZ5214E, Microchemicals) and wet-chemical etching with an 0.6 wt% HNO3 dilution. Structural features of the films were investigated by x-ray diffraction (XRD; D8 Discover, Bruker, Cu-Kα radiation) and scanning electron microscopy (SEM) with a low-resolution 'table-top' device (SH-5000P, Hirox, tungsten cathode, SE-detector, 10 kV acceleration voltage). The high-angle annular dark-field scanning transmission electron microscopy (HAADF STEM) images were taken at an FEI Titan probe Cs-corrected transmission electron microscope (TEM) operated at 200/300 kV [56, 57].
3. Results and discussion
Most of the newly investigated REBCO phases with RE = Dy, Ho and Er show exactly the same behaviour on the two single-crystal substrates LAO and STO, which are commonly used for basic investigations, as did YBCO and GdBCO described in a previous study of ours [35]: The pristine phases show significantly better properties on LAO, while the nanocomposites with BHO prefer STO as substrate. This had been related to a loss of the chemical inertness of STO at higher temperatures (particularly above 760 °C), resulting in both Tc reduction through Ti permeation and growth of misoriented grains because of a deterioration of the structural integrity of the substrate interface. This problem occurs mainly in pristine films and can be avoided by LAO, which seems to be stable up to higher temperatures in the same growth conditions (pO2). The nanocomposites, on the other hand, tend to form spherical BHO particles within the REBCO matrix but also flat and wide-stretched structures at the interface covering a large percentage of the substrate. We assume that those particles limit the Ti diffusion into the REBCO matrix and preserve the lattice information of the substrate due to a small lattice misfit to STO (<7%). On LAO, this misfit is significantly larger (>10%) leading to randomly oriented BHO particles at the interface with a disturbing impact on the film growth for nanocomposites on LAO. Therefore, we focus mostly on the data for pristine films grown on LAO and BHO nanocomposites on STO.
The images of DyBCO, HoBCO and ErBCO in figure 2 exemplify the typical macroscopic appearances of optimally grown films: All films are completely dense and homogeneous apart from a few surface decorations on pristine DyBCO and the nanocomposite of ErBCO. Especially smooth are the surfaces of the pristine phases with only a flat terrace architecture while the nanocomposites show some superficial trenches.
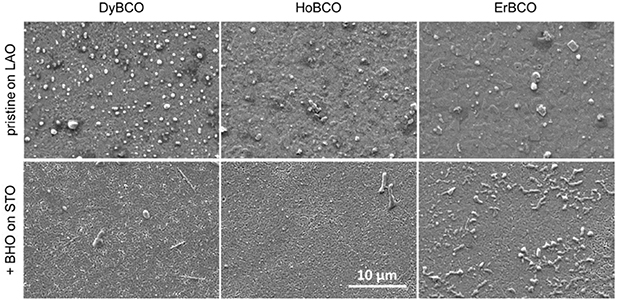
Figure 2. Structural film characteristics: plan-view images collected by a low-resolution SEM. Upper line shows pristine films, bottom line BHO-nanocomposites of DyBCO, HoBCO and ErBCO (from left to right).
Download figure:
Standard image High-resolution imageCross-sectional HAADF STEM images of YBCO, DyBCO, HoBCO and ErBCO pristine films and BHO-nanocomposites confirm that all films are very dense throughout the entire layer, see figure 3. They also show quite similar microstructural landscapes in general. All films, except the HoBCO nanocomposite, contain RE2O3 nanoparticles in the volume. In YBCO and DyBCO, those particles either occur in the middle part of the films or are attached to the substrate. Er2O3 on the other hand has only been found with association to the substrate. The presence of BHO does not play a role for RE2O3 particle size and distribution. Furthermore, BHO particle size and distribution are rather similar in all three studied cases. Aside from secondary phases, the bottom and top parts of the films contain a high density of elongated intergrowths that may be interpreted as additional Cu-O-planes or as insertions of REBa2Cu4O8 (RE124). Those parts vary in thickness throughout the samples and are partly very thin, especially the bottom parts near the substrate. The middle parts are generally more sparsely interrupted by this type of stacking fault (SF). While such a graduation has been observed in all investigated systems, parts of the central films of pristine YBCO and DyBCO were even found nearly without SFs at all and in particular if no large secondary phase particles were present, as is shown on the example of pristine YBCO (top left picture in figure 3). ErBCO and DyBCO samples appear in some parts to have almost pure RE124 phases in the top part of the films, although this has not been detected by XRD (not shown) and is thus not really a pure phase but SFs of high density. In the BHO nanocomposites on STO, the amount of intergrowths seems to be lower, at least with respect to their dimension. The occurrence of stacking faults in direct vicinity to the substrate interphase can be interpreted as a means of stress relief in the films, while the large number close to the film surfaces is believed to be a result of Cu accumulation during the film growth.

Figure 3. Microstructural features: HAADF STEM cross-sectional images. Upper line shows pristine films, bottom line BHO-nanocomposites of YBCO, DyBCO, HoBCO and ErBCO (from left to right).
Download figure:
Standard image High-resolution imageDespite several contradictions collected by MacManus-Driscoll et al in a thorough literature study [58], it is commonly agreed that the phase stabilities of the RE123 compounds differ significantly in dependence on the rare earth ion size, figure 4. While YBCO is known to form one of the most stable phases, mostly without any noticeable cation exchange in bulk materials [58], larger RE elements tend to form solid solutions through an exchange on the RE and Ba sites [59, 60] and smaller ions lead to vacancies in the lattice [58].
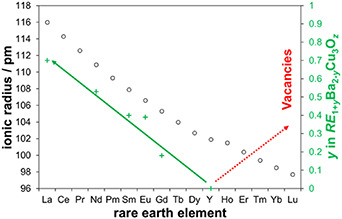
Figure 4. Rare earth ion size and phase stabilities: Shannon radii for RE3+ with 8-fold coordination [61], primary axis, black open circles, yttrium has been fit into the contracting line of lanthanides according to its size; increasing formation of a solid solution RE1+yBa2−yCu3Oz with increasing RE ion size beyond yttrium [59], secondary axis, green plus signs and solid line; scheme of the tendency to form vacancies with decreasing RE ion size beyond yttrium [58], red dotted line.
Download figure:
Standard image High-resolution imageBoth effects have significant implications for the REBCO phase stabilities with obvious impact on the crystallisation temperatures, Tcryst, required for an optimal film growth via CSD as well as on the width of the Tcryst windows, figure 5: YBCO, the most stable phase, has the maxima for Jc,sf(77 K) at the lowest growth temperatures compared to the other REBCO compounds, both for the pristine phases (∼780 °C) and the nanocomposites (∼770 °C). With falling and rising RE ion size, these optima shift towards higher growth temperatures, particularly in the case of pristine films on LAO, and the windows become incrementally narrower, particularly for the nanocomposites on STO. Tc values do not show as clear maxima as the Jc values, but YBCO and the adjacent compounds with similar RE ion sizes, HoBCO and DyBCO, span a rather large temperature window for very narrow transition widths (ΔTc = Tc90 − Tc10). The smaller and larger RE ions, Er and Gd, show similarly narrow ΔTc values only in a very small range of Tcryst ∼ 10 °C, in some cases only at a distinct annealing temperature. This is most likely due to inhomogeneities in the films caused by disorder on the atomic scale (solid solution or vacancies), which reduces the reproducibility dramatically. Those very narrow windows, specifically of the GdBCO and ErBCO nanocomposites, may certainly be considered difficult with respect to CC fabrication. Nevertheless, previous results have also shown that other growth parameters, such as the pO2, are further means to influence the quality and windows of the film growth. REBCO phases with larger RE ions, e.g. GdBCO, profit from lower pO2 [49].
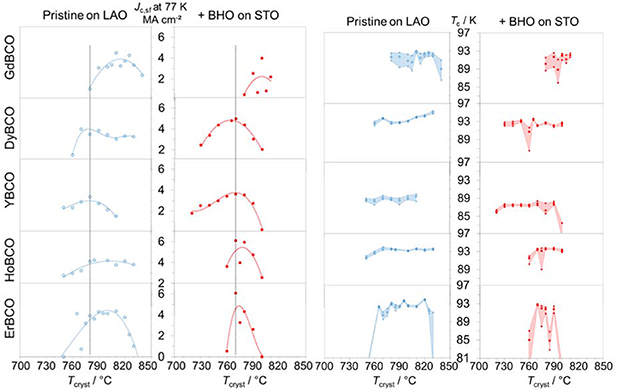
Figure 5. Windows of the crystallisation temperatures: inductively determined values of Jc,sf at 77 K on the left side and Tc (Tc,90 as upper, Tc,10 as lower limits of the coloured area and Tc,50 as larger circles within the frame) on the right side, both over the crystallisation temperature for five REBCO systems (RE = Gd, Dy, Y, Ho, Er with decreasing RE ion size top-down); the pristine phases on LAO are shown in blue, the nanocomposites on STO in red; the perpendicular lines in the Jc graphics mark the optima of YBCO, the most stable phase.
Download figure:
Standard image High-resolution imageThe record Tc and Jc values achieved so far in every REBCO system, regardless of BHO presence and including further samples grown with additional variations of the pO2, are summarized in figure 6. Up to this point, the growth of NdBCO has not been successful yet despite a very thorough scan of the Tcryst–pO2 matrix. None of the NdBCO samples shows any sign of superconductivity above 77 K. The x-ray diffraction patterns (not shown) give only very weak signs of the desired phase with poor c-axis texture but point towards very high optimal growth temperatures (>840 °C). This might be in conflict with the stability of the LAO substrate and the reason for the failing phase formation. Also SmBCO is more difficult than smaller RE ions. In contrast to NdBCO however, it forms the Sm123 phase without problems and with very dense and homogeneous films of good c-axis texture. Yet, the superconducting properties do not show the same reproducibility, which is attributed to the large stoichiometric disorder in the investigated films and, again, to an increasing influence of the substrate stability at the very high temperatures required for the film growth. Several SmBCO samples show very good properties, though, and the optimum temperatures seem to be ∼830 °C for both pristine films and nanocomposites grown at pO2 = 150 ppm. A reduction to 50 ppm slightly shifts the optima to 820 °C for both.
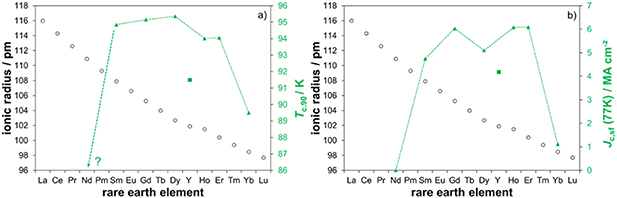
Figure 6. Record values: highest inductive values achieved so far (green, secondary axis) within the different REBCO systems combining pristine films, nanocomposites and all variations of pO2 during the crystallisation: (a) Tc,90; (b) Jc,sf at 77 K; the primary axes show the trend of the RE sizes again to show that the middle-size element Y drops out of the line of lanthanides with respect to superconducting properties (square symbol).
Download figure:
Standard image High-resolution imageOn the side of the smaller RE ions, YbBCO can be grown indeed, but it gives mostly broad transitions with a maximum Tc,90 of 89.5 K, figure 6(a). The optical appearance of the samples is already severely disturbed after the pyrolysis, which is in clear contrast to all the other REBCO systems investigated here. From our experience with the sensitivity of YBCO and GdBCO towards humidity in the solutions and as-deposited gel-like films [53], we assume that YbBCO solutions are significantly more sensitive to traces of water, and the addition of acetylacetone may not have the same beneficial effect. Therefore, YbBCO seems to require a further optimisation of the solution preparation and pyrolysis, before the growth of high-quality films can be addressed.
Disregarding the problematic cases of the very small and large RE ions Yb and Nd, optimally grown REBCO films from Sm to Er show a very narrow margin of Tc values ranging from 94.0 to 95.4 K, figure 6(a). Only YBCO drops out, which may be attributed to one or more of the following facts that distinguish Y from the other RE elements: Y is not a lanthanide, it is significantly lighter, and magnetic characteristics may play a role, too. Thus, a tendency of Tc solely related to the RE ion size as established in literature for bulk samples [62–64] is not observed in this investigation and may not even be expected since older studies suggest that also NdBCO [63] and YbBCO [65] can achieve Tc values of up to 96 K. A similar trend applies for the inductive values of Jc,sf at 77 K, figure 6(b): The lanthanides seem to head for the same direction and maybe the same limits of about 6 MA cm−2. The slightly lower values of DyBCO and SmBCO are rather a matter of statistics, but for the same reason the dropout of YBCO is real since more than a hundred samples have been prepared in this system over several years. However, 77 K is rather close to Tc, so the generally lower Jc values of YBCO can be considered a Tc effect.
Those record values shown in figure 6 may not be the absolute maxima possible but are presumably quite close to what can be achieved in thin films grown by CSD, particularly for Tc. One aspect that has been neglected for the present study though is the oxygenation process, namely conditions such as pO2, annealing temperature and dwell time. This topic has been widely ignored for many years although those parameters are expected to have a significant impact on the oxygen load and with that on the lattice parameters as well as Tc and Jc. Yet, this topic seems to be very comprehensive on its own and is, therefore, under current investigation. All films shown here have been oxidised in the same way, i.e. the films were annealed in pure oxygen (p = 1 atm) at 450 °C for about 120 min. The rather high annealing temperature and long dwell time are expected to allow for fast and thus mostly complete oxygen diffusion processes in the films. Subsequently, all samples were furnace-cooled in this atmosphere, whereby the slow cooling rates let us assume that equilibria of the oxygenation may have been reached down to 300 °C–350 °C. According to literature, the RE species has indeed a severe influence on the oxygenation of the REBCO phase, figure 7 [66, 67]. Yet, most of our systems seem to pass their respective optimum oxygenation temperature during the slow furnace-cool and may thus be considered optimally doped. Based on figure 7, only the two systems YBCO and ErBCO appear to have the potential for a further increase of Tc by quenching from the oxygen annealing temperature. Therefore, they may be slightly more in the overdoped region of the phase diagram due to the cooling in the furnace. However, aiming for their Tc maxima may even decrease rather than increase Jc since the Jc maximum had been found in the overdoped region [68–70].

Figure 7. Tc vs. oxygenation temperature: dependence of Tc on the oxygen annealing temperature for different REBCO phases with RE = Nd, Sm, Eu, Gd, Dy, Y, Ho, Er. Figure adapted from [66].
Download figure:
Standard image High-resolution imageIn combination with Tc, the c-axis parameter is often used to estimate the oxygen doping level of YBCO, as e.g. shown in [71]. Yet, this is only strictly valid for single crystals and has rather little relevance for thin films, where many more factors influence both Tc and c, such as stoichiometry variations due to secondary phase precipitation, foreign-ion permeation from the substrate or artificial pinning centres, and above all strain induced by the substrate, misoriented grains or secondary phases [72]. Nevertheless, the thin films interestingly show very distinct relations between Tc and c, the latter determined via the Nelson–Riley method [73], figure 8. The green lines depict the theoretical values of c in single crystals for oxygen deficit x = 0, c*, taken from the ICSD database. For YBCO, the entirety of data of superconducting films ever produced with CSD in our group forms a cloud around just this line of c* and an average value of Tc, ØTc,90, of roughly 87–88 K. Thus, a large number of samples is found with c< c* = 11.686 Å. Distinguishing between pristine films (open symbols) and nanocomposites (solid symbols) of YBCO, it is mostly the pristine samples with the very small values of c < c*, whereby those films show a dramatic decrease of Tc,90 with c on STO (red open symbols) and form a very dense cloud on LAO (blue open symbols) with ØTc,90 ∼ 89 K. The nanocomposites on STO (red solid symbols) also form a rather dense cloud around c* with ØTc,90 ∼ 87.5 K; on LAO (blue solid symbols), c stretches out to significantly larger values, though, without a negative impact on Tc,90. The generally very small values of c, particularly in pristine samples, point to high oxygenation grades with x close to zero, which supports the idea that the films may be slightly overdoped as deduced from figure 7. However, further microstructural events beyond the oxygenation seem to occur in films with c < c* causing slight compressive strain in the c direction of the crystal structure.

Figure 8. Tc vs. c: Dependence of Tc,90 on the lattice parameter c over all samples produced in the different REBCO systems (RE = Sm, Gd, Dy, Y, Ho, Er), open symbols stand for pristine, solid for nanocomposites, blue on LAO, red on STO; the green lines mark the theoretical c value for x = 0 in single crystals.
Download figure:
Standard image High-resolution imageThe underlying databases for HoBCO and ErBCO with the smaller RE ions may contain considerably less samples, yet one difference is obvious: c is mostly larger than c*. This suggests that the films are not as fully oxygenated as the YBCO films. Yet, strain caused by other reasons than oxygen vacancies may simply overcompensate and therefore mask the impact of oxygen loading on c. Comparable are the dense clouds with high Tc values for pristine films on LAO and the larger values of c for the nanocomposites.
In the direction of the larger RE ions, the Tc–c characteristics become more versatile. DyBCO shows nearly no Tc dependence on c, i.e. the c parameter extends from c* = 11.689 Å towards very large values of 11.796 Å maintaining Tc,90 of at least 90.4 K. The widest span has the nanocomposite on LAO, even showing c-parameters as small as c*; the pristine films on LAO have the narrowest range. It is very unlikely that the oxygenation grade is responsible for the expansion of c, since a strong impact on Tc should be expected. The reasons for the large c-axis parameters in DyBCO are not clear at present; yet, the high tolerance of Tc towards such an expansion of c is remarkable. GdBCO, on the other hand, shows a very dense data cloud again: almost all samples show c parameters very close to c* and ØTc,90 > 92 K. Only a few Tc values drop out amongst the nanocomposites on STO. Yet another behaviour occurs in SmBCO, as this system shows a dramatic decrease of Tc for increasing c.
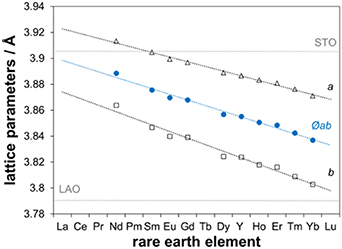
Some of the observations for the Tc–c correlation may have to remain uncommented, particularly the reasons for the severe differences between the large RE ions Dy, Gd and Sm, since too many factors may contribute. Yet, it can be concluded that the nanocomposites show wider ranges of the c parameter and generally larger values of c. Strain caused by the BHO nanoparticles is very unlikely the reason, since the strain fields around the particles are very narrow, as determined by TEM. Further, it cannot be concluded from our data that BHO generally suppresses Tc in CSD-grown films, as often observed in PLD-grown films [74–76]. In fact, for YBCO, the largest Tc values were found in nanocomposites. Thus, it is also unlikely that a diffusion of Hf into the REBCO matrix causes the stretch of the c-axis in the nanocomposites, since it should come along with a simultaneous decrease of Tc [77]. Also, the lattice parameter c is rather expected to decrease, if Hf4+ substitutes for Y3+ in the crystal structure [77]. Up to what extent the strain caused by the lattice misfit to the substrate has part in the Tc–c correlation is also unclear at present, since all REBCO systems lie on the same side of the misfit with respect to the two relevant substrates, figure 9: LAO induces compressive, STO tensile strain in the ab direction of the REBCO thin films, whereby the former increases with the RE ion size, while the latter decreases. Hence, similar impact on the c-parameters should be expected, i.e. an increasing expansion on LAO and a decreasing contraction on STO with increasing ion size. Such tendencies cannot be taken from the overall c-axis parameters of the investigated REBCO-substrate combinations, also because only a very thin layer is directly concerned by the misfit to the substrate, and means of stress relief are applied in the films. More TEM analyses of different samples within one REBCO system may have to be performed to clarify the reasons, specifically for the differences between the investigated systems.
Figure 9. Lattice parameters: dependence of the REBCO (x = 0) lattice parameters a (open triangles) and b (open squares) and their averages (solid blue circles) on the RE element, taken from the ICSD data base. The thin horizontal lines mark the lattice parameters of LAO and STO.
Download figure:
Standard image High-resolution image
4. Conclusions
Very similar microstructures were observed in CSD-grown films of different REBCO compounds (RE = Sm, Gd, Dy, Y, Ho, Er), above all similar stacking fault distributions with a graduation through the layers, as well as similar secondary phases, sizes and distributions. The macroscopic film structure of all investigated systems is absolutely dense and homogeneous when optimally grown. Despite that, very interesting and partly unique relations between Tc and c were found. While most of the systems form rather dense data clouds around their respective theoretical c-axis values for x = 0, the lattice parameters of SmBCO and DyBCO scatter in a considerably wider range with a drastic decrease of Tc with increasing c in the case of SmBCO and only a marginal impact on Tc in the case of DyBCO. BHO nanocomposites show generally larger values and ranges of c, but mostly without a significant impact on Tc. The processing windows seem to follow a trend with lowest optima and widest ranges of the growth temperatures close to the optimal RE ion size, i.e. Y3+. With increasing difference to it, the reproducibility for specific properties, such as Jc and Tc, sinks noticeably due to enhanced disorder on the atomic scale. In particular, the growth windows of the nanocomposites with small or large RE ions are very narrow and must therefore be considered more difficult for CC production due to reduced process stability. Further, no tendencies were observed that could be related to solely the RE ion size or weight. Particularly, the non-lanthanide YBCO drops out of several characteristics. The LnBCO compounds, on the other hand, head towards similar limits for Tc,90 ∼ 95–96 K and Jc,sf (77 K) ∼ 6 MA cm−2 when fully optimised. The very small and large RE ions Yb and Nd require further optimisation beyond temperature and pO2 adaption during the crystallisation step. Thereby, the substrate may play a crucial role for NdBCO, since temperatures beyond the stability of STO and LAO seem to be necessary, whereas YbBCO requires a re-formulation of the precursor solution or a modification of the pyrolysis, respectively, before the crystallisation step can be addressed adequately.