

Abstract
The testing accuracy and service life of long-span bridge monitoring equipment declines over time due to the adverse effects of environmental vibration during its operation. Therefore, it is essential to use effective methods to reduce the vibration of these devices. In this paper, inspired by the controllable and field-dependent properties of magnetorheological elastomer (MRE), a miniature laminated MRE isolator is designed and manufactured to provide a relatively stable working environment for the monitoring equipment. The method and process of its specific design are elaborated in detail based on the shape factor, allowable seismic displacement, lateral stiffness, allowable vertical load and analysis of magnetic circuit. Besides, a series of dynamic tests are conducted to obtain the characteristics of the MRE isolator under various loading conditions. The experimental results show that the maximum increase of the effective stiffness is 114.12% with the current increasing from 0 A to 3 A. Consequently, the validity of its design is confirmed by a fuzzy control experiment.
Export citation and abstract BibTeX RIS
1. Introduction
Continual monitoring of the physical state of bridges exposed to the adverse effects of environmental vibration can effectively prevent their sudden failure and in turn avoid serious human casualties and economic losses. Therefore, the detection of the physical state of bridges has become an important technology to ensure their safety. At present, large bridges have been installed with real-time monitoring systems [1, 2]. These monitoring systems are composed of thousands of sensors combined with corresponding controllers as shown in figure 1. Among them, some systems, such as the laser measurement system and fiber sensing system, require a strict external working environment [3–5]. However, bridges are exposed to horizontal vibration induced by earthquakes, wind vibration and vehicle–bridge coupling at a frequency below 20 Hz [6, 7]. The existence of the horizontal vibration will affect the accuracy and lifetime of these optical monitoring instruments. For instance, the horizontal vibration of the bridge will cause the laser beam to move far away from the target, thereby reducing its testing accuracy. In order to solve this problem, an isolating and energy dissipating device is installed between the bottom of the target and the top of the foundation. Currently, the rubber isolator is a mature and effective type of isolation equipment [8–10]. But, the characteristics of the rubber isolator are fixed due to the restrictions of the material [11]. That is, once designed and installed, rubber isolation systems are quite effective in meeting design goals but may be ineffective when the structure of an instrument is changed or they are exposed to different types of seismic waves.
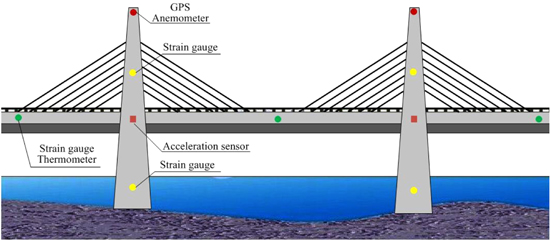
Figure 1. Safety monitoring system used for large bridges.
Download figure:
Standard image High-resolution imageIn order to overcome the shortcomings of traditional rubber isolators, several studies have proposed the concept of smart isolation systems whose stiffness or damping characteristics can vary with changes in the external environment to achieve their optimal isolation effects [12–15]. Magnetorheological elastomer (MRE) [16–20], composed of polymer (e.g. rubber, etc) and the soft magnetic micron particles (e.g. carbonyl iron powder, etc) cured under an applied magnetic field, provides an option for the design of smart isolation systems. Simultaneously, the real-time changes in shear modulus and damping with the applied magnetic field provide MRE with broad prospects for application in the vibration isolation area.
Much research has been done on MREs with many MRE isolators designed with diverse structures applied in the field of vibration control and isolation. Opie et al [21] used room temperature vulcanizing (RTV) silicone rubber-based MREs to design and fabricate a vertical semi-active base isolator. The experiments on vibration control were carried out by utilizing the semi-active controller and the results illustrated that compared with the passive cases, the attenuation of the resonance peak and load speed could reach 16% and 30%, respectively, under the controlled condition. Gong et al [22] designed a MRE isolator with a voice coil motor and used an on-off control strategy to test its performance. Experimental results displayed that the peak of the transfer rate was reduced by 70% under the controlled condition. Moreover, the attenuation of root-mean-square (RMS) and maximum load displacement reached 36% and 50%, respectively. Behrooz et al [23, 24] devised a semi-active/passive MRE isolation bearing based on rubbers and MREs. The control experiment of a three story building model was carried out by using a Lyapunov-control strategy and an El Centro wave. Experimental results showed that the maximum acceleration and displacement at the top of the model could be reduced by 22% and 58%, respectively. Li et al [25, 26] designed a lateral laminated MRE bearing used in large scale building isolation, which consisted of multilayer thin MRE sheets bonded onto multilayer thin steel plates. The experimental results revealed that its lateral stiffness could be significantly changed under different excitation currents and the maximum change was up to 1630%. This structure, which can ensure smaller horizontal stiffness, and at the same time, greatly improves its vertical bearing capacity, provides an alternative for MRE in the large building isolation field. In addition, Yu et al [27] used the same structure to design a laminated MRE bearing applied for seismic mitigation in bridge superstructures. The resonance frequency of the integrated system could be tuned from 10 Hz to 20 Hz and this demonstrated its potential for seismic mitigation for bridge superstructures.
Research on MRE isolators has mainly been focused on testing [21–30], modeling [24, 31–33] and control [21–23, 34, 35]. However, the specific design processes and principles of MRE are isolators rarely addressed. In this paper, based on the requirements of vibration isolation for optical monitoring instruments on bridges, a miniature MRE isolator is designed and described in detail to provide design methods for an engineering application of the MRE isolator. The basic size of the laminated MRE isolator is determined by four important parameters and its internal magnetic field is demonstrated by calculation and simulation. The rationality of the design is proven with the comparison of the theoretical and test results. Furthermore, the effectiveness of the design is also validated by the vibration control experiment and the sweeping-frequency test.
2. Design of laminated MRE isolator
2.1. Preparation and testing of MRE
In this work, a RTV silicon rubber (Type: SC-2110, Beijing Sanchen Industrial New Material Co. Ltd, China) was chosen as the MRE matrix. Silicone oil was selected as the plasticizer and soft magnetic carbonyl iron particles (CIP, Type: JCF2-2, d = 5 ∼ 8 μm, Jilin Nichkel Industry Co. Ltd, China) were used as the filling particles. The mass fraction of CIP, RTV silicon rubber and silicon oil is 70%, 15%, 15%, respectively. The CIP were added into the mixture of the RTV silicon rubber and silicone oil, and stirred vigorously for 25 min. As soon as the viscosity of the reactant has obviously increased, the mixture was placed in a vacuum oven to remove the air bubbles and then packed into aluminum molds. Finally, after curing for 24 h under a constant magnetic field of 0.7 T along the thickness of the MRE, the samples that were 2 mm in thickness were completely prepared.
The dynamic mechanical properties of the MRE samples were investigated using an advanced rheometer (Type: MCR301, Anton Paar, Austria). The testing frequency was set to 6 Hz with the magnetic flux densities ranging from 0 T to 0.85 T. It can clearly be seen that the shear storage modulus increases non-linearly with increasing of the magnetic flux densities and decreases with increasing of the strain from figure 2(a). That means the magnetic field and strain have a significant influence on the stiffness of MRE. Figure 2(b) presents the magnetorheological (MR) effect versus magnetic flux density under various strains, where the maximum MR effect is 1100% with a strain of 0.1%, while it reduces to 180% with a strain of 20%. Hence, the test results indicate that MRE is suitable for working under small strains and this characteristic is critical to the design of MRE isolators.
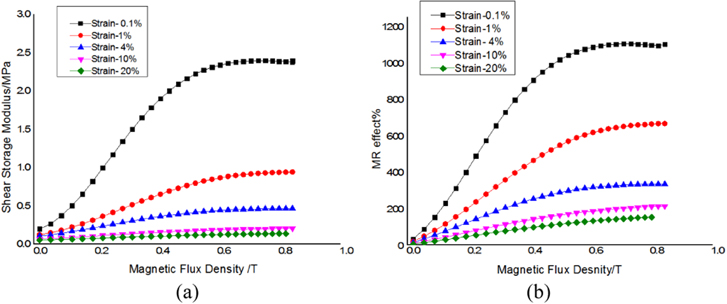
Figure 2. Shear storage modulus and MR effect versus magnetic flux density under different strains for MRE: (a) shear storage modulus curves and (b) MR effect curves.
Download figure:
Standard image High-resolution image2.2. Structure of laminated MRE isolator
Figure 3 shows the isolation system consisting of four MRE isolators used for the bridge monitoring equipment. The baseboards of the MRE isolators are fixed on the bridged-box bottom and the bridge monitoring equipment is installed on a steel plate connected to the top plate of the MRE isolators. In order to be used in this system, the isolator must possess high vertical stiffness but low lateral stiffness, simultaneously. The high vertical stiffness provides the isolator with the ability to carry the upper gravity load, while the low lateral stiffness can offer a lateral displacement to prevent the vibration from passing on to the monitoring devices. Therefore, learning from traditional laminated rubber bearings, such as lead-core rubber bearings [36] and high damping rubber bearings [37], a laminated structure where multilayer thin MRE sheets are bonded onto multilayer thin steel plates is adopted to design a MRE isolator for the experiment in this paper.
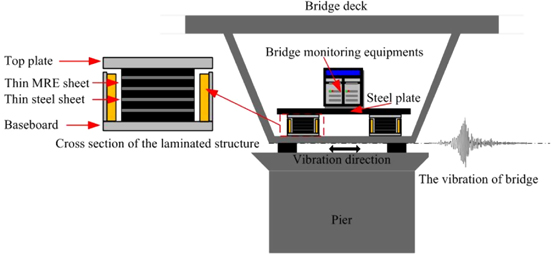
Figure 3. Isolation system for the bridge monitoring equipment.
Download figure:
Standard image High-resolution imageFor the laminated MRE isolator, the design requirements are determined by the upper target, material characteristics and external environment. The working displacement of the laminated MRE isolator is 2.5 mm for the micro-vibration of the environment. The safety monitoring system composed of various monitoring instruments with different sizes and weights for large bridges is very complex. However, the weight of most optical monitoring instruments whose characteristics are high precision and low weight is not more than 10 kg [3–5]. Therefore, the allowable vertical load of the laminated MRE isolator is 2.5 kg and the total bearing capacity of the isolation system 10 kg, as shown in figure 3, which is adequate for most of bridge optical monitoring instruments. The maximum expected magnetic flux density in laminated MRE sheets is 400 mT because the shear storage modulus as shown in figure 2(a) tends to be saturated at 400 mT, and a strong magnetic field requires high power consumption, which leads to heating phenomenon. Most importantly, the expected magnetic flux density must be large enough for actual magnetic flux leakage in the MRE isolator [26]. Finally, due to the external vibration the natural frequency of the MRE isolator should be less than 20 Hz.
Four parameters are crucial to both theoretical evaluation and practical implementation for the performance of the isolator, i.e. shape factor, allowable seismic displacement, lateral stiffness and allowable vertical load as part of the design process [29, 38]. The basic dimensions of the laminated MRE isolator can be ascertained according to the design requirements and the four design parameters.
2.2.1. Shape factor
The MRE in the laminated bearing will have lateral bulging phenomenon in the bearing process and the shape factor is proposed to describe the phenomenon of expansion, which is given by [29, 38]:

where  is the diameter of the MRE layers, and
  is thickness of a single layer cylindrical MRE (see figure 4). The choice of shape factor has a great influence on the performance of the device. If the shape factor is too large, the shear stress of the laminated MRE bearing will be reduced [39], and the MRE layers and steel plates will be easily stripped off [39]. Consequently, the shape factor of the laminated MRE isolator is determined to be 3.75 for isolation the vibration of small equipment. The calculated result of the MRE's thickness
  is 2 mm when the diameter of the MRE layers
  is 30 mm.
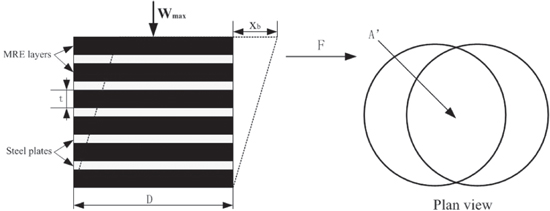
Figure 4. Circular laminated MRE bearing under gravity and lateral loads.
Download figure:
Standard image High-resolution image2.2.2. Allowable seismic displacement
The effective working displacement of laminated MRE isolator is limited by the small MR effect under large strain. Therefore, appropriate working displacement, allowable seismic displacement, is the key to the normal operation of the isolator. The allowable seismic displacement of the laminated MRE isolator  is given as follows [29, 38]:

where the maximum allowable shear strain  is 20% in order to ensure the effectiveness of the isolator for the low MR effect of MRE under large strain, and the effective height of MRE layers
  is equal to 12.5 mm for
  is 2.5 mm. However, due to the limit of the MRE's thickness, the final effective height is 12 mm. Therefore, 6 layers of MREs with 2 mm thickness which are bonded to 5 layers of thin steel plates with 1 mm thickness are used in the isolator and the overall height of the laminated MREs with steel plates is 17 mm.
2.2.3. Lateral stiffness
The natural frequency of the isolator is determined by the lateral stiffness, which is lower than 20 Hz for the limitation of the external vibration. The laminated structure of MREs and steel plates can severely limit the flexural deformations of the MRE isolator [24]. Consequently, it is assumed that the isolator only has pure shear deformations and its lateral stiffness  can be approximated as [29, 38]:

where  is the shear modulus of MRE,
  is the area of MRE layers (full cross section area).
The relationship of the natural frequency  and the lateral stiffness
  can be described as:

where  is the load of a single MRE isolator. From equations (3) and (4), the natural frequency is influenced by the weight of instruments, the cross-sectional area and the effective height of MRE. The low natural frequency can be achieved by reducing the cross-sectional area or increasing the thickness of the MRE. However, the vertical load will reduce if the cross-sectional area is too small, while the advantage of this multilayer structure will disappear if the MRE is too thick. The maximum natural frequency of the laminated MRE isolator is 34.55 Hz with the expected magnetic flux density of 400 mT (the shear modulus of the MRE is 2 MPa at 400 mT with a strain of 0.1%), and its minimum natural frequency is 6.08 Hz with the magnetic flux density of 0 mT (the shear storage modulus of the MRE is 0.062 MPa at 0 mT with a strain of 20%).
2.2.4. Allowable vertical load
It is known that high vertical loading capacity is one of the main characteristics of the MRE bearing for supporting the weight of targets. The allowable vertical load of the laminated MRE isolator can be written as [29, 38]:

where  is the overlap area from displaced top to bottom of bearing (see in figure 4).
Based on equations (1) and (5), the allowable vertical load of the isolator is related to the modulus and strain of the MRE. So, it is estimated that the allowable vertical load of the laminated MRE isolator is about 3.0 kg under the maximum allowable seismic displacement of 2.5 mm (20% strain) with no current applied to the isolator and it meets the design requirements.
The structural design of the laminated MRE isolator is limited by many factors and the design parameters must be optimized. Figure 5 shows a diagram of the structural configuration of the laminated MRE isolator. It consists of six layers of MREs which are bonded onto five layers of thin steel plates. The laminated MRE sheets are placed in the center of an electromagnetic coil with copper wires of 0.8 mm in diameter, which can provide a uniform magnetic field when current passes through it. In order to ensure the safety of the isolator, the distance between the laminated MRE sheets and coil bobbin makes the MRE isolator have a maximum deformation of 4 mm, which is bigger than the allowable seismic displacement. Moreover, there are two small grooves on the top cover and steel sleeve with a depth of 1 mm, where 80 steel balls of 2.8 mm in diameter are evenly distributed to prevent the upper and lower shaking of the top cover without changing the lateral stiffness of the MRE isolator as much as possible. In order to facilitate the connection with the external device and reduce the magnetic leakage, a top connecting plate and a under connecting plate made of aluminum alloy are distributed on the top and bottom of the isolator, respectively. The final dimensions of the MRE isolator are listed in table 1.

Figure 5. The section-view of the new laminated MRE isolator.
Download figure:
Standard image High-resolution imageTable 1. The dimensions of the laminated MRE isolator.
| Parts | Dimensions (mm) |
|---|---|
| Inner diameter of coil bobbin | 38 |
| Diameter of under connecting plate | 120 |
| Outer diameter of coil bobbin | 70 |
| Thickness of coil bobbin | 2 |
| Height of coil bobbin | 37 |
| Inner diameter of steel sleeve | 70 |
| External diameter of steel sleeve | 76 |
| Height of steel sleeve | 35 |
| Diameter of top cover and top connecting plate | 120 |
| Height of whole apparatus | 63 |
2.3. Analysis of magnetic circuit
A magnetic field is the key to the MRE isolator working properly. So, it is worthwhile to study its magnetic field. Figure 6 shows a model of the magnetic circuit used for the laminated MRE isolator. Kirchoff's magnetic law can be used to analyze the magnetic circuit design, which is given as follows [28]:

where  is the magnetic field intensity and
  is the length of the ith magnetic flux path,
  is the total winding number of coil and
  is the excitation current.

Figure 6. Model of magnetic circuit for the laminated MRE isolator.
Download figure:
Standard image High-resolution imageIn a weak magnetic field, the relationship between magnetic flux density and magnetic field intensity can be written as:

where  is the permeability of vacuum,
  and
and  are the relative permeability and the magnetic flux density for the ith magnetic flux path, respectively.
In addition, according to the Gauss theorem of magnetic field, the total magnetic flux passing through any closed surface must be zero. For the laminated MRE isolator, each section forms a close loop. Therefore, the magnetic flux  passing through any part of the cross-sectional area
  is the same, which can be described as:

Equations (6)–(8) can be simplified to:

where  is defined as the magnetic reluctance, which can describe the blocking capacity of the flux. The influence of magnetic reluctance to magnetic flux is the same as the effect of resistance to current. Figure 6 shows the five main parts of magnetic reluctance,
  to
to  Therefore, using the function of magnetic reluctance, each part can be established as follows:
where 


 .
.
The calculation results are shown in table 2, where the magnetic reluctance of the laminated MRE sheets is the biggest. Scilicet, MRE is the most important factor for the magnetic field of isolator. Thence, the key to optimize the magnetic circuit of isolator is to produce high-permeability MRE.
Table 2. The magnetic reluctance of the laminated MRE isolator.
| Magnetic circuit | L1 | L2 | L3 | L4 | L5 | Ltotal |
| Magnetic reluctance (10^6H−1) | 0.214 | 0.125 | 0.555 | 0.254 | 3.973 | 5.121 |
Based on equations (8)–(10), the magnetic flux density  can be expressed as:

Considering the limitation of the power dissipation and the driver, the maximum excitation current is 3 A, and the expected magnetic flux density in the laminated MREs is 400 mT. Therefore, based on equation (11), the total winding number is about 500 turns.
Subsequently, in order to verify the correctness of magnetic circuit design and analyze the distribution of the internal magnetic field, electromagnetic simulation of the MRE isolator is carried out using Ansoft Maxwell, which is used to calculate the electromagnetic properties under static, steady-state and transient conditions. The magnetic flux density and magnetic flux path under the excitation current of 3 A are shown in figure 7. The result indicates that the distribution of magnetic field is uniform under the working area of laminated MRE sheets. The design of the magnetic circuit is also proved to be correct by the magnetic flux density in laminated MRE sheets of 420 mT, which is similar to the calculation. Furthermore, in order to further understand the distribution of the magnetic flux density inside the laminated MRE sheets, figure 8(a) presents its distribution along the path defined as A–B in figure 7(a) under different currents, and the distribution of the magnetic field is very uniform. The magnetic flux density along the path C–D is shown in figure 8(b), where the magnetic flux density with both ends of the laminated MRE sheets is slightly larger than the middle of the magnetic field. In addition, the magnetic flux density between the MRE sheets and the steel plates will be changed for the different permeability of the two parts and its maximum variation is about 10 mT.

Figure 7. Electromagnetic simulation: (a) magnetic flux density and (b) magnetic flux path.
Download figure:
Standard image High-resolution image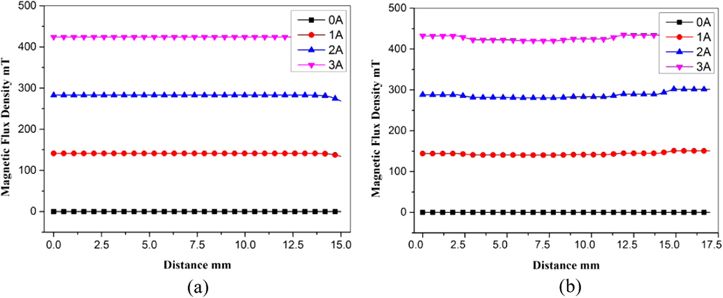
Figure 8. Magnetic flux density in the laminated MRE sheets: (a) path A–B, (b) path C–D.
Download figure:
Standard image High-resolution image3. Experimental testing and analysis
3.1. Dynamic mechanical properties of experimental setup
In order to evaluate the dynamic mechanical properties of this MRE isolator, an experimental system shown in figure 9 was built. In the system, an electrodynamics vibration shaker (Type: DC-1000-15, Suzhou Sushi Testing Instrument Co., Ltd, China) and a horizontal sliding table (Type: SV-0505, Suzhou Sushi Testing Instrument Co., Ltd, China) were used to provide sinusoidal excitation. The MRE isolator was installed on the sliding table and moved along with it. A load cell (BISE5110, No. 0748) was connected with the top cover by a fixed support so as to measure the lateral load generated by the isolator. A laser displacement sensor (Type: SUNX-LM10, SUNX, Japan) was fixed to the ground in order to detect the displacement of the sliding table. The force and displacement signals were collected with a data acquisition instrument (Type: MDR-05, Beijing Aerostandard New Technology Company, China). During the experiment, a DC power (Type: WYK-305B, EAST Electric Power System Technology Co., Ltd, China) was employed to supply DC current to the MRE isolator.
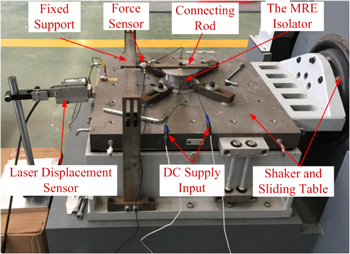
Figure 9. The experimental setup of the MRE isolator.
Download figure:
Standard image High-resolution imageFor all tests, various harmonic inputs with different displacements (0.5 mm, 1 mm, 2 mm and 2.5 mm equal to the shear strain of 4.2%, 8.3%, 16.7% and 20.8%) and different frequencies (1 Hz, 2 Hz, 4 Hz and 6 Hz) were chosen to test the field-dependent properties of the MRE isolator with different DC currents (0 A, 1 A, 2 A and 3 A).
3.2. Experimental results and analysis
The measurement of force-displacement is a very important to studying viscoelastic materials (e.g. rubbers and MREs) and devices and their characteristics. Figure 10 shows the force response of the isolator at 4 Hz and 2.5 mm with different currents, where the force increases with increasing current, 10 N for 0 A and 18 N for 3 A. Figure 11 shows the force-displacement relationships under displacements of 2.5 mm, with different excitation frequencies and currents. From the figure, one can see that the maximum force increases with the increase in applied currents and magnitude of displacements. Since the slope and the enclosed area of the force-displacement loops represent the lateral stiffness and the equivalent damping of the MRE isolator, respectively, it can also be observed that both the lateral stiffness and the damping of the isolator increased significantly with the increasing currents.
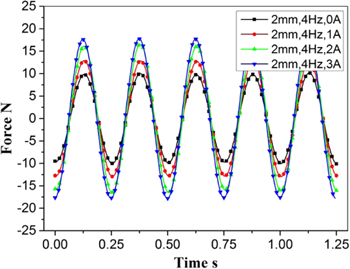
Figure 10. Force response of the MRE isolator at 4 Hz and 6 mm with different currents.
Download figure:
Standard image High-resolution image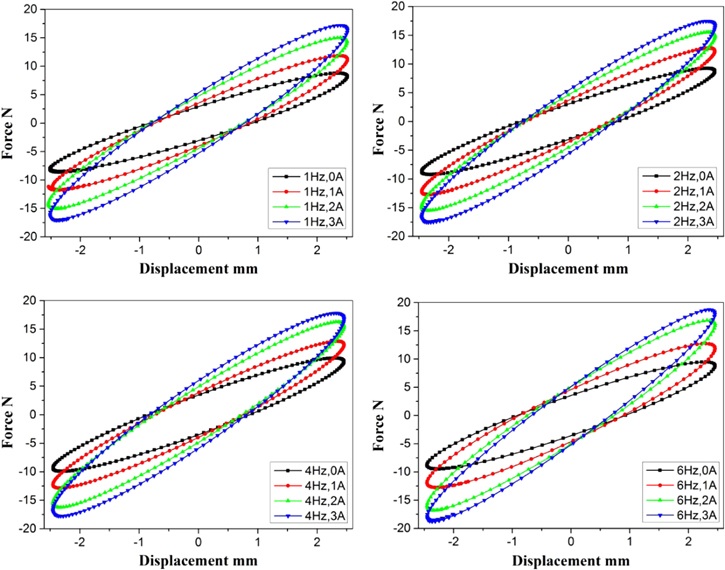
Figure 11. The force-displacement relationships with displacement of 2.5 mm (1, 2, 4, 6 Hz).
Download figure:
Standard image High-resolution image3.2.1. Effective stiffness
The effective stiffness of the MRE isolator, determined by the force-displacement loop, is given as [26]:

where  is the force at the maximum displacement
  of the loop and
  is the force at the minimum displacement
  of the loop.
Figure 12 presents the relations of its effective stiffness versus the applied currents under various frequencies, while the loading amplitudes are 2 mm and 2.5 mm, respectively. It can be seen that the effective stiffness increases almost linearly with applied currents and their variation trends almost stay the same under various frequencies. Moreover, the effective stiffness increases with the increasing frequency, but the increasing trend is not obvious. This phenomenon can be clearly observed in figure 13, where the variation of the effective stiffness versus frequency is indicated, and the reason for this phenomenon is that the shear storage modulus of MRE changes little with the loading frequency. Figure 14 shows the relationship between the effective stiffness and the displacement where the effective stiffness decreases with increasing displacement, since the MR effect becomes smaller under larger strain as shown in figure 2(b). For a given loading frequency and a current, its relative decrease is around 40% with the displacement increasing from 0.5 mm to 2.5 mm.
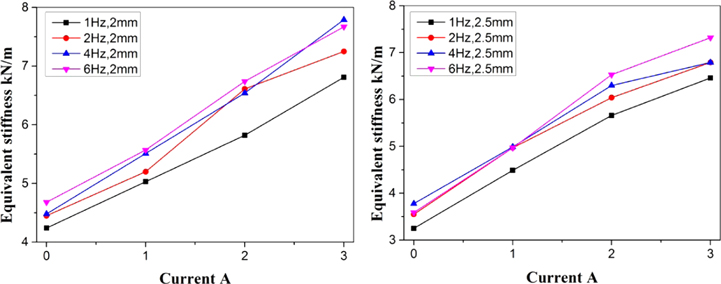
Figure 12. The curve of effective stiffness of the MRE isolator versus currents.
Download figure:
Standard image High-resolution image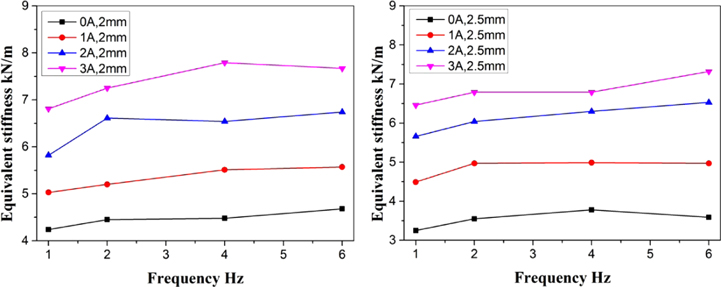
Figure 13. The curve of effective stiffness of the MRE isolator versus loading frequency.
Download figure:
Standard image High-resolution image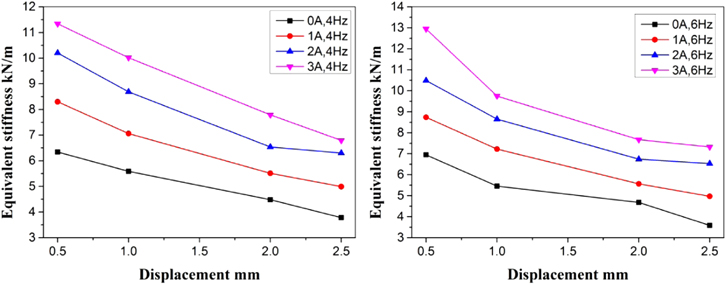
Figure 14. The curve of effective stiffness of the MRE isolator versus displacement.
Download figure:
Standard image High-resolution imageTable 3 lists all of the effective stiffnesses under different loading conditions, where the maximum increasing of the effective stiffness is 114.12% as the current increases from 0 A to 3 A. Compared with different loading conditions, the effective stiffness of the MRE isolator is mainly affected by the currents and the loading displacements. Under large strain, the decrease of the MR effect is one of the most important factors limiting the application of MRE in the engineering field.
Table 3. Effective stiffness (kN/m) of the isolator under different loading conditions.
| Amplitude D = 0.5 mm | Amplitude D = 1 mm | |||||||
|---|---|---|---|---|---|---|---|---|
| Frequency (Hz) | Frequency (Hz) | |||||||
| Currents (A) | 1 | 2 | 4 | 6 | 1 | 2 | 4 | 6 |
| 0 | 5.24 | 5.64 | 6.34 | 6.95 | 4.71 | 5.25 | 5.59 | 5.46 |
| 1 | 7.97 | 8.12 | 8.30 | 8.74 | 6.14 | 6.63 | 7.06 | 7.22 |
| 2 | 8.59 | 10.10 | 10.20 | 10.49 | 7.53 | 8.69 | 8.69 | 8.65 |
| 3 | 11.22 | 11.26 | 11.34 | 12.95 | 8.81 | 10.02 | 10.02 | 9.75 |
| Increasing (%) | 114.12 | 99.64 | 78.86 | 96.51 | 87.05 | 70.67 | 79.25 | 78.57 |
| Amplitude D = 2 mm | Amplitude D = 2.5 mm | |||||||
| Frequency (Hz) | Frequency (Hz) | |||||||
| Currents (A) | 1 | 2 | 4 | 6 | 1 | 2 | 4 | 6 |
| 0 | 4.24 | 4.45 | 4.48 | 4.68 | 3.25 | 3.55 | 3.78 | 3.59 |
| 1 | 5.03 | 5.20 | 5.51 | 5.57 | 4.49 | 4.97 | 4.99 | 4.97 |
| 2 | 5.82 | 6.61 | 6.54 | 6.74 | 5.66 | 6.04 | 6.30 | 6.53 |
| 3 | 6.81 | 7.25 | 7.79 | 7.67 | 6.46 | 6.79 | 6.79 | 7.32 |
| Increasing (%) | 60.61 | 62.92 | 73.88 | 63.89 | 98.77 | 91.27 | 91.27 | 103.9 |
3.2.2. Equivalent damping
For characterizing the energy-dissipation performance of the MRE isolator, equivalent damping is adopted, described as [26]:

where  is the area of each force-displacement loop,
  is the loading frequency and
  is the maximum loading displacement.
Figures 15 and 16 show that the equivalent damping of the MRE isolator increases linearly with the increasing applied current, but decreases exponentially with the increasing loading frequency under the displacements of 2 mm and 2.5 mm. In addition, the lower the frequency of excitation, the more obvious the variation of the equivalent damping with the current, while the greater the applied current, the more significant the changing of the equivalent damping with the frequency. All the damping results are listed in table 4 and its maximum increasing is 1205.5% as the current increases from 0 A to 3 A when the loading frequency is 1 Hz and displacement is 0.5 mm. Moreover, the increasing of the equivalent damping attenuates distinctly with the larger displacement. So, it can be concluded that the variation of damping is related to the current, the displacement and the frequency through analyzing these data.

Figure 15. The curve of equivalent damping versus currents.
Download figure:
Standard image High-resolution image
Figure 16. The curve of equivalent damping versus loading frequency.
Download figure:
Standard image High-resolution imageTable 4. Equivalent damping (Ns m−1) of the isolator under different loading conditions.
| Amplitude D = 0.5 mm | Amplitude D = 1 mm | |||||||
|---|---|---|---|---|---|---|---|---|
| Frequency (Hz) | Frequency (Hz) | |||||||
| Currents (A) | 1 | 2 | 4 | 6 | 1 | 2 | 4 | 6 |
| 0 | 34.8 | 33.6 | 31.7 | 15.4 | 61.3 | 38.5 | 46.5 | 42.5 |
| 1 | 272.5 | 155.8 | 31.5 | 26.3 | 187.2 | 79.9 | 66.8 | 58.7 |
| 2 | 367.7 | 87.3 | 60.5 | 41.2 | 278.0 | 130.6 | 81.9 | 74.8 |
| 3 | 454.1 | 182.9 | 115.4 | 66.2 | 359.5 | 162.3 | 104.0 | 72.8 |
| Increasing (%) | 1205.5 | 445.1 | 263.8 | 329.0 | 486.6 | 321.4 | 123.9 | 71.1 |
| Amplitude D = 2 mm | Amplitude D = 2.5 mm | |||||||
| Frequency (Hz) | Frequency (Hz) | |||||||
| Currents (A) | 1 | 2 | 4 | 6 | 1 | 2 | 4 | 6 |
| 0 | 96.1 | 72.5 | 53.7 | 35.6 | 191.9 | 99.9 | 56.5 | 38.5 |
| 1 | 159.5 | 103.1 | 62.4 | 41.8 | 243.6 | 119.2 | 63.6 | 47.7 |
| 2 | 238.5 | 138.0 | 82.0 | 60.7 | 291.9 | 149.0 | 79.3 | 54.7 |
| 3 | 318.3 | 173.1 | 94.7 | 67.2 | 336.7 | 178.8 | 96.3 | 56.2 |
| Increasing (%) | 231.1 | 138.8 | 76.3 | 89.0 | 75.4 | 79.0 | 70.5 | 46.0 |
The natural frequency of the MRE isolator is directly related to its lateral stiffness, which is affected by the excitation current and the amplitude of the external excitation. The theoretical stiffness of the MRE isolator can be calculated according to the shear storage modulus of the MRE and equation (3). However, the actual stiffness of the MRE isolator is far less than its theoretical frequency due to the existence of serious magnetic flux leakage. Table 5 shows the comparison of the effective stiffness between theoretical and experimental data. It is obvious that the theoretical value is basically consistent with the experimental value with 0 A, while the error increases with the increasing current and the maximum error can reach −95.67%. In addition, under the condition of large strain (20% shear strain), there is little difference between the experimental value and the theoretical value. In the design process of the MRE isolator, there are a lot of differences between the actual results and the theoretical goals for the magnetic flux leakage [26]. Therefore, the effect of magnetic flux leakage must be considered in the early stage of the MRE isolator's design and the design margin of the magnetic field should be enlarged to ensure that the performance meets the requirements.
Table 5. Comparison of the effective stiffness (kN/m) between theoretical and experimental data.
| 4% shear strain | 20% shear strain | |||||
|---|---|---|---|---|---|---|
| Current (A) | Theoretical stiffness | Experimental stiffness | Error (%) | Theoretical stiffness | Experimental stiffness | Error (%) |
| 0 | 6.62 | 6.95 | 4.75 | 3.64 | 3.59 | −1.39 |
| 1 | 14.07 | 8.74 | −60.98 | 5.46 | 4.97 | −9.86 |
| 2 | 19.73 | 10.49 | −88.08 | 6.96 | 6.53 | −6.58 |
| 3 | 25.34 | 12.95 | −95.67 | 7.87 | 7.32 | −7.51 |
3.3. Transmissibility and phase responses of the isolation system
The results of the dynamic mechanical properties show that the MRE isolator possesses good magnetic-control characteristics. In this section, the transmissibility of the isolation system shown in figure 3 is tested and discussed.
Figure 17 shows the experimental setup to evaluate the transmissibility of the isolation system. In the testing system, four identical MRE isolators are installed on a horizontal sliding table and the isolated target is installed on a steel plate connected to their top plates. An electromagnetic exciter (Model JZK-50, Sinocera Piezotronics, China) is connected with the sliding table and driven by a sine sweeping-frequency waveform produced by a signal generator (Model 33120 A, Agilent, USA) and amplified by a power amplifier (Model YE5874, Sinocera Piezotronics, China). Two accelerators (Model 333B52, Piezotronics, USA) are arranged on the surface of the sliding table and the steel plate to measure the excitation and response signals, respectively. A data acquisition instrument (Model MDR-05, Beijing Aerostandard New Technology Company, China) is used to collect acceleration signals and send them to a computer. Meanwhile, four DC powers (Model WYK-305B, EAST Electric Power System Technology Co., Ltd, China) supply currents for these MRE isolators.
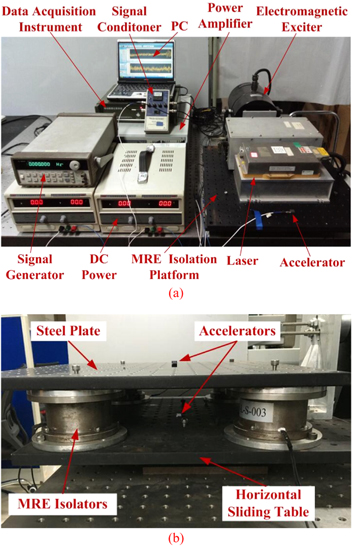
Figure 17. Photo of the experimental setup: (a) the MRE isolation system and (b) the MRE isolation platform.
Download figure:
Standard image High-resolution imageThe frequency of the sine sweeping-frequency excitation is changed from 5 Hz to 20 Hz and the value of its acceleration peak is 0.1 g, while the DC currents are independently altered from 0 A to 3 A with 1 A increments. The total weight of the steel plate and the laser is 6.75 kg.
Figure 18 displays the magnitude and phase-frequency curves of transmissibility under different currents. It is obvious that the resonance frequency of the isolation system increases with the increase of input currents. This system can be represented by the Kelvin model [27, 34]. The parameters, such as stiffness and damping, are identified in figure 18(a) and the formulas in [27]. Table 6 provides the parameters of the MRE isolation system, where the resonance frequency is increased by 70.09% with the input currents increasing from 0 A to 3 A. Moreover, the stiffness and the damping of the system are increased by 198.74% and 130.44%, respectively.

Figure 18. The magnitude and phase-frequency curves of transmissibility under different currents: (a) the magnitude-frequency curve and (b) the phase-frequency curve.
Download figure:
Standard image High-resolution imageTable 6. The parameters of the MRE isolation system.
| Input currents | |||||
|---|---|---|---|---|---|
| Parameters | 0 | 1 | 2 | 3 | Increase (0A–3 A) |
| Resonance frequency (Hz) | 9.26 | 10.85 | 12.86 | 15.75 | 70.09% |
| Stiffness (kN m−1) | 23.81 | 32.98 | 46.84 | 71.13 | 198.74% |
| Damping (Ns m−1) | 113.06 | 147.20 | 193.43 | 260.54 | 130.44% |
Ultimately, the result of the sweep-frequency test illustrates that the resonance frequency of the isolation system is within 20 Hz when the input currents are changed, and it is consistent with the design requirements.
3.4. Experimental validation of the isolation system with a fuzzy controller
In order to further verify the effectiveness of the isolation system for the bridge monitoring equipment, a vibration control system shown in figure 19 with a fuzzy controller is set up. In the system, the signal generator, the power amplifier and the electromagnetic exciter are used to generate sine excitation. The excitation and response signals measured by the two accelerometers are sent to the dSPACE AutoBox (Model ds1005, dSPACE, Germany), where the fuzzy controller is downloaded. Four current drivers convert the control voltage output by the controller to the control current to drive the four MRE isolators, and the DC powers supply constant voltage for these drivers. The concrete design of the fuzzy controller and the control principle are described fully in [34].
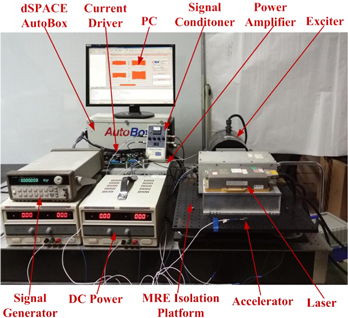
Figure 19. Experimental setup of the vibration control system for the isolation system.
Download figure:
Standard image High-resolution imageOver the course of the experiment, a sine single-frequency excitation is produced by the electromagnetic exciter and its peak values of acceleration are 1 m s−2. The frequencies are also chosen from 8–17 Hz in 1 Hz increments.
Figure 20 indicates the acceleration response and the control current of the isolation system with the sine excitation of 8 Hz. The RMS of the fuzzy-off response acceleration is 0.8933 m s−2, while the fuzzy-on response acceleration is 0.8204 m s−2, which is reduced by 8.16%. Figure 21 gives the acceleration response and the control current of the isolation system with the sine excitation of 14 Hz. The RMS values of the fuzzy-off and the fuzzy-on are 1.6971 m s−2 and 1.4470 m s−2, respectively, and the attenuation of the RMS is 14.73% after fuzzy control.
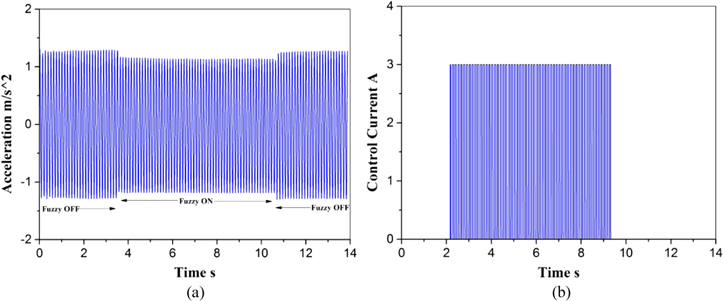
Figure 20. Experimental results with a fuzzy controller and 8 Hz excitation: (a) the acceleration response, (b) the control current.
Download figure:
Standard image High-resolution image
Figure 21. Experimental results with a fuzzy controller and 14 Hz excitation: (a) the acceleration response, (b) the control current.
Download figure:
Standard image High-resolution imageFigure 22 presents the frequency response of the isolation system with sinusoid base excitations. The transmissibility with fuzzy control has obvious attenuation, compared with no fuzzy control, and the maximum attenuation is 18.31% with the frequency of 12 Hz. Therefore, the vibration control experiment verifies the effectiveness of the isolation system for the bridge monitoring equipment.

Figure 22. Frequency response to sinusoid base excitations.
Download figure:
Standard image High-resolution image
4. Conclusion
A detailed design method based on a lateral laminated MRE isolator is proposed in this paper. The design of the structure and magnetic circuit was carried out to ensure the shape factor, allowable seismic displacement, allowable vertical load, lateral stiffness and distribution of magnetic field. The behaviors of the MRE isolator were experimentally tested and results were analyzed based on two important measures, i.e. effective stiffness and equivalent damping. Its maximum increasing of the effective stiffness is 114.12% as the current increases from 0 A to 3 A, and the isolator can be used as a controllable stiffness device. Moreover, the rationality of the design is also verified by the fuzzy control experiment. Consequently, following the analysis mentioned above, the laminated MRE isolator has great potential in the field of vibration suppression for bridge monitoring equipment and this design approach is valuable for the MRE isolator.
Acknowledgments
This research is funded by Chongqing Research Program of Basic Research and Frontier Technology (Grant No. CSTC2015JCYBX0069), the Fundamental Research Funds for the Central Universities (Grant No. CDJXY120004) and the Natural Science Foundation of Chongqing (Grant No. CSTC201JCYJA0848). The authors are grateful for their support.