
Abstract
We demonstrate a new gas-based  generation source using a low power radio frequency driven atmospheric pressure plasma configured to deliver the radical flux into the far effluent region, well away from interference from other plasma factors such as electric fields, currents, and ultraviolet radiation. Using He–H2O gas chemistry isolated from the laboratory air, the plasma generated flux contains
  and other radicals including, O and HO2 as well as H2O2 which, along with, was found to vary with H2O vapour content and absorbed power density. Peak flux values were 2.3 nmol s−1 and 0.23 nmol s1 for H2O2 and
  respectively at a distance of 50 mm from the plasma, with 790 ppmv H2O and a power density of ∼108 W m−3. The maximum
  flux density was 4.5 × 10¹⁹ m−2s−1 falling to 1.7 × 10¹⁹ m2 s1 at 110 mm, equivalent to generation rates of 74 µM s1 and 28 µM s−1. Despite high
  recombination rates at the plasma exit, the escaping flux is still significant, indicating a viable delivery capability to downstream targets. Its performance with regard to
  generation rates compares well with traditional
  generation techniques such as radiolysis, advanced oxidation processes and enhanced Fenton-chemistry approaches where
  production rates are sub-µM s−1. Delivering precisely quantifiable
  fluxes provides new opportunities for scientific studies and technological opportunities in cell biology, atmospheric chemistry, protein unfolding and systematic dose studies for plasma-based and other
  related potential medical treatments.
Export citation and abstract BibTeX RIS

Original content from this work may be used under the terms of the Creative Commons Attribution 4.0 license. Any further distribution of this work must maintain attribution to the author(s) and the title of the work, journal citation and DOI.
1. Introduction
The hydroxyl radical,  , plays an important role in numerous areas including atmospheric chemistry [1], water treatment and pollution remediation [2], antibiotics and disinfection [3], tumour therapy [4, 5] and protein studies [6], among others. Fenton chemistry has found wide application as a hydroxyl source, however other areas require alternative approaches to avoid unwanted byproducts, to operate outside low pH environments or achieve much faster reaction times [7]. For example, with protein footprinting, direct
  generation via synchrotron radiolysis of H2O [8, 9] or excimer laser photolysis of H2O2, Chen et al have demonstrated ultra-fast and irreversible labelling of proteins capable of following their folding/unfolding dynamics [10]. Other, more accessible, direct techniques including electrospray and plasma generated
  are currently being explored [11].
  is considered the most reactive and toxic radical in biology and selective
  generation approaches have been proposed for cancer therapy. Gamma radiolysis is known to produce a high concentration of
  radicals with strong evidence that these play an important, even dominant role, in DNA destruction and tumour cell death. In enhanced chemodynamic therapy, photodynamic, photothermal, sonodynamic and radiation therapies are used to enhance Fenton-like reactions from nanomedicines in the acidic tumour microenvironment [4, 12, 13].
Atmospheric pressure plasmas have attracted considerable attention in the past decade as radical sources for application as possible medical treatments for wound healing and cancer [14]. These plasma devices are efficient generators of reactive oxygen and nitrogen species, producing a rich cocktail of species in the gas phase at high concentrations which can be delivered directly to tissue [15, 16]. Plasmas can also produce high UV photon fluxes, injected currents and electric fields and have been shown to induce significant biological effects [17]. Considerable effort has gone into characterising the complex plasma physical and chemical properties on the one hand and attempting to correlate plasma species fluxes with biological outcomes on the other. There are many cold plasma sources designs, and these can generally be classified as either plasma jet (APPJ) or dielectric-barrier discharge (DBD) and can further categorised as either direct-contact or indirect-contact. In the former, the treatment target, including liquid, forms part of the plasma electrical circuit while in the latter, the circuit is isolated, but the plasma is sufficiently close to allow species interaction. Commercially available devices such as the kINPen [14, 18] and PlasmaDerm [19] are examples of direct and indirect sources respectively. Irrespective of the electrical circuit, it can be argued that all such plasmas are effectively coupled to the treatment substrate since the plasma-substrate gap is either very small or electric-field propagation via ionisation waves recreates the plasma downstream [20, 21]. This has the advantage of delivering the high radical fluxes required but brings with it certain technological and scientific disadvantages. The associated electric fields, currents and UV radiation along with potentially high temperature gradients, flow induced turbulence and impurity re-entry into the plasma creates significant challenges for real-time monitoring and responsive control in a clinical environment. From a scientific perspective, the interplay of these multiple synergistic factors represents a major obstacle to systematic plasma–liquid characterisation and simulation, while the inclusion of biological interactions adds an additional layer of complexity that delays our fundamental understanding and predictive capabilities. In this work we aim to investigate a truly non-coupled remote plasma operating at a sufficient stand-off distance from a liquid substrate. By isolating the plasma itself from the ambient environment, and thus excluding air ingress, we have much greater control of the gas chemistry. Using the plasma interaction of helium and water vapour only, we can generate various HOx (x: 0–2) and O species as the primary radicals, along with H2O2. Other species (e.g. O2(a1 Δ), O3) may be present but at much lower concentrations [22]. While OH· flux levels may not match those of direct contact plasmas [23], the relative purity of the radical source and the absence of electric fields and currents may prove to be a major advantage for applications such as tumour therapy or protein footprinting. Also, such as source provides a new tool for investigating individual factors relevant to plasma—biological interactions, allowing thereafter incremental increases in the complexity of plasma chemistry and determination of synergistic or multivariate effects.
Changing the water vapour content of the feed gas has been found to be an effective way to control the  radical concentration within the plasma region and therefore in the APPJ effluent itself [22, 24–27]. Noble gas plasma interaction with trace water vapour gives rise to many species and reactions due to multiple pathways including electron impact ionisation, excitation, and dissociative attachment as well as ion-molecule reactions. The use of an radio frequency (RF) excited plasma ensures the plasma region is restricted to a short distance (∼mm) from its electrodes [28]. In air, the effective rate coefficient for
  recombination is 1.6 × 10⁸ M−1s−1 with trace (∼10 pM) components, e.g. CO, present [29, 30]. In the plasma effluent, however, the
  is isolated from ambient air for most of the flight time, and its lifetime is determined primarily by two-body (
 +
+  → H2O + O), (
 + HO2 → O2 + H2O), (
 + O → O2 + H) or three-body (H +
  + H2O → 2H2O) recombination reactions [22]. Attri et al report
  lifetimes in the gas phase above a liquid surface of ∼4 ms for high
  concentration levels around 1022 m−3 and by inference ∼1 ms for typically reported plasma
  concentrations [31]. This is a directly—coupled plasma source and hence high densities of
  radicals may be expected at the liquid surface which could contribute significantly to
  recombination at the gas–liquid interface [32]. However, with remote plasmas, knowledge of
  lifetimes and uptake by liquid are not known.
Measurement of neutral and ionic species have been performed in the plasma and afterglow regions via laser-induced fluorescence (LIF) [33, 34], ultraviolet (UV) and vacuum ultraviolet (VUV) absorption [35, 36], two-photon LIF (TALIF) [26, 37, 38], and mass spectrometry [26, 39–43] among others. Willems et al and Benedikt et al measured the  and O species densities in the field-free effluent of a He–H2O RF (13 MHz) plasma jet, up to 25 mm from the RF plasma source [26, 43]. Near the plasma, they observed an increase in
  density ∼1020 m−3 as the H2O content increased, saturating at ∼5000 ppmv. Similar results have been obtained by Bruggeman et al in the plasma region [44]. At 20 mm from the plasma, the
  density had decreased by over an order of magnitude, for a gas flow of 1.4 SLM and [H2O] >7000 ppmv [26] while under similar conditions, H2O2 concentrations remain relatively constant and HO2 is no longer present. Verreycken et al, with an Ar–H2O jet into air, observed the reduction in
  density by a factor of 10 within 8 mm from the plasma at high H2O content [33]. Reuter et al, using TALIF, determined atomic oxygen density up to 100 mm from the RF He plasma nozzle [45]. However, in this case VUV emission from oxygen lines was sufficient to maintain the oxygen density by photo-dissociation, over long distances. Outside the plasma region, dissociative recombination of H2O+ can be a dominant pathway for
  formation, where H2O+ is often formed by penning ionisation with He metastables [32]. In the absence of additional oxygen, loss mechanisms along the jet axis may involve
  recombination with
  radicals to form H2O and three-body recombination to form H2O2 [32]. The H2O +
  → H2O +
  reaction is symmetric and therefore not of significance [46].
For most chemistries, it is difficult to measure gas phase species directly beyond the afterglow/near effluent regions; downstream liquid chemical analysis or simulation therefore have been used to infer upstream plasma chemistry [47–49]. With both directly coupled kHz jets [47, 49], and remote RF jets [48], there is strong evidence that species (H2O2, OH•) measured in liquid are created in the plasma gas phase. While liquid chemical probing offers the possibility of determining gas species density profiles upstream, such measurements have not been reported, although Kawasaki et al obtained relative measurements of ROS variation with distance up to 30 mm, for a directly coupled jet, and Plimpton et al bubbled plasma (O3
−) effluent through H2O2 to generate  in liquid far downstream [50, 51]. Overall, where measurements have tracked changes with distance, such distances are generally <10–20 mm and species densities are observed to drop by a factor of 10. Experimental determination however, of
  fluxes and their decay over extended distances from the plasma, has not been carried out.
In this work we present an RF APP operating in helium with a controlled admixture of water vapour for remote radical delivery. We investigate the plasma's ability to deliver reactive molecules to a sample solution up to 110 mm downstream of the plasma by quantifying the flux of H2O2 and  at the gas/liquid interface. At this distance the sample is far enough removed from the plasma region that any species measured are the result of transport alone and not from plasma interaction with the liquid itself. The effect of feed gas humidity on both the power absorbed by the plasma and
  production is reported, and an optimum humidity for maximum
  delivery discussed. Specie fluxes were used as inputs to a zero-dimensional (0D) kinetics model, modified to simulate the progression of species densities generated in the plasma region into the far effluent. Trends in measured fluxes with changing plasma conditions were compared against the model's output to test the model's validity at predicting long range delivery of
  and H2O2. The performance of the remote plasma source with regard to
  production rates is compared with other
  generating sources such as radiolysis, advanced oxidation processes (AOPs) and enhanced Fenton chemistry approaches as well as with direct contact and directly coupled plasma devices.
2. Methods
The RF APP used in this study (figure 1) consists of a 2 mm inner diameter quartz capillary surrounded coaxially by two 1 mm diameter copper ring electrodes, separated by 2 mm. A 13.56 MHz wave was generated by a Cesar RF power generator and coupled to the electrodes with the aid of an MFJ antennae tuner. A more detailed description and operation of this RF APP device can be found in [52].

Figure 1. Schematic overview of the experimental setup, showing the APPJ and bubbler system for the admixing of water to the helium feed gas.
Download figure:
Standard image High-resolution imageHelium was fed through the quartz capillary at a mass flow rate of 1.0 SLM and the power absorbed by the plasma device monitored using an inline RF VI probe (Impedans Octiv Suite). The plasma was operated up to a maximum absorbed power of 1.9 W and assuming a cylindrical geometry, the volume was estimated from the length of the luminous region, from which the power density was estimated as ∼75 MW m−3. The visible bulk of the plasma was confined to the interelectrode region with the visible plasma plume extending a maximum of 3 mm beyond the electrodes. To guarantee remote operation, a plasma–liquid distance of >10 mm provides a sufficient safety margin and at an average gas velocity of >10m s−1, radical transport times are in the millisecond range. The water content of the plasma feed gas was controlled by mixing two flows; a dry helium flow (CP grade) controlled by one mass flow controller (MFC), and a humidified helium flow controlled by another MFC. The humidified helium was produced by passing dry helium through a water bubbler. Water content could then be regulated by varying the ratio of the dry to humidified helium flows while keeping the total flow at 1.0 SLM. Saturation of the humidified flow was not necessary as the water content was measured using a dew point meter (Xentaur LPDT) with an accuracy of ±3 °C, placed between the mixing point of the two flows and the entrance to the plasma.
H2O2 concentration was calculated from UV absorbance spectroscopy measurements of titanium (IV) oxysulphate (TiS) solution (Sigma Alrich 495 379). A deuterium lamp (Ocean Optics DH-2000-BAL) was used in combination with an Ocean Optics spectrometer (QE65 Pro). TiS was added to the sample cuvette at a concentration of 100 mM, which reacts with H2O2 to produce pertitanic acid with a characteristic absorbance at 407 nm. Absolute calibration was performed using the absorbance of several samples containing known H2O2 concentrations.  concentration was calculated from fluorescence emission spectroscopy measurements. Sample excitation and emission was measured using the same light source and spectrometer. Terephthalic acid (TA) (Sigma Aldrich 185361), was used at a concentration of 2 mM in 5 mM sodium hydroxide solution. TA reacts with
  to form 2-hydroxyterephthalic acid (HTA) which emits at 425 nm when excited with UV at 310 nm. While the rate constant for the addition of
  to TA is around 4.0 × 10⁹ M−1 s−1 [53], in O2 containing solutions subsequent reactions produce HTA with a 35% yield [54, 55].
  flux was therefore calculated by dividing the rate of HTA formation by 35% and the effective area of
  delivery to the sample, equal to the cross-sectional area of the capillary. Sample HTA concentration was calculated from calibration data obtained by plotting 2-hydroxyterephthalic (Sigma Aldrich, 752525) concentration against emission intensity. The TA reaction requires O2 which over time will be expelled from the liquid by the He gas flow. We observed a fall in O2 concentration in 5 ml liquid, subjected to 1 slm He flow, from 7 ppmv initially to 0.1 ppmv after 2 min. However, the plasma acts as a source of O2 and from the model we observe at 50 mm (figure 6(b)), our closest measurement distance, that the O2 flux is greater than that of
  . Since the reaction is catalytic, i.e. O2 is not consumed, sufficient replenishment is obtained from the plasma.
Liquid samples were contained in a quartz micro cuvette, held in place with an Ocean Optics CUV cuvette holder. This setup enabled in situ spectroscopy measurements to be taken during plasma treatment. The quartz capillary could be extended distances of 50–110 mm from the lower plasma electrode, and the micro cuvette located at a distance that positioned the exit of the quartz capillary 5 mm beneath the liquid sample surface. Sample volumes were restricted to 0.5 ml; larger volumes resulted in sample ejection from the cuvette during treatment, while smaller volumes failed to provide a bubble free region at the bottom of cuvette for consistent spectroscopy measurements. Because the outlet of the APPJ was positioned beneath the liquid surface with a continuous flow of helium escaping the cuvette, it is reasonable to assume that the plasma system does not contain any significant atmospheric contaminants. In previous surface treatment experiments, a combination of high  concentrations generated near the plasma–liquid interface and limited diffusion, meant absolute calculations of the amount of
  transferred from the plasma to the liquid were not possible [56]. Bubbling with the plasma effluent produces a homogeneous distribution of
  and HTA throughout the sample, enabling more accurate
  density calculations. Control measurements consisted of the sample being treated with helium only.
ZDPlasKin [57], a 0D chemical reaction kinetics solver, was used to model the plasma region and downstream species densities. The model used herein accounted for 58 species and 739 reactions that revolved around the He, H and O products produced in a typical He/H2O plasma. The relevant reactions were taken from a previous study by Aghaei and Bogaerts [58], however no N containing reactions were included since high purity He (99.999%) was used throughout, and the capillary outlet is submerged and isolated from air. Rate equations, if not constant, are calculated using electron/gas temperature dependent reaction rates from literature and are integrated in time using the built-in solver. Electron transport coefficients and the rate of electron impact reactions are calculated via Bolsig+, automatically called by ZDPlasKin. See Table 1 in supplementary data for the complete list of species and reactions used. Plasma geometry, gas pressure and gas temperature are taken from the experiment and provided as starting conditions. The species concentrations with distance downstream from the plasma i.e. the cathode electrode, is determined from the temporal evolution of the plasma chemistry, once the plasma (ions and electrons) is switched off. Using a constant gas velocity in the capillary, of 5.3 ms−1, we convert to a distance response. We define the time period from 0 to 5 × 10⁻⁴ s as the interelectrode plasma region (0–3 mm) and 5 × 10⁻⁴–2 × 10⁻² s as the downstream region of the ground electrode to the sample interface (3–110 mm). Two input parameters were changed in the model at 5 × 10⁻⁴ s. The plasma gas temperature, initially set at 320 K [59], was reduced to the ambient value of 295 K. The OH density at 50 mm is insensitive (<5% variation) to the downstream temperature between 295 K and 320 K. The plasma voltage was applied up to 5 × 10⁻⁴ s and then reduced to zero. The RF voltage magnitude was estimated from in-situ impedance measurements and associated circuit model. All reactions are included for both parts of the model, including electron impact ionisation and excitation reactions. The model outputs of particle density were converted to flux by considering gas velocity and capillary cross-sectional area.
3. Results
Plasma treatment was initially performed with a constant water vapour concentration of 600 ppmv with the liquid at a distance 50 mm from the ground electrode (Z = 50 mm). During helium treatment of the controls, HTA concentration increased by 24%, which coincided with a decrease in volume of ∼25%, irrespective of gas composition (helium or plasma effluent). Evaporation of the water solvent alone was therefore identified as the cause, and an evaporation correction factor was therefore applied to all concentration measurements. See supplementary data S1. The maximum treatment time was 10 min, to maintain the liquid surface level above the inserted capillary. At 50 mm from the plasma, H2O2 density is shown to increase linearly over 5 min, reaching a maximum density of 3.7 × 10²³ m−3 (610 µM) for a plasma power of 1.9 W (figure 2(a)). H2O2 flux, calculated from the rate of density increase in the cuvette (figure 2(a)) divided by the capillary cross-section area, also increases with plasma power (figure 2(b)) from the minimum absorbed power at 0.08 W to a maximum flux of 1.95 × 10²⁰ m−2s−1 at 1.9 W. At low powers H2O2 flux increases linearly but starts to saturate at powers higher than 0.54 W. This flux calculation assumes that all incident H2O2 transfers to the liquid due to the high Henry constant [60].
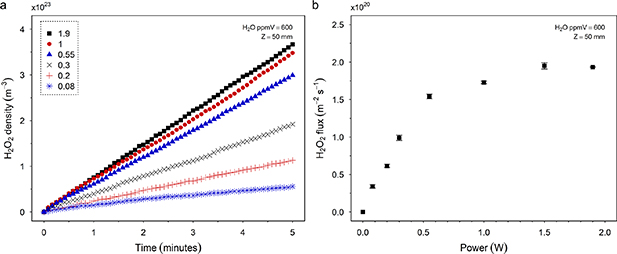
Figure 2. Concentration of H2O2 generated in water containing 100 mM titanium oxysulphate. The sample was located 50 mm downstream and treated using a plasma generated with helium containing H2O at 600 ppmv. H2O2 density was calculated in situ from the absorbance of pertitanic acid at 407 nm. (a) Density of H2O2 produced over time for a range of plasma powers. (b) Average H2O2 flux density produced over 5 min of plasma treatment for increasing plasma power.
Download figure:
Standard image High-resolution imageUsing a similar experimental setup as above, the density of HTA produced in a solution of terephthalic acid was measured over 5 min of plasma treatment (figure 3(a)). HTA density increases almost linearly for the first 3 min, after which the rate of HTA increase slows.  flux was calculated using the maximum rate of HTA formation (see methods), in this case over the first 2 min. The
  flux is shown figure 3(b) to increase linearly at low absorbed power but tend to saturate at powers >0.5 W. A maximum flux of 3.4 × 10¹⁹ m−2 s−1 is produced at an absorbed power of 1.9 W.

Figure 3.
 density measurements in water containing 2 mM terephthalic acid and 5 mM sodium hydroxide. Sample was located 50 mm downstream and treated using a plasma generated with helium containing H2O at 600 ppmv.
  density was calculated in situ from the fluorescence emission of HTA at 430 nm. (a) Sample
  density over time for various plasma powers. Density increased linearly for the first 3 min, after which the rate decreased. (b) Maximum
  flux delivered at the liquid interface over the first 2 min of plasma treatment for increasing plasma absorbed power.
Download figure:
Standard image High-resolution imageAdmixing H2O to the helium feed gas allowed a maximum plasma operating range up to 4500 ppmv H2O. The minimum achievable concentration was 7 ppmv in the complete system when operating with pure helium, while above 4500 ppmv H2O, the plasma became unstable and was extinguished. Keeping the applied power constant, the variation in plasma absorbed power for a given water concentration is shown in figure 4. The maximum absorbed power was 0.77 W at 15 ppmv H2O and decreases to ∼0.12 W by 4400 ppmv, 15% of the maximum.

Figure 4. Power absorbed by the plasma for varying water content of the helium feed gas. Water content was controlled by admixing a water saturated helium feed to a pure helium feed and measured using a dew point meter (Xentaur LPDT). Absorbed power was measured across all H2O concentrations using an Impedans Octiv Suite 2.0 VI probe, while operating at a constant input power. Horizontal and vertical error bars indicate manufacturers specified accuracy of the dew point meter and VI probe respectively.
Download figure:
Standard image High-resolution image
 flux measurements were repeated under the same conditions, at a fixed applied power of 70 W and the variation with H2O concentration is shown in figure 5(a). The initial flux at 7 ppmv of 1.6 × 10¹⁹m2 s−1 increases steeply, reaching a maximum flux of 2.4 × 10¹⁹m2 s−1 at 790 ppmv H2O. Above 790 ppmv, the
  flux decreases for increasing water content, and by 4400 ppmv H2O, reaches a flux similar to that at <10 ppmv. The model humidity was set at 600 ppmv and the excitation voltage increased to a value of 395 V (from 0 to 5 × 10⁻⁴ s) to normalise the density of
  calculated at 0.001 s (equivalent to 50 mm @ 5.3 m s−1) to that measured experimentally at 50 mm. Voltage was then kept constant while water content varied around 600 ppmv. The resulting model flux is plotted alongside the data in figure 5(a).
  flux was predicted to increase slightly as the water content decreased, resulting in a maximum at ∼200 ppmv as opposed to the measured maximum at 790 ppmv.
  flux decreased drastically <50 ppm, similar to the measured flux, however the model predicted a more abrupt decrease in
  at higher ppmv. Simulated flux decreased by an order of magnitude by 1700 ppmv, whereas the plasma was still able to deliver a meaningful
  flux up to at least 3300 ppmv. From the absorbed power characteristic, figure 4, the
  flux per watt absorbed power is plotted against H2O, figure 5(b), and shows a sub-linear relationship at high vapour content. The
  flux per watt absorbed appears to follow a near √ [H2O] relationship, with the maximum delivered at the maximum H2O concentration sustained by the plasma. A possible physical basis for this relationship is discussed later.
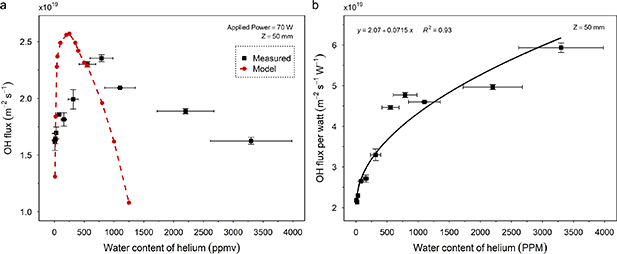
Figure 5. (a) Change in the  flux delivery for varying helium feed gas H2O concentration at 70 W applied plasma power. Also shown is the model's predicted variation in
  flux with changing H2O content. Both show an ideal water content for maximum
  delivery. (b)
  flux per watt, calculated by normalising the raw
  flux with the absorbed plasma power at each H2O concentration. The trendline indicates a possible
  flux per watt
 ![$\sqrt {\left[ {{{\text{H}}_2}{\text{O}}} \right]} {\text{ }}$](https://content.cld.iop.org/journals/0963-0252/32/1/015005/revision2/psstacb07fieqn70.gif) relationship.
relationship.
Download figure:
Standard image High-resolution imageSpecies flux at the liquid interface was measured for increasing distance from the plasma region, while operating at the maximum absorbed power of 1.9 W. Distance of sample from the plasma did not affect the absorbed power. The capillary exit was maintained below the sample surface at all distances to avoid ambient air ingress. Figure 6(a) shows measurements of  and H2O2 flux values at distances of 50, 70, 90 and 110 mm from the ground electrode. Keeping other parameters constant, the model's plasma region voltage was increased to best fit the fluxes measured at these distances. The model shows a fast decay in
  within 2 mm from the plasma edge which is followed by a slower exponential decay over larger distances, similar to that seen experimentally. Modelled H2O2 flux is lower than
  inside the plasma region, however, immediately increases outside the plasma and continues to rise slowly with distance.
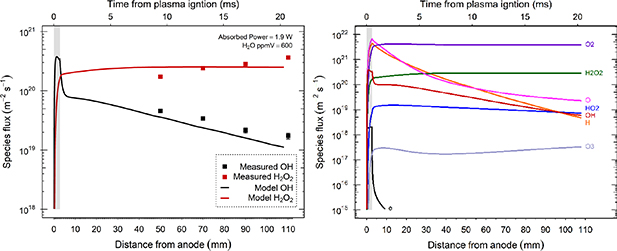
Figure 6. (a) Experimental and model results of  and H2O2 densities for increasing distance from the plasma at an initial 600 ppmv H2O content. Model simulates the flux from the start of the plasma region (0–3 mm, shaded region) up to a distance of 110 mm. Measurements were taken at 50, 70, 90 and 110 mm from the end of the plasma (ground electrode), with absorbed power kept constant at 1.9 W. Measurements were carried out in triplicate. (b) Flux rates of other reactive species present in the effluent under identical input parameters.
Download figure:
Standard image High-resolution imageCalibrating the model's flux rates of  and H2O2 against experiment enables us to predict the flux rates of other reactive species present in the effluent. Figure 6(b) shows that while the flux rates of H and O are much higher than
  and HO2 at a relatively short distance from the plasma, they also have a faster decay rate over these initial distances.
4. Discussion
Over the distance range 50 mm to 110 mm, set by experimental limitations, we observe a ∼60% fall in maximum  flux from 4.5 × 10¹⁹ m−2s−1 to 1.7 × 10¹⁹ m−2s−1. Using the model results, a value of 3.2 × 10²⁰ m−2s−1 is estimated at the plasma edge, equivalent to a density in the plasma of ∼6.1 × 10¹⁹ m−3. Since the Henry solubility constant for
  is low, 3.8 × 10⁻⁴ M Pa−1 [60], the liquid surface solubility limit is ∼20 µM for the equivalent partial pressure. We therefore need to determine if this limit impacts on
  measurements in the liquid. The time evolution of [
 ] in a shallow surface layer ΔX can be numerically simulated using a simplified flux—reaction model,
where Г is the  flux density, Sm
the reacting species and km
the associated rate constants. Considering only the
flux density, Sm
the reacting species and km
the associated rate constants. Considering only the  + TA (
 = 4 × 10⁹ M−1 s−1)[53] and
  +
+  reactions (
 = 4 × 10⁹ M−1 s−1), the surface
  concentration reaches a steady-state of ∼6 µM in less than 1 µs, assuming no surface depletion of the TA probe. The surface layer depth, estimated using the equation ΔX2 =
  ΔT, and a
  diffusion constant of 2.3 × 10⁻⁹ m2 s−1 [61], is 1.5 nm for ΔT of 1 ns. Under worst-case conditions of static unmixed fluid along with TA depletion, the Henry limit would be reached in ∼30 ms, with an ultimate steady state
  concentration of ∼100 µM. However, since the He gas is bubbled through the fluid, a well-mixed solution is obtained and the Henry limit is unlikely to affect
  transfer into solution. The Henry limit for H2O2 is approximately four orders of magnitude higher than that for
  .
.
Direct comparison with  production rates obtained from other
  generation sources is difficult. Generally, values of
  concentration in liquid are reported, representing the dynamic balance between generation and loss, whereas flux density values can represent an actual production rate of deliverable species, provided radical losses due to the chemical probe dominate all other reactions, i.e. by using a high reaction rate scavenger at high concentration. Terephthalic acid has a rate constant similar in magnitude to other possible
  reactions with trace species (
 , HO2, O2
−) and much higher than the
, HO2, O2
−) and much higher than the  +H2O2 (3 × 10⁷ M−1 s−1) reaction. Although the use of a scavenger to determine species concentration will also involve competing reactions, the scavenger concentration is typically much higher than that of any other relevant species. At a TA concentration of 2 mM, the assumption that the measured TA → HTA conversion represents substantially all
  reactions in liquid is reasonable. We can therefore convert our observed flux density values to concentration rates with a negligible loss of accuracy, 74 µM s−1 (50 mm) and 28 µM s−1 (110 mm), for comparison with the non-plasma-based literature. These rates assume flux scales with area, e.g. using extended plasma arrays (the rate would be 0.23 nmol s−1 for a plasma jet). In gamma radiolysis, typical dose rates are 10−3–10−2 Gy s−1 [62] and for low LET radiation, the
  G-value is 2.8 at room temperature, equivalent to a production rate of 0.001–0.030 µM s−1, while with x-ray radiolysis, production levels of 0.3 µM s−1 have been reported [63]. In AOPs with UV excitation, direct measurements of rates [64, 65] or of
  concentrations [66, 67] indicate rates up to ∼0.01 µM s−1 whereas with VUV excitation of the gas phase, 70 µM s−1 has been demonstrated [68].
  generation via the traditional Fenton, or Fenton-like reactions, can be enhanced using an external electric field [69] and/or heterogeneous catalysts to deliver rates in the range 0.1–1.0 µM s−1 [70, 71], while the addition of high concentrations of H2O2 further increases the rate to 1–10 µM s−1 [72, 73].
For comparison with similar remote RF plasma sources, measured  densities (m−3) in the gas phase are often the preferred metric. Gas phase density can be converted to flux density for comparison where gas flow and velocity values are given. Maximum reported flux densities are in the range 2 × 10¹⁹–2 × 10²¹ m−2 s−1, with the variability due mainly to the H2O content, which ranged from 500 ppmv to 11 000 ppmv, and the background gas into which the plasma flows (air or inert) [22, 43, 44, 74–76]. The H2O to
  conversion efficiency (NOH/NH2O) i.e. the number of
  generated per H2O molecule varies from approximately 1% to 0.1%, decreasing with increasing water content. These high flux density values represent conditions measured within the plasma region. However, Schroter et al [22] observe a 75% reduction in flux for a gap of 5 mm, with the He plasma effluent isolated from air, while Benedikt et al also reports a fall of ∼80% over 20 mm [26]. For argon flowing into an air gap, Li et al observed ∼90% fall over 12 mm [34]. The measurements shown in figure 6(a), for distances up to 110 mm, represent the first such far effluent measurements of
  and show that while a sharp reduction in flux density is likely over the initial 5 mm, thereafter the reduction is much more gradual. Overall, the final flux at 110 mm is ∼5% of the mean value at zero gap and by comparison, the remote RF plasma demonstrates a performance capability well above that of other, non-plasma
  generation sources, while avoiding the complex additional interactions and species associated with directly coupled plasmas.
We also compared the remote RF  flux densities with those for direct contact or directly coupled plasma sources and configurations. Measurements are either obtained from gas phase, as with the RF plasmas above, or using chemical probes in liquid. In the latter case, for many reported
  measurements, only the steady-state
  concentration is given, and the information regarding the time to reach steady-state is absent. Low frequency-driven (kHz) plasmas often display a long luminous jet plume due to the propagation of ionisation waves, which maintain the plasma a significant distance beyond the plasma electrodes [77]. Gas phase flux densities are reported in the range 5 × 10²⁰–1022 m−2s−1, close to the plasma (<4 mm) and within the plume [33, 78, 79]. Here the plasmas were driven via pin/needle electrodes and electrically coupled to the liquid, while Yonnemori et al, report a lower value of 2 × 10²⁰ m−2s−1 for insulated DBD electrodes [80]. Verreyken et al report a factor of 10 reduction in flux when the gap is increased by 7 mm.
From liquid concentration rates and plasma geometry, we extracted equivalent flux densities. For example, Gorbanev et al [49] used a parallel field 4 mm diameter plasma jet (18 kV, 25 kHz), with various He–O2 (0%–0.5%)–H2O (0%–4%) gas mixtures at 4–10 mm from liquid. The liquid remained in contact with the plasma plume and the background environmental gas was He. The maximum  concentration was 24 µM (>2000 ppmv H2O, 0% O2), equivalent to a
  delivery rate of 0.4 µM s−1. The
  concentration was measured by electron paramagnetic resonance (EPR), using 5,5-dimethyl-1-pyrroline N-oxide (DMPO-OH) (100 mM) and, with a liquid sample volume of 100 µL the equivalent
  flux density is 1.9 × 10¹⁸ m−2s−1. Including 0.2% O2 with He instead of H2O reduces the flux by >0%, while a further 30% reduction is observed for the oxygen−water mixture He–O2 (0.2%)–H2O (>2000 ppmv). Additional
  formation due to plasma-induced UV-photolysis directly in liquid was found to be negligible. UV-photolysis rates of ∼ 1 pM s−1 have also been reported for a similar plasma (1 kV, 35 kHz) with argon [31]. Chauvin et al (10 kV, 10 kHz) report a rate of 0.4 µM s−1 and a slightly lower equivalent
  flux density, 2 × 10¹⁸ m−2s−1 [81]. In this case, the liquid was placed near the limit of the plume and the background gas constituents were He/air (∼80:20). Uchiyama et al (18 kV, 20 kHz) obtained 4 × 10¹⁹ m−2s−1 for Ar/air near the edge of the plume but this reduced by an order of magnitude with an additional gap of 10 mm outside the plume [63]. These devices utilised isolated DBD electrode configurations while the electrically coupled pin/needle configuration produced a higher flux density, 1 × 10²⁰ m−2s−1 [82]. With larger scale (DBD, streamer or spark) water treatment reactors, typical rates are ⩽0.05 µM s−1, although Kovačević et al using O2 gas, and a continuous flow water electrode demonstrated maximum
  production rates of 12 µM s−1 [83–87]. The fact that
  production rates for the remote non-coupled He–H2O device are similar or higher than directly coupled in-contact plasmas is somewhat surprising since, in the latter, radical generation is expected to be continuous over the whole path from plasma to target. One likely reason is the inevitable presence of air in directly coupled configurations leading to the high-rate production of other radicals (e.g.
  ,
,  , NO2
−) which act as
, NO2
−) which act as  scavengers in the gas and liquid phases [82]. Even without air, the presence of high
  radical concentrations will efficiently recombine with
  at the liquid surface [32].
The  radical can be formed by electron impact ionisation, excitation, or attachment of water as well as through metastable—neutral reactions, ion molecule/cluster reactions, ion-ion recombination, and Penning ionisation [25]. At lower water concentration, metastable reactions can be important with electron impact dissociation and dissociative electron detachment becoming dominant at ∼3000 ppmv [33, 34]. Assuming a simple loss model with equal
  and
and  recombination rates, the
  density is expected to follow the density of H2O via a NH2O
0.5 relationship, as observed by Bruggeman et al up to ∼1% H2O [44], although other reports show
density is expected to follow the density of H2O via a NH2O
0.5 relationship, as observed by Bruggeman et al up to ∼1% H2O [44], although other reports show  following a linear relationship with NH2O up to ∼5000 ppmv before saturating [26, 33]. Above 6000 ppmv, the
  density saturates at 2–4 × 10²⁰ m−3 [26, 33, 44]. These values are similar to the estimated plasma
  in this work of 5 × 10²⁰ m−3 at 600 ppmv H2O. Regarding peroxide, a linear H2O2–H2O relationship has been observed [43, 47, 48]. There are, however, discrepancies in reported concentrations between different measurement techniques [26, 43]. For example,
  density values of 1.5 × 10²⁰ m−3 have been reported from cavity ring down spectroscopy and UV absorption, but ∼6 × 10¹⁹ m−3 from mass spectroscopy at 2000 ppmv. Discrepancies will also reflect the differences in measurement principle that is potentially amplified with instrument location with respect to the plasma source. For example, LIF measurements of
  at increasing distances from the plasma report increasing discrepancy with those from absorption measurements at the same location, the latter showing almost constant [
 ] with distance up to 9 mm, while LIF indicates an almost one order of magnitude fall [33]. However, absorption measurements are line integrated therefore less affected by increasing radial diffusion with distance, hence will more reliably capture the total
  flux.
flux.
The results show that feed gas humidity plays a fundamental role in the characteristics of the plasma jet used in these experiments. Power absorbed, along with  and H2O2 radical production are all shown to be sensitive to the water precursor content.
  production pathways depend on plasma conditions and include via electron dissociation of water or water dissociation products (HO2, H2O2). Other pathways include He metastable interaction with H2O and H2O clusters and excited oxygen or He ion interactions with H2O [22, 76, 88, 89]. The model of Schroter et al [22] of an RF jet indicates electron dissociation of water is dominant at the initial stages of the plasma i.e.


whereas at later stages, within plasma or afterglow reactions such as H + HO2 → 2 and H + H2O2 →
  + H2O can become important. Brisset et al [76] with a similar jet and simulation model noted the reaction H2O+ + H2O →
  + H3O+ was a significant source of
  well within the plasma. By comparison, the plasma device used here is ⩽3 mm in length, equivalent to the initial stages of [22] where reaction R1 is dominant. It is expected therefore that the
  density is largely dependent on a variation in both water content and electron density, which in turn is dependent on power. As previously shown in He–O2 plasmas, an increase in molecular dissociation with absorbed power is a result of a linear increase in electron density with power [38] and a similar trend is therefore also expected for He–H2O. However, above 0.5 W the increase in
  is sub-linear (figure 3(b)), a trend also observed with H2O2. Since the primary source of H2O2 is via the recombination of
  ,
,

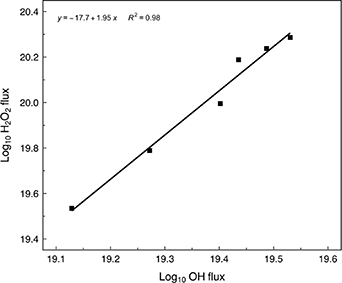
We expect H2O2 flux to depend on [ ]2 and a log plot of H2O2 versus
  indicates a gradient of 1.95, (figure 7). At powers above 0.5 W, at fixed H2O concentrations, both
  and H2O2 flux tend to saturate at values of 3.5 × 10¹⁹ s−1 and 1.9 × 10²⁰s−1 respectively. Since a change in the
  production mechanism is not expected at enhanced electron densities i.e. R1 still holds, the saturation indicates increasing losses, which are consistent with R2.
Figure 7. Log ( ) vs log (H2O2) fluxes under identical operating conditions indicating a gradient of 1.95 close to the expected [H2O2] dependence on [OH]2.
Download figure:
Standard image High-resolution image
At fixed applied power with increasing H2O up to ∼800 ppm, (figure 5(a)) the linear increase in  flux is consistent with R1. The significant decrease in absorbed power with H2O beyond 800 ppmv (figure 4) is likely the main factor leading to the rapid fall in
  flux (figure 5(a)), despite the enhanced precursor concentration at high H2O. For a constant applied power, a reduction in absorbed power with increased H2O has also been directly observed or inferred by others [26, 33]. At low H2O concentrations (<100 ppmv), the plasma remains electropositive and helium ion species dominate. However as NH2O increases, the plasma becomes more electronegative and the dominant ion species are impurity generated (OH+, H2O+, H3O+, H+(H2O)n
ion clusters). At >3000 ppmv, negative ion species, (OH–H2O)n n = 1–3), become dominant [39]. These are formed by dissociative electron attachment to H2O and subsequent hydration are a significant source of electron loss and a decrease in absorbed power. Also at high water content, an increasing proportion of energy losses into rotational and vibrational excitation and a different electron energy distribution function reduce the rate of dissociation and lead to saturation in
flux (figure 5(a)), despite the enhanced precursor concentration at high H2O. For a constant applied power, a reduction in absorbed power with increased H2O has also been directly observed or inferred by others [26, 33]. At low H2O concentrations (<100 ppmv), the plasma remains electropositive and helium ion species dominate. However as NH2O increases, the plasma becomes more electronegative and the dominant ion species are impurity generated (OH+, H2O+, H3O+, H+(H2O)n
ion clusters). At >3000 ppmv, negative ion species, (OH–H2O)n n = 1–3), become dominant [39]. These are formed by dissociative electron attachment to H2O and subsequent hydration are a significant source of electron loss and a decrease in absorbed power. Also at high water content, an increasing proportion of energy losses into rotational and vibrational excitation and a different electron energy distribution function reduce the rate of dissociation and lead to saturation in  generation. However, from the normalised plot of flux per watt absorbed (figure 5(b)), the approximate square root relationship indicates that power reduction is not the only factor. This saturation with H2O was also observed by [26] who noted an increase in the O/
 ratio with increasing H2O, the atomic oxygen derived from either
  dissociation or recombination. It was suggested therefore that the reaction
  + O → O2 + H provides an increasing significant loss channel at higher H2O concentrations. However, plasma effluent chemistry may be significantly different from that in the near plasma region as short-lived and charged species recombine rapidly at the plasma edge and long-range transport is dominated by more stable neutral species such as HO2 and H2O2. Simulations [22] in the near-plasma afterglow region indicate the main consumption pathway of
  is via its reaction with H2O2,

It is therefore more likely that the higher densities of H2O2 produced at higher powers are the primary loss channel for  radicals over the 50 mm path length from plasma to collection liquid. The main H2O2 generation mechanism in the gas phase is via
  three-body recombination, R2 (
 +
+  + M → H2O2 + M) [47].
Combining the generation and loss reactions from R1 and R2 we can estimate the steady state  concentration as,
where k1 and k2 are the rate constants for R1 and R2 respectively, and the slope k*, can be obtained from figure 5(b), for 50 mm distance. To obtain the equivalent slope in the plasma region, the flux density at the plasma edge is taken from figure 6(a), and the ratio of fluxes at 0 mm and 50 mm is used as a scaling factor, leading to a value of k* (0 mm) of 2.7 × 10¹⁸ m−3/2. See supplementary data S2. After compensating for a difference in power densities, comparison with a similar characteristic by Bruggeman et al, gives a k* value ratio equal to ∼0.5 [44], which is commensurate with the difference in electron density between the two systems [44].
The model simulation proved reliable in predicting the  flux characteristics of the plasma effluent. A maximum flux delivery was predicted at ∼200 ppmv, similar to that seen experimentally at 790 ppmv. While previous studies have shown that
  density in the plasma region continues to increase with humidity [26, 33, 44], the data here shows that trends in plasma density are not necessarily an indication of trends in the effluent. The model proved accurate at predicting both the OH· and H2O2 fluxes over extended distances. This enabled the flux of other reactive species in the effluent to be estimated with reasonable reliability. As evidenced by the model, while high flux delivery of H2O2 up to 110 mm was expected due to its long lifetime, the effluent also delivers multiple highly reactive species, such as
  , H and O over long distances.
5. Conclusions
We have demonstrated a new gas-based  generation source using a low power RF-driven atmospheric pressure plasma configured to deliver the radical flux into the far effluent region, well away from interference from other plasma factors such as electric fields, currents and UV radiation. Using He–H2O gas chemistry isolated from the laboratory air, the effluent flux contains H2O2 and
  with measured flux values of 2.3 nmol s−1 and 0.23 nmol s−1 respectively at a distance of 50 mm from the plasma. The
  flux density was 4.5 × 10¹⁹ m−2s−1 falling to 1.7 × 10¹⁹ m−2s−1 at 110 mm, equivalent to generation rates of 74 µM s−1 and 28 µM s−1. The simulation results show that in addition to OH, the reactive species O, HO2 and H
 , are also delivered with similar flux densities at 110 mm. Millimetre scale RF-driven plasmas are an ideal configuration for remote delivery of selected species as the plasma itself is restricted to mainly within the electrode region, rather than extending well beyond the electrodes in a long jet, as found with lower frequency plasma configurations. It is well known that short-lived radicals suffer very high recombination rates within a few millimetres of the RF plasma exit. Despite this, the escaping flux is still significant, indicating a viable delivery capability to downstream targets. Its performance with regard to
  generation rates compares well with traditional
  generation techniques such as radiolysis, AOPs and enhanced Fenton-chemistry approaches where rates are sub µM s−1 and the potential therefore exists for a large enhancement of
  supply using RF plasma arrays. Alternatively, the use of single plasma devices delivering precisely quantifiable
  fluxes provides new opportunities for scientific studies in cell biology, atmospheric chemistry, protein unfolding and systematic dose studies for plasma-based and other
  related medical treatments. The potential also exists for
  and other radical transport over longer distances in fixed or flexible tubing, opening the possibility for direct in-vivo studies leading to new radical-based treatments and tumour therapies.
Acknowledgments
This work was supported by Engineering and Physical Sciences Research Council (Project Nos. EP/K006088/1, EP/K006142/1, EP/K022237/1, EP/R008841/1, EP/T016000/1) and EU COST Actions PlAgri (CA19110) and PlasTHER (CA20114).
Data availability statement
The data that support the findings of this study are available upon reasonable request from the authors.
Supplementary data (0.5 MB PDF)