

Abstract
Hydrogen (H) atom kinetics has been investigated in capacitively coupled very high frequency (VHF) discharges at powers of 16–780 mW cm–2 and H2 gas pressures of 0.1–2 Torr. The H atom density has been measured using vacuum ultra violet absorption spectroscopy (VUVAS) with a micro-discharge hollow cathode lamp as a VUV light source. The measurements have been performed in two different electrode configurations of discharges: conventional parallel-plate diode and triode with an intermediate mesh electrode. We find that in the triode configuration, the H atom density is strongly reduced across the mesh electrode. The H atom density varies from ∼1012 cm−3 to ∼1010 cm−3 by crossing the mesh with 0.2 mm in thickness and 36% in aperture ratio. The fluid model simulations for VHF discharge plasmas have been performed to study the H atom generation, diffusion and recombination kinetics. The simulations suggest that H atoms are generated in the bulk plasma, by the electron impact dissociation (e + H2  e + 2H) and the ion–molecule reaction (H2+ + H2
 + H). The diffusion of H atoms is strongly limited by a mesh electrode, and thus the mesh geometry influences the spatial distribution of the H atoms. The loss of H atoms is dominated by the surface recombination.
Export citation and abstract BibTeX RIS
1. Introduction
A hydrogen (H) atom is a chemically active species (radical), which reacts with other gas-phase species and various material surface [1, 2]. So, its reaction kinetics [3] often plays important roles in plasma processing for material synthesis [4], etching [5] and surface treatment [6–11]. For example, in a H2 diluted silane (SiH4) plasma for thin-film silicon growth, gas-phase reactions of H atoms influence the precursor species (SiHn) [1] and the gas composition [2, 12, 13]. The surface reactions of H atoms, including dangling bond termination [14, 15], weak bond etching [16, 17], and hydrogenation [18], all impact growth kinetics which may affect the film microstructure such as H-bonding configurations [19] and amorphous/crystalline morphology [20–23]. Thus, the H atom is a key species in processing plasmas so that characterizations of its density and flux are beneficial for further development of the plasma processing technology.
The H atoms can be detected in low-pressure processing plasmas, by means of two-photon absorption laser induced fluorescence (TALIF) [24–27] and vacuum ultra violet absorption spectroscopy (VUVAS) [28–31]. Thanks to these techniques, the H atom density is determined over a wider range of 1011–13 cm−3 for those processing plasmas [24–31]. Although the H atom density strongly depends on the discharge type and conditions, it has a general tendency to increase with the discharge power (i.e. the plasma density) and gas pressure. As for the H atom kinetics, it has been studied in terms of gas-phase diffusion and surface recombination. The diffusion phenomena are studied by the time decay measurements of the H atom density in H2 plasma afterglow. The diffusion time is found to be of the order of 1 ms at H2 gas pressures of 1.33–26.6 Pa and the geometrical diffusion length of ≈ 6.3 cm [29, 30]. For the loss of H atoms, it is dominated by the surface recombination that depends on the surface material [29–31].
So far, such H atom kinetics has been studied in processing plasmas in 'direct' plasma configurations, where processing materials (objects) are exposed to the discharge plasma. On the other hand, its kinetics is not studied in 'remote' plasma configurations, in which processing materials (objects) are separated from the discharge plasma, typically by obstacles such as a metal mesh. This type of remote configuration is known to yield advantages of less ion bombardment and reduced surface charging. Therefore, it is often used for high-quality material growth [32, 33] and gentle surface treatment such as silicon surface passivation [7] and wafer cleaning [6].
In this paper, we study H atom kinetics in capacitively coupled very high frequency (VHF) discharges in a remote configuration (triode with a mesh) in addition to in direct configuration (conventional diode). The H atom density is experimentally determined from VUVAS, using a micro-discharge hollow cathode lamp (MHCL) as a VUV light source. The fluid model simulations of VHF discharges are performed to study the H atom kinetics to compare the simulations to the experimental results; the generation, diffusion and recombination kinetics are also discussed.
2. Experimental
2.1. Electrode setup and discharge conditions
We performed experiments in capacitively-coupled 60 MHz VHF discharges in direct and remote configurations. Figure 1 shows the electrode setups for discharges. Here, the y and z axes are defined as follows: the y-axis is parallel to the electrode plate, the z-axis is parallel to the discharge axis, and z = 0 at the VHF powered (PWD) electrode surface. The setup was located at the center of a vacuum vessel with 330 mm wide, 310 mm depth and 230 mm height. The PWD and electrically grounded (GND) electrodes were separated by a distance of 15 mm for the direct configuration and 30 mm for the remote configuration. The diameter of these electrodes were 128 mm. The GND electrode was heated at 473 K to follow the experimental conditions of H2 plasma treatment for solar cell applications [34–36]. The other electrodes and chamber wall were kept at room temperature.
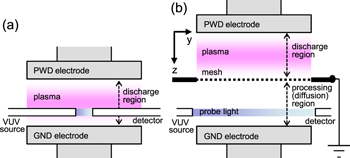
Figure 1. Schematic view of capacitively coupled VHF discharges in two different electrode setup: (a) direct plasma configuration, i.e., conventional parallel plate diode and (b) remote plasma configuration, i.e., triode with an intermediate mesh electrode. A hydrogen plasma is generated between the PWD and mesh/GND electrodes. The H atom density is measured at 5 mm above the GND electrode, by means of VUVAS.
Download figure:
Standard image High-resolution imageIn the remote configuration, a 0.2 mm-thick mesh electrode was placed between the PWD and GND electrodes to separate the processing region from the discharge. The height of the mesh was set at z = 15 mm to match the PWD-mesh electrode distance to the gap spacing in the direct configuration. The geometry of the mesh used in the experiments was a square array of 0.3 × 0.3 mm square holes with an interval of 0.5 mm. The aperture ratio was 36%. The mesh was electrically grounded.
In both configurations, a H2 plasma was generated by applying the VHF power to the PWD electrode at a pressure of p = 0.1–2 Torr. A H2 gas was introduced into the discharge from the PWD electrode showerhead at a rate of 25.4 sccm. We adjusted the VHF power in a range of  = 2–100 W (16–780 mW cm−2) by changing the VHF voltage, Vpp = 30–250 V. In the remote configuration, the plasma was generated between the PWD and mesh electrodes, i.e. in the discharge region defined by z = 0–15 mm, and diffused into the processing region (diffusion region) defined by z = 15–30 mm.
All the electrodes and vessels were made of stainless-steel. The electrode surfaces were covered with hydrogenated microcrystalline silicon (μc-Si:H) since the setup was used for growth of this material for solar cell applications. The deposition of μc-Si:H may affect the surface recombination process of H atoms. The surface recombination will be discussed later.
2.2. VUVAS and OES measurements
The H atom density,  , was determined from VUVAS, using a MHCL operated in a He diluted H2 gas as a VUV light source [28, 29]. The emission line of Lyman α (L
 ) at
) at  = 121.6 nm was selected for as the probe light. The probe light from MHCL was collimated by a MgF2 lens, and passed through the discharge or processing region (5 mm above GND electrode, as shown in figure 1). The transmitted probe light was then focused on the slit of VUV monochromator, and detected with a photomultiplier (Hamamatsu photonics, R8487). With this monochromator of a 4968 lines/mm grating and a 0.1 mm slit, the resolution was obtained to be <0.4 nm. The absorption length, L, was adjusted to obtain a proper signal by replacing the probe tubes: L = 20 mm in the direct and L = 128 mm in the remote configuration.
In addition to VUVAS, the optical emission spectroscopy (OES) was performed at the center of the discharge region. We measured the emission intensity of Balmer α ( ) at 656.3 nm for monitoring the H atom generation. Because
  is known to strongly depend on the electron energy distribution and collisional quenching, this monitoring technique is often limited to use in discharge plasmas operated at a constant-p condition where the electron temperature is regarded as nearly constant [37].
2.3. Determination of H atom density by VUVAS
The absorbtion of the probe light, A, by H atoms is given by a reduction of the probe light intensity.

where Ip is the probe light intensity under the discharge and I0 is the controlled signal, i.e. the probe light intensity without the discharge. Taking into account the emission and absorption line profiles,  and
and  , A can be expressed as follows [28].

where k0 is the absorption coefficient. In this study,  is assumed to be a Voigt profile, which results from the convolution of a Gaussian profile (due to the Doppler broadening) and a Lorentzian profile (reflecting the collisional broadening at high-p in MHCL in our case). The Voigt profile,
  , is expressed as follows [38].


where  ,
,  , and
, and  are the line center frequency, the Lorentz width (in the full width at half maximum, FWHM), and Doppler width (in FWHM), respectively. Here, the doppler width was assumed to be at room temperature. The ratio of broadening was set at
  = 2 since our MHCL operation was very similar to that reported in [28]. As for
  , we assumed a Gaussian profile at room temperature since the H atoms are supposed to be in thermal equilibrium with surrounding H2 molecules supplied from the room temperature showerhead.
By equating equations (1) and (2), k0 is obtained. With this k0 and Einstein Aul coefficient,  is given by [28]

where c,  , gl and gu are the speed of light, the center frequency of transition, the statistical weights of the lower and upper level, respectively. For
  , gl = 2, gu = 8, and
  s−1 [39].
3. Experimental results
Here, we show the experimentally determined  in VHF H2 discharges for both the direct and remote configurations. As shown in figure 2,
  is of the order of 1012 cm−3 for the discharge region in the direct configuration, whereas it is of the order of 1010 cm−3 for the processing region in the remote configuration. Thus, we find that
  is strongly reduced across the mesh in the remote configuration. For our mesh geometry described above,
  is lowered by two orders of magnitude.

Figure 2. Experimentally determined H atom density,  , and Balmer α intensity,
  , in VHF H2 discharges for direct and remote configurations. (a)
  as a function of the discharge power,
  , at a pressure of p = 0.3 Torr. Three dotted lines denote the power-law fits of
  . The data obtained from simulations are shown by open symbols at corresponding
  . (b)
. (b)  versus the pressure, p, at
  = 7 W. The dotted line for
  in the discharge region (direct configuration) denotes a linear fit:
  . The dashed lines are visual guides. Simulation data (Vpp = 75 V and r = 0.2) are shown by open symbols.
Download figure:
Standard image High-resolution imageThe H atom density is highly dependent on the discharge conditions. Figure 2(a) shows a  -dependence of
  and
and  at p = 0.3 Torr. As apparent,
  and
and  are increased monotonically with
  . By looking carefully the data, we notice that the increasing rates of
  and
and  on
on  are nearly the same, indicated by the dotted lines in the figure. To clearly show the correlation between
  versus
  , the data are replotted in figure 3(a). As shown,
  is nearly proportional to
  , suggesting that
  is simply correlated to the generation of H atoms. Aside from this, we see a correlation of
  between the discharge and processing regions. As shown in figure 3(b),
  in the processing region has a tendency to increase linearly with
  in the discharge region.
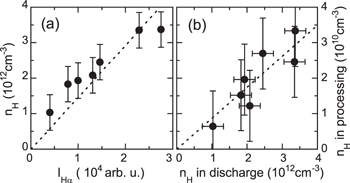
Figure 3. (a)  versus
  in the discharge region. A dashed line denotes a linear relation between
  and
and  . (b) Correlation of
  between the discharge and processing regions. The dashed line is a linear fit. Data shown in both figures are prepared by replotting the data in figure 2(a).
Download figure:
Standard image High-resolution imageFigure 2(b) shows a p-dependence of  at
at  = 7 W. Interestingly,
  in the discharge region increases linearly with p, whereas
  in the processing region remains roughly constant (particularly in the range of
  Torr). This suggests that at high p, H atom generation is high and/or the H atom diffusion toward the processing region is limited. The generation and diffusion kinetics will be discussed, based on the simulation results in section 5.
As described above,  is roughly proportional to
  (figure 3(a)) so that
  is a good measure of
  at the condition of p constant. However, such a nice correlation is not observed while changing p. As shown in figure 2(b),
  decreases monotonically with p, because the electron temperature decreases with p [37].
4. Simulation model and conditions
We carried out the fluid model simulations of VHF H2 discharges in the remote configuration, using software by PEGASUS S/W Inc. The following charged species were included: electron (e), H+,  ,
,  , and H−. A set of Poisson's equation, continuity equations, momentum equations and energy conservation equations were numerically solved. For the momentum equations, the drift-diffusion model was assumed, and thereby each particle flux was described by
  . Here, nα,
  ,
,  , and Dα, are the particle density, the mobility, the electric field and the diffusion coefficient, respectively. The space potential was computed from Poisson's equation, and the density of each charged species was calculated from the continuity equation. The electron temperature, Te, was obtained from the energy conservation equation, by assuming the electron energy distribution function (EEDF) as Maxwellian,
  . In low-temperature molecular plasmas, the EEDF can be different from Maxwellian due to inelastic collisions of electrons with molecules. So far, EEDF has been measured [40], and origins of the non-Maxwellian distribution have been discussed [40, 41]. In this study, the EEDF was not measured experimentally, and thus we assumed EEDF to be as commonly used as Maxwellian. Nevertheless, this assumption yields relatively good agreements between the simulation and experiment results, particulary on plasma parameters and H atom densities (this will be confirmed in the following sections, particularly sections 5.1 and 5.3). For ion species and H2 molecules, their temperatures were fixed at room temperature.
The gas-phase reactions involved in the simulations are listed in table 1. The electron impact ionization, dissociation, and excitation as well as elastic collision of electron to H2 were included. Besides, two important processes of the ion–molecule reaction and electron attachment on a H atom were took into account. The electron–ion and ion–ion recombination process are also considered. The H atom recombination (H + H  H2) in gas phase is not included because its rate constant is negligibly small, compared with other rate constants. In the simulation, each reaction rate constant was calculated by
  , where me is the electron mass. Thus, the rate constant was not fixed, dependent on Te. Table 1 also shows either the cross-section maximum, σ, or the rate constant, k, to distinguish the predominant reaction paths.
Table 1. Gas phase reactions included in simulations. The cross-section maximum, σ, at the corresponding electron energy or the rate constant, k, are also shown.
| No | Reaction type | Equation | σ or k | Reference |
|---|---|---|---|---|
| 1 | Elastic scattering | e + H2  e + H2 e + H2 |
 cm−2 ( cm−2 ( eV) eV) |
[3] |
| 2 | Rotational excitation | e + H2  e + e + 
|
 cm−2 ( cm−2 ( eV) eV) |
|
| 3 | Rotational excitation | e + H2  e + e + 
|
 cm−2 ( cm−2 ( eV) eV) |
|
| 4 | Vibrational excitation | e + H2  e + e + 
|
 cm−2 ( cm−2 ( eV) eV) |
|
| 5 | Dissociation | e + H2  e + 2H e + 2H |
 cm−2 ( cm−2 ( eV) eV) |
[42] |
| 6 | Ionization | e + H  2e + H+ 2e + H+ |
 cm−2 ( cm−2 ( eV) eV) |
|
| 7 | Ionization | e + H2 2e + 2e + 
|
 cm−2 ( cm−2 ( eV) eV) |
[3] |
| 8 | Dissociative ionization | e + H2  2e + H+ + H 2e + H+ + H |
 cm−2 ( cm−2 ( eV) eV) |
|
| 9 | Ion–molecule reaction |
 + H2 + H2  +H +H |
 cm3 s−1 cm3 s−1 |
[43] |
| 10 | Electron attachment | e + H  H− H− |
 cm3 s−1 cm3 s−1 |
[1] |
| 11 | Electron–ion recombination | e +  H2 + H H2 + H |
 cm3 s−1 cm3 s−1 |
[44] |
| 12 | Positive-negative ion recombination | H− +  H2 + 2H H2 + 2H |
 cm3 s−1 cm3 s−1 |
[44] |
The surface reactions on the electrodes were treated as follows. The positive and negative ions were neutralized and desorbed as H2 molecules,

where i is 1, 2 or 3 for the positive ion species (H+,  ,
,  ) and i = 1 for negative ion (H−). For the H atoms, they were assumed to be reflected at the probability, r, or adsorbed on the surface to form H2 molecules. The reaction channel is expressed as

These surface reactions were included as boundary conditions on the electrode surface.
The simulation was performed in two-dimensional (2D) space, 1.66 mm along the y-axis and 30 mm along the z-axis, as shown in figure 4. The PWD, mesh and GND electrodes were located at z = 0 mm, 15 mm, and 30 mm, respectively. The simulation space contained two unit cells of the mesh structure. The interval of mesh holes was set at 0.83 mm to match the aperture ratio used in the experiments. At the edge of simulation space of y = 0 mm and 1.66 mm, the symmetric boundary condition was imposed in order to reflect the periodic structure of the mesh.
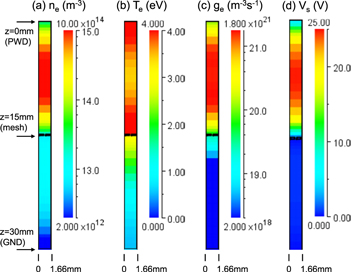
Figure 4. Contour plots of the plasma parameters obtained from the fluid simulations for capacitively coupled VHF hydrogen discharges in remote configuration. (a) Electron density, ne, (b) electron temperature, Te, (c) electron generation rate, ge, and (d) space potential, Vs. The PWD, mesh and GND electrodes are located at z = 0 mm, 15 mm, and 30 mm, respectively. Two unit cells of the mesh electrode is shown.
Download figure:
Standard image High-resolution imageAs for the time step in the simulation, we set two different numbers: 0.5 ps for charged species and 2 ns for neutral species. The simulation was continued until it reached nearly in steady state; it takes typically  steps, corresponding to ∼1 ms in actual discharge time under the assumption of appropriate initial conditions. The results shown in the next section are in the steady state. The adjustable parameters in the simulations are Vpp, p, r and the mesh geometry. The standard values for these are listed in table 2. Each parameter was independently varied to study the H atom kinetics.
Table 2. The adjustable parameters in the simulations. The standard discharge conditions and mesh geometry are listed.
| Parameter | |
|---|---|
| Vpp | 50 V |
| p | 0.3 Torr |
| r | 0.0 |
| mesh hole diameter | 0.3 mm |
| mesh thickness | 0.2 mm |
| mesh-GND distance | 15 mm |
5. Simulation results and discussion
In this section, we show the simulation results on the plasma parameters, the ion species, and the H atom density in VHF discharge plasmas. The plasma generation, gas phase reactions and H atom kinetics are discussed.
5.1. Plasma parameters
Figure 4 shows the contour plots of the plasma parameters (the electron density, ne, Te, the electron generation rate, ge, and the space potential, Vs). As expected, ne is broadly peaked at the middle of the discharge region ( mm in figure 4(a)) since electrons are confined by the sheath potential formed in front of the VHF and mesh electrodes (figure 4(d)). The ionization region, i.e., the plasma generation, due to the electron impact ionization, distributed over the bulk plasma (z ∼ 5–10 mm in figure 4(c)). The electron temperature, Te, is relatively high in the plasma sheath region (figure 4(b)). The simulation gives plasma parameters in the bulk plasma of the discharge region as follows;
  cm−3,
cm−3,  eV, and
  (i.e.,
  ) for 60 MHz discharge operated at p = 0.3 Torr and Vpp = 50 V. These plasma parameters are in good agreement with those measured in a similar setup and discharge conditions [37]. Thus, the VHF discharge plasmas are reasonably well reproduced by the simulations.
The simulations implies that a low-Te diffusion plasma is formed in the processing region (z = 15–30 mm). This plasma is characterized by  cm−3,
cm−3,  eV, and
  . Because Te is rather low, the electron impact ionization does not play a role in the plasma generation. This low-Te plasma is sustained by diffusion of the upstream plasma in the discharge region through the mesh electrode holes. A similar low-Te diffusion plasma was observed in the remote configuration [45].
5.2. Ion species
The contour plots of ion densities for H+,  ,
,  , and H− are shown in figure 5. Comparing the amplitudes of these densities, we see that
  is the dominant ion (figure 5(c)). This
  ion is formed efficiently by the ion–molecule reaction of
  + H2
+ H2  +H, since the rate constant for this reaction is high [43]. The spatial distribution and amplitude of the
  density are similar to those of ne. The charge neutrality is thus satisfied primarily between electron and
  . For the other ion species (H+,
  , and H−), the densities are typically of the order of 107 cm−3 (figures 5(a), (b), (d)), i.e., smaller than that of
  by at least one order of magnitude. These results are consistent with our previous experimental results of mass spectroscopy [12, 37].
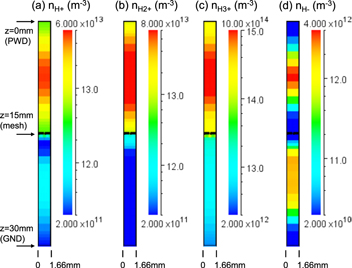
Figure 5. Contour plots of the positive and negative ion densities. (a) H+, (b)  (c)
(c)  , and (d) H− ion.
Download figure:
Standard image High-resolution image5.3.
 and H atom kinetics

Figure 6(a) shows the contour plot of  . As shown,
  is broadly peaked at the middle of the discharge region. The peak value is
  m−3, which reasonably agrees with that measured by VUVAS in this study (see also figure 2). The H atoms are generated mainly in the discharge region, via two processes: the electron impact dissociation (e + H2
  e + 2H), as shown in figure 6(b) and the ion–molecule reaction (H2+ + H2
  + H), as shown in figure 6(c). The former is strongly dependent on Te and the latter is a function of H2 density, i.e. p. So, the later process becomes prominent in relatively low-Te plasmas generated at a high-p condition. It should also be mentioned that in the processing region, the generation rate of the H atoms,
  , is negligibly small. This is because Te is rather low compared with a threshold energy of the electron impact dissociation (≈8.8 eV) [42]. Beside, the
  ions, yielding H atoms by the ion–molecule reaction, described above, is limited to diffuse in a short distance due to its high reactivity. As for the loss of H atoms, the electron attachment (e + H
  H−), shown in figure 6(d), is negligibly small, compared with the generation. The loss of H atoms is dominated by the surface reactions on the electrode, forming H2 molecules, shown in the next.
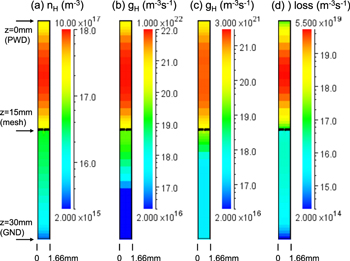
Figure 6. Contour plots of H atom related parameters. (a) H atom density,  , (b) H atom generation rate,
  , associated with the electron impact dissociation (e + H2
  e + 2H), (c) H atom generation rate, associated with the ion–molecule reaction (H2+ + H2
  + H) and (d) H atom loss rate due to the electron attachment, e + H
  H−.
H−.
Download figure:
Standard image High-resolution imageFigure 7(a) is a vector plot of the H atom flux in the whole simulation space. As seen, the H atoms generated in the bulk plasma diffuse toward the PWD electrode one side and the mesh electrode the other side. The figure also shows that the H atom flow tends to concentrate on the mesh hole, and spread away near the exit of the mesh hole. The detailed flux pattern around the mesh is shown in figure 7(b). We notice that a fraction of the H atom flux goes towards the lateral surface of the mesh, and some other fractions go around the backside of the mesh electrode. The flux pattern inside and around the hole is complicated, and thus  in the processing region is expected to be strongly dependent on the geometry of the mesh. This will be confirmed by simulation results in the following subsections. For the diffusion flux of H atoms on the GND electrode, as shown in figure 7(a), the simulation yields roughly 1016 cm−2 s−1 in direct configuration and 1014 cm−2 s−1 in the remote configuration. This reduced diffusion flux originates primarily to the lowered
  in the processing region.
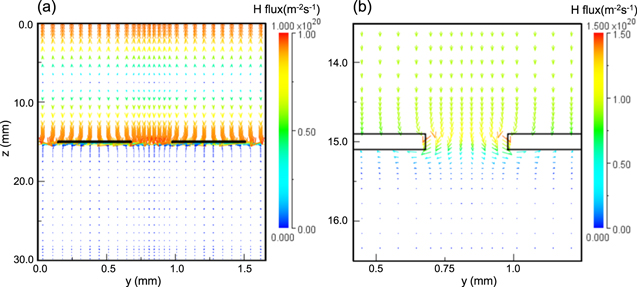
Figure 7. Vector plots of H atom flux. (a) H atom flux in whole simulation space, including two unit cells of the mesh electrode. (b) H atom flux near the mesh, showing the detailed flow pattern inside the hole. The mesh electrode is located at z = 15 mm, denoted by square objects. The aspect ratio of spacial scale (y and z) and the color bar scale are adjusted to clearly show the H atom flux.
Download figure:
Standard image High-resolution image5.4. Discharge parameters
The H atom generation, diffusion and surface recombination are studied by changing the discharge parameters, the mesh electrode geometry and the reflection probability. Figure 8(a) shows the spatial distribution of  at y = 8.3 mm as a parameter of Vpp. As Vpp increases from 50 V to 100 V,
  is increased over the entire space (z = 0–30 mm), i.e., not only in the discharge region but also in the possessing region. The increasing rate of
  on
on  roughly agrees with that observed in the experiments. The simulation results of
  are plotted at the corresponding
  in figure 2(a).
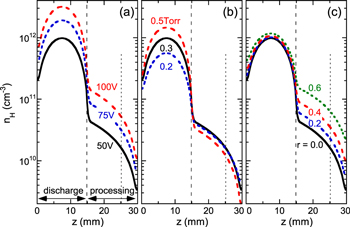
Figure 8. Spatial distributions of  at y = 8.3 mm as a parameter of (a) the VHF peak to peak voltage, Vpp, (b) the H2 gas pressure, p, and (c) the reflection probability, r. The dashed line at z = 15 mm indicates the height of the mesh electrode. The dotted line at z = 25 mm indicates the position of
  measurements in the experiments.
Download figure:
Standard image High-resolution imageThe spatial distribution of  at y = 8.3 mm for three different p is shown in figure 8(b). As p increases from p = 0.2 to 0.5 Torr,
  is increased only in the discharge region, not in the processing region. Such a tendency is also observed in the experiments, as shown in figure 2(b). According to the simulations, the H atom flux through the mesh holes remains rather constant (
 cm−2 s−1 for p = 0.2–0.5 Torr), although
  in the discharge region is increased at higher p. This result suggests the H atom diffusion is restricted by collisions with the surrounding H2 molecules, and the H atom flux through the mesh holes determines
  in the processing region.
5.5. Mesh geometry
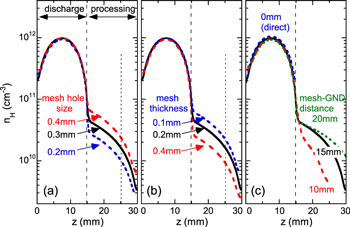
To study the diffusion in the mesh electrode holes, we varied the hole diameter and the thickness of the mesh electrode. The simulation results are shown in figures 9(a) and (b). As expected,  in the processing region is increased with increasing the hole diameter and decreasing the thickness. The limiting of the H flow by the mesh holes is thus a key factor to determine the spacial distribution of
  in the processing region.
Figure 9. Spatial distributions of  at y = 8.3 mm as a parameter of (a) the mesh hole diameter, (b) the mesh electrode thickness, and (c) the mesh-GND electrode distance. The dashed line at z = 15 mm indicates the height of the mesh electrode. The dotted line at z = 25 mm indicates the position of
  measurements in the experiments.
Download figure:
Standard image High-resolution image
5.6. Surface reflection
The effect of surface reflection is also studied. Figure 8(c) shows the spatial distribution of  as a parameter of r. As shown,
  in the processing region is increased with r, i.e. decreasing the surface recombination probability, 1-r. Comparing to the measurement results of
  in figure 2, we find relatively small values of
  for the electrodes covered with μc-Si:H. In early works [46, 47], r is reported to be 0.2 and lower for a silicon wafer in H2 plasma etching process. So, our value of r is consistent with those in early works [46, 47].
5.7. Mesh-GND electrode distance
Finally, we show the effects of the mesh-GND distance on  . As shown in figure 9(c),
  in the processing region is increased with the mesh-GND distance. Because the electrode surface behaves as recombination sites for H atoms, separating the GND electrode away yields higher
  in the processing region. In the same figure, the mesh-GND distance of 'zero', i.e. the direct configuration, is also shown. As apparent, the spatial distribution in the discharge region is overlapped. Therefore,
  measured in the direct configuration gives that in the discharge region in the remote configuration.
6. Conclusions
We investigated the H atom kinetics in capacitively-coupled 60 MHz VHF discharges in direct (diode) and remote (triode) configurations. Under a wide range of discharge conditions of 16–780 mW/cm2 in discharge power and 0.1–2 Torr in H2 gas pressure,  was experimentally determined from VUVAS, using a MHCL as a VUV light source. We found that
  was strongly reduced across the mesh electrode in the remote configuration. For the mesh with 0.2 mm in thickness and 36% in aperture ratio,
  varied from ∼1012 cm−3 to ∼1010 cm−3.
The 2D fluid model simulations were carried out to study the plasma parameters and H atom kinetics. The ionization region was figured out in the bulk plasma. The plasma generated in the discharge region diffused downward, i.e. in the processing regions in the remote configuration. The plasma parameters in the bulk plasma were obtained as follows;  cm−3,
cm−3,  eV, and
  (i.e.,
  ) for 60 MHz discharge operated at p = 0.3 Torr and Vpp = 50 V. The positive ion species was dominated by
  . The plasma parameters and the dominant ion species agreed with those measured in the previous experiments [12, 37].
In the simulations, the discharge conditions and mesh geometry were independently varied to study the H atom generation, diffusion and recombination. It was found that the H atoms were generated in the bulk plasma, mainly by two processes: the electron impact dissociation (e + H2  e + 2H) and the ion–molecule reaction (H2+ + H2
  + H). The diffusion of H atoms was strongly limited by the mesh electrode in the remote configuration. So,
  in the processing region decreased with decreasing the mesh hole size and increasing the mesh thickness. The loss of H atoms was dominated by the surface recombination. Comparing
  between the measurements and simulations, the H atom reflection was recognized to be relatively low for the μc-Si:H surface; it was estimated to be
  .
.
Acknowledgments
The authors are grateful to Dr Y Abe (Tokyo Tech.), Prof N Ezumi (U Tsukuba), and Prof N Ohno (Nagoya U) for valuable discussions. This work was supported in part by New Energy and Industrial Technology Development Organization (NEDO) and JSPS KAKENHI (Grant Number 24540546 and 15K04717).