
Abstract
A series of ice pellets was injected into the advanced stellarator Wendelstein 7-X (W7-X). Although the pellets were small and slow, deep and efficient particle fueling could be observed experimentally. The most striking feature appearing after the injection of the pellets, however, was a transient increase in the energy confinement time. This transient phase resembled in several aspects modes of enhanced confinement after gas-puff or pellet injection, as observed in other fusion experiments. All experimental attempts, to prolong this phase, failed. In this paper, discharges are described that show the enhanced energy confinement, and some conditions are summarized which seem to be essential in order to generate it. The focus here is on deep particle fueling by pellets, and shaping of the density profiles during and after the series of pellets. During this time, neutral gas particle re-fueling at the plasma edge is reduced, while density profile peaking and low impurity radiation losses are present.
Export citation and abstract BibTeX RIS

Original content from this work may be used under the terms of the Creative Commons Attribution 4.0 license. Any further distribution of this work must maintain attribution to the author(s) and the title of the work, journal citation and DOI.
1. Introduction
The fully three-dimensional magnetic field structure of W7-X [1–4] provides degrees of freedom for transport optimization. This is the background of the 'advanced' concept. The contribution of the neoclassical transport is large compared to axisymmetric devices, making such an optimization mandatory [5]. The advanced concept of W7-X [6] includes, among other aspects, the minimization of drift losses of particles trapped in local magnetic mirrors. The latter are a result of the non-axisymmetric structure of the magnetic field. In particular in the long-mean-free-path regime, where the collision frequency ν becomes low for reactor-relevant high plasma temperatures T, the radial energy flux scales like T7/2/ne in the 1/ν regime [7] with ne being the electron density. The neoclassical transport in a stellarator, however, can be restrained by the radial electric field Er, providing a much more favorable scaling of the transport coefficients like T5/4 . Er−3/2 giving rise to the  -regime. For details see [8]. The finite Er results from the intrinsically non-ambipolar radial fluxes for particles of different electric charge. In addition, the optimization concept includes a minimization of the bootstrap current and the plasma Shafranov shift, and an optimization of the confinement of highly energetic particles. Finally, it has to ensure that even for finite plasma pressure, the edge magnetic configuration is preserved in order to allow stable island divertor operation [9], and resistive ballooning and interchange stability is strived for.
In order to assess the global discharge energy confinement in W7-X, the experimental energy confinement time τEexp is compared to predictions by the empirical International Stellarator Scaling law ISS04 [10]. Noteworthy is the positive density dependence ne0.54 predicted by that scaling, because both ne and τE enter directly into the fusion triple product. Hence, operation at high density is expected to be beneficial in a stellarator, because stellarators do not suffer from a Greenwald density limit [11]. The beneficial influence of ne appears as well in the neoclassical transport coefficient in the 1/ν regime as shown above. Upper density limitations, in contrast, are imposed by plasma radiation losses in W7-X [12, 13]. First investigations implied that the heating power available was balanced by the radiated power, as described by the Sudo density limit [14]. Considering the rather low heating power density in W7-X (up to 8 MW of electron cyclotron resonance heating (ECRH) in a plasma volume of about 30 m3) this resulted in a subtle interplay between heating, radiation and density control. Density control, and hence appropriate central particle fueling, are therefore key issues for a stable and safe plasma operation in W7-X.
In order to take advantage of the most beneficial properties of W7-X, i.e. both the advanced transport concept and the potential to operate at high density, pellet injection experiments are performed. Pellets provide deep and efficient central fueling, with the potential to keep the edge density low. Series of rather small and slow pellets were injected, in order to avoid a too strong central cooling of the plasma.
As demonstrated in the heliotron LHD [15] with pellet-fueled discharges, the edge density and temperature can play a key role in the attainment of stable discharges with good confinement [16], even if the averaged electron density exceeds the Sudo limit. A peaked density profile shape, resulting from the central particle fueling by pellets, is beneficial to this process.
On the route to an assessment of the neoclassical transport properties of W7-X, discharges are described in this paper, exhibiting a transiently enhanced energy confinement after series of pellets. These transient phases differ strongly from the pre-pellet phases, which, at least in the examples presented here, do not fulfill the ISS04 expectations. The reasons for that are still subject to investigations. It is suspected that turbulence-driven radial transport plays an important role for the energy confinement, in particular ion temperature gradient (ITG) and trapped electron mode (TEM) turbulence [17, 18]. A change in the density profile shape after pellet fueling, especially a gradient steepening and profile peaking, might help to stabilize some of these modes. The stabilization might be most efficient if steep density gradients coincide radially with steep temperature gradients. A more detailed discussion of the neoclassical transport contribution, given the discharge conditions as shown in this paper, is therefore demanding, not only because of the turbulent transport contribution, but also because of the non-stationarity of the phenomena observed.
First, the experimental conditions for the pellet experiments are described. Then, some characteristics of the enhanced discharges are summarized, and a comparison to a gas puff fueled discharge is given. Finally, some physics aspects are discussed which accompany the enhanced confinement phase.
2. Experimental
W7-X is an optimized stellarator with a major radius of about 5.5 m and a minor radius of about 0.5 m, both quantities being a function of the magnetic configuration. The magnetic field with up to 3 T on the magnetic axis is produced by a set of 50 non-planar and 20 planar superconducting coils allowing, in principle, for quasi steady-state plasma operation. During the last experimental campaigns, a magnetic field around 2.5 T was employed, allowing for resonant ECRH at 140 GHz in 2nd harmonic frequency. The polarization of the incident waves can be rotated between X2 and O2 orientation. Up to ≈8 MW heating power are available. O2 mode heating is employed to overcome the cut-off density limitation of the X2 mode at 1.2 × 10²⁰ m−3. A system of sniffer-probes detects the ECRH stray level in the machine, in the case we approach the cut-off density, the heating is inter-locked to protect the in-vessel components. The plasma heating is then blocked immediately.
The 70 superconducting coils are connected in seven series with ten coils, each. The coil current in each series can be controlled independently from the others. Thus, a large variety of different magnetic configurations is available. The edge rotational transform ιa was chosen for the discharges presented here such to make ιa = 5/4 and ιa = 5/6 divertor configurations possible (in the 'low-iota' and 'high-iota' case) Furthermore, low- and high magnetic mirror configurations can be realized [19]. The stellarator W7-X has, seen from the top, roughly the shape of a pentagon. The variation of the magnetic field is done by a variation of the coil currents. In the standard case, the variation of the magnetic field strength is typically ≈ ±4% on the magnetic axis, when comparing the corners of the pentagon with the middle of the straight parts between the corners. In the high-mirror case, this variation increases to about ±10%. This is roughly the technically attainable maximum, when taking the magnetic forces onto the coils into account. In the corners of the pentagon, the magnetic field strength has a maximum. The straight parts are referred to as modules later in the text. W7-X has therefore five modules. W7-X is a low shear machine; with some limited possibilities to vary the shear with the magnetic configuration. Albeit of interest for improved plasma confinement after pellets, so far no experiments with pellets and variations of the magnetic shear were performed.
Since W7-X went into operation, three operation phases, designated OP1.1, OP1.2a and OP1.2b, were conducted. During the two most recent experimental campaigns, OP1.2a and OP1.2b, ten inertially cooled divertors were employed in order to investigate the concept of a helically shaped island divertor. In the 'standard-case' ιa ≈ 5/5, the five natural island chains are located outside the last closed flux surface and intersect the graphite targets of the divertors to provide particle and energy exhaust. For the next experimental campaigns, water-cooled divertors will receive the heat flux enabling quasi-stationary discharges. In order to measure the neutral gas pressure in the vacuum vessel midplane and the sub-divertor space, ionization manometers are installed [20]. Mechanical turbo-molecular pumps with a total pumping speed of 25.000 l s−1 evacuate presently the sub-divertor neutral gas inventory. In future campaigns, the mechanical pumps will be supported by additional cryo-pumps, which will be installed inside the divertor chambers.
At the beginning of OP1.2b, a first boronization of the vessel wall was performed, in order to suppress the outgassing and enhance the gettering of oxygen, and to improve the wall retention for hydrogen. As desired, this procedure widened considerably the operational plasma density window for hydrogen discharges. Before, helium was used as operation gas. Both measures together, the installation of divertors and the wall boronization, allow for an effective control of the central plasma density in hydrogen discharges, presumably due to a more effective control of the edge density and the impurity inventory close to the plasma edge.
During OP1.2a and OP1.2b, a blower-gun pellet injector [21, 22] was used to inject series of cryogenic hydrogen pellets into the W7-X plasma. The pellets were comparably small (mass content between 0.5 × 10²⁰ up to 2.5 × 10²⁰ particles per pellet) and slow (velocity between 150 m s−1 and 250 m s−1). Series of up to 40 pellets could be injected into one discharge, with a pellet repetition frequency that could be chosen between 5 Hz and 30 Hz. During the last two campaigns, the plasma working gas was helium or hydrogen; the pellets were always made of hydrogen ice. Typical pellet fueling rates in the plasma were in the range of ≈2 × 10²¹ particles/s. Two pellet guide tubes directed the pellets to the inboard and outboard side of W7-X, in order to investigate the technique of magnetic high-field side injection (HFS) in comparison to the low-field side (LFS) [23]. As the blower-gun employed a two-barrel acceleration system, LFS and HFS pellets could be injected together into the same discharge. Two microwave mass-detectors, installed in the two guide tubes, measured the pellet mass and velocity in flight [24]. A fast PIN-photodiode recorded the ablation light in the plasma with a time resolution of 1 MHz, and fast video cameras with frame rates between 100 Hz up to 350 kHz observed the pellet ablation cloud with an observation angle roughly perpendicular to the flight path of the pellets [25]. More details are described in [26].
So far, all experiments were performed with protium ice, in order to avoid a too high activation of the wall components in this very early stage of experiments in W7-X. We are still facing numerous modifications of the hardware, in particular inside the vessel. In order to facilitate these activities, both the pellet material and the plasma gas feed are both by protium.
Radial profiles of the electron density and temperature were provided by a Thomson scattering system [27]. Nd-YAG lasers were operated at a repetition frequency between 5 Hz and 30 Hz. The triggers for the lasers and the pellet injector are not synchronized in time. A single-channel dispersion spectrometer [28] utilizes a measurement branch parallel to the Thomson lasers chords and provides the central electron line density. The electron cyclotron emission (ECE) system [29] delivered electron temperature profiles. The electron density fluctuations ñ were measured by a phase contrast imaging system PCI [30]. Spatially resolved plasma radiation profiles were provided by a bolometric system [31], with two cameras observing the plasma horizontally and vertically. Balmer-alpha light and impurity spectral line emission was measured by a filterscope-system [32], providing information on wall recycling and wall impurity fluxes at a number of different locations inside the W7-X vessel. Ion temperature profiles, and profiles of the radial electric field Er were measured by a vacuum ultraviolet system labelled x-ray imaging crystal spectrometer XICS [33], employing the line emission of argon spectral lines. The diamagnetic plasma energy is measured by means of three diamagnetic loops [34].
3. Results
About 150 discharges were fueled during the last two campaigns with series of pellets, mostly for the purpose of deep and efficient core particle fueling. In total, 45 of them showed a transient increase in the diamagnetic energy content, after the series of pellets was terminated. To date, that phenomenon could be observed experimentally very well in the 'standard', 'high-iota' and 'low-iota' magnetic configurations. Discharges with enhanced confinement after pellet fueling in the 'high-mirror' case could be performed only with restrictions, mainly because of technical reasons. The few discharges that were tried in the latter configuration showed a pronounced heat load on the baffle wall plates, with a subsequent loss of density control and enhanced impurity radiation losses, terminating these discharges prematurely.
This effect of increased diamagnetic energy was observed for a number of discharges with pellet series, hereafter referred to as enhanced confinement after pellet series (ECAPS). The acronym ECAPS is used in this paper exclusively for the sake of brevity, not as a claim that it represents a general phenomenon of enhanced confinement (i.e. a new confinement mode). In all examples observed experimentally, ECAPS developed after termination of a pellet series. It should be noted at this point, that ISS04 predictions hold in a strict sense only for stationary plasma conditions, a situation that is not true here. Therefore, we refer only to the ratio of the experimental to the ISS04 reference value as a significant parameter, rather than to the absolute values of τE. However, the typical time-scale for changes of τE is always comparable to the value of τE itself (in the range 100–250 ms); therefore the discussed discharges are not too far away from stationarity.
The maximum of τE appeared typically about 300 ms after the end of the pellet series. Such a delay is a characteristic feature of this phenomenon. For instance, time delays of between 100 ms up to 700 ms were observed between the last pellet and the maximum of τE. Pre-requisites for ECAPS are obviously low wall recycling fluxes, so that the major fraction of fueling particles is coming from the pellets. In contrast, enhanced gas puff, applied to increase the density, promoted the formation of flatter density profiles and was deleterious to ECAPS, which was accompanied, in many cases, by peaked density profiles resulting from the deep particle fueling by pellets.
The figure 1 shows the overview time traces of such a discharge labelled 20171207.006. At the beginning, the ECRH heating power is kept at a low level of about 3 MW to start the discharge safely (uppermost plot). Then it is increased to about 5 MW to stabilize the improved confinement ECAPS phase as long as possible, indicated as time interval II. The radiation losses decrease gradually as the ECAPS phase develops. During that time phase II, the ECAPS develops for a duration of about 1 s, visible as a transient increase of the diamagnetic energy in the third plot. Between ≈1.5 s and ≈2.2 s the central electron and ion temperatures approach each other (second plot), after that phase they deviate progressively. The highest central ion temperatures observed so far in W7-X are measured during the ECAPS phase; more than ≈3 keV. During the time interval I, the pellets are injected (lowest plot). In this case, a series of 17 pellets was injected between 1.2 s and 1.75 s. Each pellet is represented by one dot, the distance of each dot from the time axis indicates the pellet mass in arbitrary units. The density jumps, induced by the individual pellets, can be seen on the trace of the electron line density. At about 2.2 s, a short event of unknown origin (presumably triggered by a MHD activity) interrupts the ECAPS interval, visible on the curves of the radiation losses, the H-alpha intensity, the diamagnetic energy content and the line density.

Figure 1. Overview time traces for discharge 20171207.006. The first plot shows the ECRH heating power (solid line) and the integrated radiation losses measured by bolometry (dashed line). The second plot shows the central Ti (solid line); the central Thomson Te (stars) and one central channel of Te measured by ECE (dashed line). The third plot shows the signal of one H-alpha channel (solid line) and the diamagnetic energy content (dashed line). The fourth plot shows the interferometer line density (solid line) and the injection times for the pellets (dots). Each dot represents one pellet; the height of the dot above the x-axis is proportional to the pellet mass. The mass difference between LFS pellets (upper trace of dots) and HFS pellet (lower trace of dots) is apparent. The time interval with pellet injection is labelled as I, the time interval with ECAPS as II. The ion temperature starts to increase at ≈1.5 s, hence 0.1 s earlier than the step-up of the ECRH. This is probably caused by the enhanced electron-ion heat coupling due to the total density increase.
Download figure:
Standard image High-resolution imageFigure 2 shows, as a prominent example for enhanced energy confinement, time traces of the experimental energy confinement time, τEexp = Wdia/(Pheat−dWdia/dt) (solid line) compared to values expected from ISS04 (dashed line) for discharge 20171207.006. Here, Wdia is the diamagnetic energy content and Pheat the heating power. In this figure, τE is below the ISS04 value for most of the time period shown; this is a typical finding for the vast majority of the experiments. However, between ≈1.8 s and 2.3 s the experimental τE transiently exceeds the ISS04 predictions. A more thorough analysis of the plasma energy transport, a neoclassical transport calculation and some considerations with focus on the ion energy transport are given in [35].

Figure 2. Time traces of the energy confinement time (y-axis) for the ISS04 prediction (dashed line) and the experimental value (solid line) for discharge 20171207.006. During the ECAPS phase between ≈1.8 s and 2.3 s, the experimental value exceeds the ISS04 value transiently. After t = 2 s the ISS04 value starts decreasing because the ECRH heating power is increased. The double arrow indicates the time interval of pellet injection. Two typical error bars are shown, as well.
Download figure:
Standard image High-resolution imageTurbulence is considered to play a crucial role for the appearance of ECAPS. In order to assess the role of TEM or ITG better, and to highlight the impact of steepened gradients, the scale lengths and the ηi—criterion are evaluated. To provide a generic picture, the scale lengths are calculated from effective minor radii like Lne = ne. | dne/dreff |−1 and LTi = Ti. | dTi/dreff |−1 instead of using real space co-ordinates, and ηi = Lne/LTi. The growth rates of ηi—modes are calculated by gyrokinetic simulations [17], indicating the stabilizing effect of enhanced density gradients. These calculations indicate a reduction of turbulence growth rates, if ηi approaches values close to one. In order to highlight better the time sequence of various plasma parameters before or during ECAPS, the figures 3–5 show the time development of the inverted gradient scale lengths a/LT, a/Ln and ηi (figure 3), the line density and diamagnetic energy Wdia (figure 4), the density peaking factor and the central ion temperature (figure 5) for discharge 20171207.006.
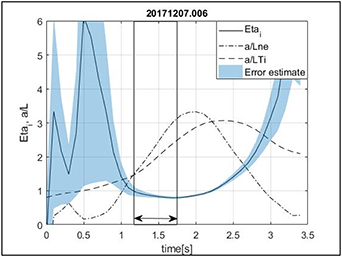
Figure 3. Time traces of the inverted gradient scale lengths (dashed and dot-dashed lines) and ηi (solid line) for discharge 20171207.006, taken at reff = 0.3 m, i.e. at a plasma radius where the gradients are steepest. The maximum of the ECAPS phase at ≈ 2.2 s in the energy confinement time co-incides roughly with the maximum of a/Lne which occurs, however, slightly before. Here, a denotes the minor plasma radius. The minimum of ηi appears earlier, at ≈ 1.75 s, i.e. at the end of the series of pellets. The double arrow indicates the time interval of pellet injection. The shaded area shows the estimate of reliability for ηi as calculated from the smoothing fit function to the density and temperature profiles. Before t = 1 s the quality of the density profiles is very poor, i.e. the error in ηi is very large.
Download figure:
Standard image High-resolution image
Figure 4. Time traces of the electron line density (solid line, left y-axis) and diamagnetic energy (dashed line, right y-axis) for discharge 20171207.006. The maximum of the ECAPS phase at ≈2 s coincides with the maximum of the diamagnetic energy, the latter phase lasting until ≈2.3 s. The sudden drop after 2.2 s is suspected to be provoked by fast MHD event of unknown origin. The line density increases in steps, each step being induced by a single pellet. The double arrow indicates the time interval of pellet injection.
Download figure:
Standard image High-resolution image
Figure 5. Time traces of the central ion temperature (solid line, left y-axis) and the density peaking factor (dashed line, right y-axis) for discharge 20171207.006. The maximum of density peaking appears slightly before the maximum of the ECAPS phase at ≈ 1.8 s, while the maximum of Ti(0) appears with a slight time delay of ≈ 0.2 s after. The double arrow indicates the time interval of pellet injection.
Download figure:
Standard image High-resolution imageThe estimate of reliability for ηi is calculated from the maximum and minimum values of the plasma profiles, as far as they are still compatible with the error estimates as resulting from a Gaussian progress regression calculation. For both cases, the gradients are calculated, and then the quotient is formed in order to calculate ηi. Here, 95% prediction intervals are used.
The maximum of density peaking coincides with the end of the pellet series at ≈1.75 s, the maximum of density gradients at this point provides the minimum of ηi. With a delay of ≈0.3 s the maximum of τE and a/Lne are observed at ≈2.0 s, followed by a maximum in Wdia between ≈2.1 s and 2.3 s. As can be seen in figure 4, the maximum in Wdia is sustained for about 200 ms, hence for a length of the order of τE. This justifies to some extent the comparison of the experimental energy confinement to ISS04, where, in principle, stationary discharge conditions would be required.
Between ≈2.2 s and 2.3 s the maxima of Ti and a/LTi are measured. This indicates the leading role of rapid density increase by pellets, the presumed stabilizing of ITG by a/Lne coincides well with the best energy confinement (as expected), while the slight delay in maximum Ti is somewhat unexpected. The line density is increased by the pellets by a factor of ≈3.4, while Wdia increases during the same time interval by a factor of ≈2.6 which is clearly above the expected ISS04 density scaling of 3.4°.54 = 1.94 < 2.6. This is a consequence of the peaking of the density profile. The density peaking persists long enough (≈1 s) to stabilize the discharge during the subsequent ECAPS phase. The temporal increase of ηi is obviously slow enough to keep the ITG turbulence level low to support this phase. Favorable values of ηi ≈ 1 are maintained up to ≈2.5 s. In addition, it is suspected that the missing cooling by the pellet ice material between ≈1.8 s and 2.5 s (i.e. directly after the series of pellets) helps prolongating this phase of favorable energy confinement. The ECAPS phase is finally terminated by the steep ion temperature gradients, i.e. by the unfavorably high a/LTi.
It has to be noted that the pellet deposition is rather shallow, i.e. the major fraction of the particles is deposited in a minor radial interval of about 5–15 cm within the last closed flux surface (in real space), corresponding to about 15%–40% of the effective minor radius. Surprisingly, a large fraction of the particles can be found deep in the plasma, leading to the enhanced density gradients and the improved energy confinement. Presently, we can only speculate that the deep deposition of particles is connected to the considerable change in plasma transport, which occurs during the ECAPS phase. Neoclassical transport calculations are presently performed, in order to confirm or disprove our speculation. The density peaking factor is defined as the quotient between the central electron density (i.e. within the innermost 3 cm in minor radius) and the averaged electron density, as measured by Thomson scattering.
Figure 6 shows the time development of the density profile shape for this discharge, as measured by Thomson scattering. During the time interval of pellet injection, the central density for effective minor radii <0.4 m strongly increases, and a steep density gradient develops between 0.2 m and 0.4 m, while the densities for effective minor radii >0.4 m increase only marginally. The steepened density gradient, together with the pronounced peaking of the density profile seem to be an essential pre-requisite for the development of ECAPS. At the beginning of the series of pellets at ≈1.2 s, the density profile peaking factor is ≈1.2, and then it increases up to ≈1.6 at ≈1.75 s, i.e. at the end of the pellet series. This efficient central particle fueling was a typical property of the pellet series in W7-X. The density profile peaking factor is defined as the ratio between the central Thomson electron density and the averaged density.

Figure 6. Density profile shape development as measured by Thomson scattering for discharge 20171207.006. The Thomson laser repetition frequency is 10 Hz. The x-axis shows the effective minor plasma radius, the y-axis the time, the z-axis the Thomson electron density. The two arrows indicate the start and end of the series of pellets. Colors are visible only in the online version of the journal.
Download figure:
Standard image High-resolution imageThe core values of the radial electric field changed from positive to negative Er, as expected for a change from electron-root to ion-root conditions. The result of this measurement is shown in [36]. The plasma was within the ion-root in a time window between ≈1.3 s and ≈2.4 s, hence within the time interval between the start of the series of pellets until the end of the ECAPS phase. It was negative over the entire minor plasma radius, with maximum values of up to ≈−30 kV m−1 in the gradient region (at reff ≈0.35–0.4 m), i.e. at the location with the steepest density gradient, as shown in figure 6.
Figure 7 shows time traces for the electron line density for discharge 20181016.037, where two subsequent series of pellets were used to fuel the discharge. The first series of 18 pellets was injected between ≈0.5 s and ≈1.2 s. It increased the line density to almost ≈1020 m−2. After this first series, the density profile peaking factor grew from about 1.1 before the pellet series to almost ≈1.5 afterwards, at about 1.5 s. Then it dropped again to about 1.2 and remained at this level throughout the rest of the discharge, although a second series of 8 pellets was injected between ≈2.0 s and ≈2.4 s. It has to be noted that the estimated error bars (starting from the Thomson scattering data) are comparable in size to the change in the peaking factor itself; nevertheless the time curves are rather smooth, indicating that the error is over-estimated and the change observed is real.

Figure 7. Time traces of the interferometer line density (solid line, left y-axis) and the density profile peaking factor (dashed line, right y-axis) for discharge 20181016.037. The two double arrows indicate the two series of pellets. Two typical error bars are shown, as well.
Download figure:
Standard image High-resolution imageIn parallel to the enhanced density peaking at 1.5 s, the experimental energy confinement time τEexp increased to almost ≈500 ms (solid line), as shown in figure 8 for the same discharge. Transiently, τEexp surpassed the expectation from the ISS04 scaling (dashed line) strongly. The very high absolute value of almost ≈500 ms for τEexp is mostly due to the term dWdia/dt. Therefore, for comparison, also the curve τEexp = Wdia/Pheat (dots) without the time derivative is shown in the same plot. However, even when considering this, the experimental estimate lies transiently slightly higher than the expectation from the ISS04 scaling.

Figure 8. Time traces of the experimental (dotted line) and ISS04 predicted (dashed line) energy confinement time for discharge 20181016.037. The two double arrows indicate the two series of pellets. For comparison also the experimental τEexp = Wdia/Pheat is shown(solid line), without the term dWdia/dt. Two typical error bars are shown, as well.
Download figure:
Standard image High-resolution imageThe injection of two series of pellets was an attempt to maintain the transient phase of enhanced energy confinement for a longer time interval. However, this failed. After the second series of pellets, neither an increased density profile peaking nor the enhanced energy confinement could be reproduced. The reason for this failure is unknown. It is speculated that a sharp transient increase of the global plasma radiation of unknown origin at t = 1.71 s is partly responsible for the failure in this discharge (visible in figure 7 as the small peak in the line density just before the second series of pellets arrived). Note that the pellets in the first series were accidentally larger than the pellets in the second series, and the first series was longer. In the first series, the summarized number of protons in the injected pellets = 27.8 × 10¹⁹, in the second series = 15.1 × 10¹⁹. This difference is caused by an enhanced loss of pellet ice in the blower-gun after the first series, because the propellant gas cannot be pumped away quick enough. This leads, in turn, to an enhanced sublimation rate of the stored ice. In addition, the ECRH power was higher during the second series (5 MW) compared to the first series (2 MW), making deep pellet ablation more difficult. This all leads to a poorer penetration for the pellets of the second series, making fueling much more difficult. Therefore, the density increase during the first series was higher.
Figure 9 shows an overview of time traces for discharge 20180918.045. This discharge, with pronounced ECAPS at ≈3.3 s, is typical for a multitude of experiments showing ECAPS. The pellet series, with HFS and LFS pellets, started at ≈1.8 s and ended at ≈2.8 s with the moment of maximum diamagnetic energy at about 3.3 s. During the series of 26 pellets, the central values of Te and Ti approached each other, the end of the ECAPS phase correlates well with an increasing difference between Te and Ti. In addition, the increase of ne induced by the pellets was accompanied by increased radiation losses. However, the ECAPS phase itself was accompanied by reduced radiation losses. These details can be seen better in figure 18. The injection of pellets had to be stopped here at ≈2.8 s, because the discharge approached the X2 cut-off density in the plasma center. Before the pellet phase, the experimental τE was about 20% below the ISS04 prediction, while during the ECAPS phase it was about 20% above. In addition, the ne profile peaking factor reached values up to ≈1.5 during the pellet phase compared to ≈1.2, on average, before then.

Figure 9. Overview time traces for discharge 20180918.045. The first plot shows the ECRH heating power (solid line) and the integrated radiation losses measured by bolometry (dashed line). The second plot shows the central Ti (solid line) and the central Thomson Te (stars). The third plot shows the signal of one H-alpha channel (solid line) and the diamagnetic energy content (dashed line). The fourth plot shows the interferometer line density (solid line) and the injection times for the pellets (dots). Each dot represents one pellet; the height of the dot above the x-axis is proportional to the pellet mass. The mass difference between LFS pellets (upper trace of dots) and HFS pellet (lower trace of dots) is apparent. The time interval with pellet injection is labelled as I, the time interval with ECAPS as II.
Download figure:
Standard image High-resolution imageNonetheless, it is common to all such discharges that the central ion and electron temperatures approached each other, with record values (for W7-X) in the range of up to ≈3.5 keV and record diamagnetic energy contents (for W7-X) of ≈1.2 MJ. After the ECAPS phase, the difference between the ion and electron temperatures increased again rapidly.
To date, however, ECAPS could never be stabilized for a longer stationary phase. Thus, such highly dynamical behavior makes understanding the phenomenon difficult. Obviously, high central densities after the series of pellets foster energy exchange between electrons and ions, thereby providing high Ti with strongly negative radial electric fields Er (the so-called ion-root) [37]. Note that the only ion heating is via the electrons during these purely ECRH heated discharges. The radial sheared flow might help suppress turbulence, thus reducing possible anomalous radial transport contributions. This is supported by Phase Contrast Imaging (PCI) measurements of ñ/ne. These indicate a strong suppression over a wide frequency range between 100 kHz and 400 kHz, during the ECAPS phase. Normally, ñ scales with ne in W7-X, however the situation is obviously somewhat different here [36]. During ECAPS discharge phases, a strong reduction of density fluctuations is observed by PCI [18].
The central ion heating, together with the central particle fueling support strongly peaked density profiles in ion-root dominated discharges. However, more experiments will be required in the future to illuminate the interplay between the mentioned parameters. The critical question to answer will be: how can ECAPS be extended to stationarity? In this work, variations of the pellet repetition frequency or well-timed steps in the heating power, as well as double pellet series with a time delay of about 1 s, did not provide the desired results.
In general, it made no difference whether LFS or HFS pellet series were injected; in both cases, ECAPS conditions could be maintained. A very few experiments were performed with shorter series of pellets. With only four pellets, the delayed increase in Wdia could be reproduced, however the reaction of the central ion and electron temperatures was marginal, and τEexp did not exceed the ISS04 expectations. Another discharge with comparable plasma parameters, but only one pellet, showed similar behavior regarding the ECAPS signature. The available number of discharges with pure HFS or LFS pellet injection and subsequent ECAPS is, however, too small to draw a conclusion, whether the pellet size or the injection geometry play a role for the attainment of ECAPS.
The radial profiles of electron density and electron and ion temperature show characteristic features, if a discharge phase with ECAPS is compared to a phase without. Figure 10 shows examples for discharge 20180918.045 after the ECAPS phase at t = 5.0 s (plots to the left) and during ECAPS at t = 3.3 s (plots to the right). The upper two plots show the electron density, the two plots in the middle the electron temperature and the lower two plots the ion temperature profiles, together with the measurement error bars, a fit to a Gaussian process regression model (solid lines) and the corresponding 95% prediction intervals for the fit (dashed lines). For the Gaussian process regression model, a squared exponentional covariance function is used, because it reproduces well flat parts of the profiles, as well as gradients. The 95% prediction intervals are used to calculate the maximum and minimum gradient values that are still compatible with these bounds, these extrema are then used to estimate the error of ηi. Another advantage of the Gaussian process regression is the possibility to estimate a profile error, if no measurement errors are available (that happens sometimes for Thomson data), or if the statistical errors of each measured data point obviously does not cover possible systematic effects (as this might be the case for the XICS ion temperature profiles).

Figure 10. Radial profile of the Thomson electron density (first two plots), the Thomson electron temperature (two plots in the middle) and the XICS ion temperature (last two plots). The left column shows the plots for the discharge phase without, the right hand column the plots with ECAPS. The solid lines in the first four plots show the fit to a Gaussian process regression model to the measurement data, the dashed lines show the 95% prediction intervals. The circles show the measurement points together with the measurement error bars. The last two plots show the ion temperature profiles, as revealed from a tomographic reconstruction. The circles show the reconstructed Ti values.
Download figure:
Standard image High-resolution imageThe shape of the density profile changes from a flat one (without ECAPS) to a more peaked one (with ECAPS). The high central density of ≈9 × 10¹⁹ m−3 provides a strong grad-ne with non-vanishing values throughout the entire plasma column. Despite a higher central density during the ECAPS phase, the edge density at reff ≈ 0.5 m remains unchanged (within the measurement error bars) or drops even slightly. Unfortunately, all Thomson measurements of the edge density suffer from these large error bars. Other diagnostics, being capable of measuring the edge density at these radii, are presently not available. The measured high edge density of ≈2–3 × 10¹⁹ m−3 is reasonable, because in general island densities of the same size are measured [38]. The Te profile shape changes from peaked without ECAPS to flat (within reff ≈ 0.1 m). Due to the same central Te of about 3.5 keV with and without ECAPS, this leads to steeper Te-gradients. However, it is not clear whether this steeper gradient can drive turbulence, which might be relevant for the confinement. The central ion temperature during ECAPS exceeds strongly the value without, and a strong ion temperature gradient establishes at an effective minor radius of about 0.3 m. Due to the evaluation of Ti and the error bars by a fit of the measured argon spectra to an atomic model, and the subsequent tomographic reconstruction of the corresponding profiles [33], the resulting profiles (as shown) look very smooth and the error bars are very small. That explains also the un-physical non-vanishing gradient of the Ti profile in the plasma center.
The profile gradients of temperature and density, as well as the gradient scale lengths are calculated for this discharge, in order to assess the stabilizing influence of the density gradient. For that sake, the discharge profile parameters are compared between t = 3.3 s (during ECAPS) and t = 5.0 s (after ECAPS). After spline fit smoothing of temperature and density profiles, the quantities dne/dr (reff), d Ti/d(reff), d Te/d(reff), a/Lne and a/LTi are calculated and compared as a function of reff. Figure 11 shows the result, i.e. here the gradients with and without ECAPS. For the case without ECAPS (left plot), grad-ne is large only at the outer part of the plasma at reff > 0.4 m. The situation is completely different for the case with ECAPS where all maxima of the gradients coincide at reff ≈ 0.3–0.4 m (plot in the right). In addition, grad-ne is here by a factor of 1.7 larger than for the case without ECAPS (plot in the left). This illustrates the importance of the size of grad-ne, as well as the radial location of its maximum for the possible stabilization of ITG modes. Without ECAPS, a/LTi and a/LTe exceed a/Lne within the entire plasma volume. Again, the situation with ECAPS is different. Here, a/Lne exceeds a/LTi over wide ranges of the plasma. These findings are condensed in the radial profiles of ηi, as shown in figure 12. With ECAPS, the values of ηi during ECAPS are clearly smaller than for the case without ECAPS, within the entire plasma column. With ECAPS, they reach favorable values ≈1 in a radial interval ≈0.08–0.25 m, while they are always >3 for the discharge without ECPS within the entire plasma column.

Figure 11. Radial profile of density and temperature gradients for discharge 20180918.045 without ECAPS (plot to the left) and with ECAPS (plot to the right). Shown are values for electron density (red dot-dashed) and electron temperature (black solid), and the ion temperature (blue dashed).
Download figure:
Standard image High-resolution image
Figure 12. Radial profiles of ηi for the discharge 20180918.045 with ECAPS (solid line) and without ECAPS (dashed line). The shaded areas show error estimates for ηi.
Download figure:
Standard image High-resolution imageExperiments were performed to establish an equivalent scenario to ECAPS with gas-puff only, i.e. without pellets. Although it was possible to maintain high central density values (well above 1020 m−3) with gas-puff alone, the abrupt interruption of central fueling after the end of a series of pellets could not be reproduced with the external gas feed. In addition, gas-puff-supplied discharges suffered in general, from their beginning, from rather broad density profile shapes, in contrast to the more peaked profiles achieved during pellet supplied discharges. Finally, the gas-puff fed discharges suffered in general from higher radiation losses, as detected by the bolometry. Figures 13–16 show time traces that allow comparison between pellet feed and gas puff.

Figure 13. Overview time traces for discharge 20180904.027 with pellets. The first plot shows the ECRH heating power (solid line) and the integrated radiation losses measured by bolometry (dashed line). The second plot shows the central Ti (solid line), and the central Thomson Te (stars). The third plot shows the signal of one horizontal H-alpha channel (solid line) and the diamagnetic energy content (dashed line). The fourth plot shows the interferometer line density (solid line) and the injection times for the pellets (dots). Each dot represents one pellet; the height of the dot above the x-axis is proportional to the pellet mass.
Download figure:
Standard image High-resolution image
Figure 14. Overview time traces for discharge 20180808.012 with gas-puff. The first plot shows the ECRH heating power (solid line) and the integrated radiation losses measured by bolometry (dashed line). The second plot shows the central Ti (solid line), and the central Thomson Te (stars). The third plot shows the signal of one horizontal H-alpha channel (solid line) and the diamagnetic energy content (dashed line). The fourth plot shows the interferometer line density (solid line). No pellets are injected.
Download figure:
Standard image High-resolution image
Figure 15. Time traces of the energy confinement time (y-axis) for the ISS04 prediction (dashed line) and the experimental value (solid line) for discharge 20180904.027 with pellets. During the ECAPS phase at ≈1.7 s–2 s, the experimental value exceeds the ISS04 calculation. One typical error bar is also shown.
Download figure:
Standard image High-resolution image
Figure 16. Time traces of the energy confinement time (y-axis) for the ISS04 prediction (dashed line) and the experimental value (solid line) for discharge 20180808.012 without pellets. The experimental energy confinement time remains permanently below the ISS04 prediction. One typical error bar is also shown.
Download figure:
Standard image High-resolution imageFirst, figure 13 shows the example of a discharge with pellets, where ≈300 ms after the last pellet the energy confinement time transiently surpasses the ISS04 prediction. For comparison, a discharge with gas-puff only is shown in figure 14. For both discharges, the same magnetic configuration is realized, the heating power is increased in steps to 5 MW, and the maximum central density is ≈1.1 × 10²⁰ m−3 (transient for the pellet discharge and stationary for the gas-puff). However, during the gas-puff fed discharge, the radiation losses were higher than for the pellet discharge, and the experimental energy confinement time was only about 60% of the ISS04 expectation. The corresponding time traces of energy confinement times are shown in figures 15 and 16. The peaking factors for the density profiles were ≈1.4 for the pellet discharge compared to ≈1.25 for the discharge with gas-puff, hence broader density profiles resulted from the gas-puff. Finally, it should be noted that different time scales were required to stabilize both discharges. While the density could be increased with pellets within a short period (smaller than 1 s), discharges with gas-puff typically needed significantly more time for the same density rise, when considering the line density. Concerning the total amount of particles in the plasma, investigations for a global particle balance are presently ongoing. The results will be published later.
Typically, the discharges with ECAPS showed a transient decrease of the neutral gas pressure at the plasma edge during the phase with enhanced confinement. This might support the formation of the more peaked density profiles during ECAPS, since particle fueling by pellets is concentrated in the plasma center, while the edge particle fueling is reduced.
Figure 17 shows the time traces of the neutral gas pressure in the plasma chamber during the series of 26 pellets and the ECAPS phase in discharge 20180918.045 (discharge time traces see figure 9). During the time interval I with pellet injection between ≈1.9 s to 2.8 s, the neutral gas pressures increased linearly, as did the plasma density. During the ECAPS phase (interval II), the neutral gas pressure dropped transiently, i.e. the plasma was pumping particles. The low neutral gas pressure in the vessel supports the peaking of the plasma density profile. The maximum in the diamagnetic energy was reached at about 3.3 s. This is just the moment when the neutral gas pressure started to increase again.

Figure 17. Time traces of the neutral gas pressures (y-axis) in the W7-X vessel for discharge 20180918.045, measured at three different machine modules labelled 20, 31, 41, in the main plasma chamber. During time interval I the pellets are injected, in the time interval II ECAPS develops. Colors are visible only in the online version of the paper. 'Mod 41' is solid black (curve on top), 'Mod 31' is dot-dashed blue, 'Mod 20' is solid red (lowest curve).
Download figure:
Standard image High-resolution imageThe location of the pressure gauges is always inside the vessel main chamber, away from the divertor chamber, or a pumping duct. They are all on the outer side of the plasma chamber, roughly in the midplane of the torus, but in three different machine modules, namely no. 2, 3 and 4.
Figure 18 shows a synchronous behavior for the edge channels of the radiated power measured by bolometry. During the series of pellets (time interval I) the radiation increased at the plasma edge and the core, and then it dropped transiently during the time interval II when ECAPS developed. At about 3.3 s the edge radiation increased again, and the core losses dropped.

Figure 18. Time traces of the emitted radiative power (y-axis), measured by bolometry for one inboard (solid line, line in the middle), one outboard (dot-dashed, the highest line) and one central channel (dotted line, the lowest line) for discharge 20180918.045. During time interval I the pellets are injected, in the time interval II ECAPS develops. Colors are visible only in the online version of the paper.
Download figure:
Standard image High-resolution imageThe time traces of spectral line intensity of some impurities, radiating from the plasma edge, exhibited a similar behavior, as shown in figure 19. In addition, in the figure 19, one Balmer-alpha trace is shown, indicating the temporal development of the hydrogen wall recycling flux. As in the previous two figures, the curves increase during the phase with pellet injection, and stagnate during the ECAPS phase or drop even transiently. This indicates a transient reduction of the wall particle fluxes, both for intrinsic impurities like oxygen, or residual gases from preceding gas puff experiments like nitrogen. The edge electron temperatures and densities do not change considerably at the location as a function of time, where these low ionization stages exist (those are singly ionized). Hence, the radiation light level is mainly a flux information, rather than an impurity density information. Probably, higher ionized impurity stages will be much more a subject of variation, resulting from electron temperature variations. However, it cannot be excluded entirely, that a temperature variation also plays a role.

Figure 19. Time traces of the intensity of the spectral line emission for a variety of impurities (y-axis, for N-II the lowest blue line, for O-II the red solid line in the middle) and one H-alpha trace (black solid line, uppermost), measured on the vessel wall in the machine midplane for discharge 20180918.045. During time interval I the pellets are injected, in the time interval II ECAPS develops.
Download figure:
Standard image High-resolution imageRemarkable, but typical for good ECAPS discharges, are the temporal variations in the radial profiles of the ion temperatures Ti and Er [39], as evaluated by the vacuum ultraviolet system working with argon [33], shown for discharge 20171207.006. The figures 20 and 21 show the measured Ti and Er as a function of the effective minor plasma radius and time. During the ECAPS phase between ≈1.8 s and ≈2.6 s, the central Ti increases considerably for minor effective radii <0.3 m up to values >3 keV, while Er becomes strongly negative in the same time interval, for effective minor radii >0.25 m. The pellets are injected between 1.2 s and 1.75 s. Figure 22 shows four individual time traces at four different effective minor radii for the same discharge. The values of Er in the plasma center are not affected (r = 0 m), while in the gradient region (r = 0.28 m and 0.34 m) they become strongly negative. Long after ECAPS, they recover to values around zero, of slightly positive (as for the position r = 0.1 m). In order to give an idea on the errors of these measurements, figure 23 shows one individual radial profile of Er at t = 1.9 s, i.e. at the beginning of the ECAPS phase.
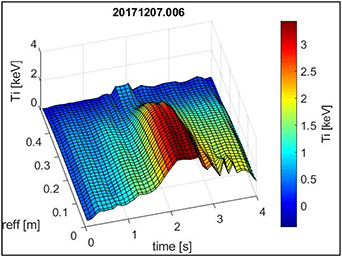
Figure 20. Radial profiles of the ion temperature versus time for discharge 20171207.006. The ECAPS phase between 1.8 s and 2.3 s shows strongly increased central Ti and steepened gradients at effective minor radii ≈0.3 m. Colors are visible only in the online version of the paper.
Download figure:
Standard image High-resolution image
Figure 21. Radial profiles of the radial electric field versus time for discharge 20171207.006. The ECAPS phase between 1.8 s and 2.3 s shows strongly negative Er in the gradient region outside effective minor radii ≈0.3 m with values <—30 kV m−1, and slightly negative values within the entire plasma column. In the discharge phase before ECAPS, Er is always positive. Colors are visible only in the online version of the paper.
Download figure:
Standard image High-resolution image
Figure 22. Selection of some individual time traces from figure 21 for the radial electric field. Shown are the curves for r = 0 m (solid black), r = 0.1 m (dot-dashed blue), r = 0.28 m (solid red) and r = 0.34 m (solid green). Colors are visible only in the online version of the paper.
Download figure:
Standard image High-resolution image
Figure 23. One radial profile of the radial electric field, for the data shown in figure 21, for t = 1.9 sec.
Download figure:
Standard image High-resolution image
The appearance (or suppression) of ECAPS in W7-X discharges is not a clear function of the average electron density or the heating power Pheat prior to pellet injection. A statistical analysis of all pellet discharges shows no statistically significant dependence between the appearance of ECAPS, and  or Pheat.
4. Discussion
Transient phases of ECAPS could be reproduced in all four W7-X magnetic configurations of the last experimental campaigns; however, attempts failed to prolong significantly this phase. In the 'high-mirror' case, only the transient increase in Wdia was clearly observable, the other characteristics of ECAPS were not pronounced, presumably because of technical problems with overheated wall components. Double series of pellets were tried to prolong the ECAPS phase, as well as variations of heating power steps during and after ECAPS, but without success. Several working hypothesis are under consideration, as to which plasma parameters are decisive for bringing about ECAPS phases, and which are only a result of the enhanced confinement. However, no conclusion could be found yet.
Comparably narrow and peaked density profiles seem to play a role with enhanced density gradients over the entire minor radius, which might help stabilizing ITG modes transiently [40]. During ECAPS discharge phases, a radial overlap between the steepened density and temperature gradients is observed experimentally, supporting the hypothesis of transiently stabilized ITG [18]. The reduced density fluctuations, as observed by PCI, might serve as indicator for this mechanism. As a working hypothesis, therefore, it is assumed that the steepened density gradients (at the radial location of steep ion temperature gradients) help stabilizing ITG turbulence, as observed by PCI. This reduces the radial (ion) heat transport, leading to increasing central ion temperatures. Experimental support is provided by the measured small values of ηi ≈ 1 observed in correlation with good global energy confinement of the discharges.
The optimization concept of W7-X approaches quasi-isodynamicity [41], with the intention to maintain a reduced sensitivity against a variety of lower-frequency electrostatic instabilities that might enhance radial transport. In the only approximately quasi-isodynamic W7-X, one could therefore expect stabilizing of trapped-electron modes (TEM) as a matter of principle. This might be true only to some extent, as the turbulence measurements revealed [17].
The peaked density profile shape during ECAPS is caused by the central particle fueling with pellets, while the transiently reduced edge neutral gas pressure provides less particle refueling at the edge. Wall boronization, the suppression of impurity fluxes and a working neutral gas retention by the island divertor are likely to support ECAPS. More experiments with a fully water-cooled divertor, equipped with cryo-pumps with enhanced pumping speed will help to shed more light on this aspect. ECAPS is accompanied by reduced plasma radiation losses, as observed by bolometry. This becomes obvious when comparing the figures 13 and 14. With gas-puff alone, the overall radiation level is about 50% of the heating power, during ECAPS only about 20%.
A typical characteristic for all ECAPS discharges is the central cooling of the electrons by the pellets. This increases the electron collisionality, hence reducing the electron-ion heat exchange time τei∼Te3/2. This, in turn, will enhance the heating of the ions in the center of the plasma. Such a mechanism cannot be produced with gas puff only. Reduced radiation losses (as observed experimentally) in conjunction with the enhanced central ion heating seem to be crucial key parameters for the existence of ECAPS properties.
Over a wide range of the minor radius, the positive radial electric field Er (electron-root) changes to negative Er (ion-root) with increasing gradients of Ti and pi in the pellet-fueled discharge phase. The existence of ion-root conditions over a wide radial range within the plasma seems to be essential, as well as high temperatures with Te(0) ≈ Ti(0). Shear flow decorrelation due to the poloidal ExB drift might help reducing the turbulent level further. This is supported by the observed reduction in ñ during ECAPS. Continuing electron heating after ECAPS possibly decouples eventually electrons and ions again, such that a back-transition to conditions before the series of pellets might become inevitable.
Discharges with enhanced energy confinement, accompanied by strong negative Er are well known from the predecessor experiment W7-AS [42]. These discharges were characterized by steep pressure gradients in particular for the ions, strong gradients in Er and low wall recycling fluxes. As a result, the energy confinement time exceeded scaling expectations by a factor of two [43]. The high-confinement properties were strongly pronounced in Neutral Beam Injection (NBI) heated plasmas, but not restricted to these [44]. Future experiments with NBI heating in W7-X will show, which role the direct ion heating plays.
Some of the properties of ECAPS resemble various modes of improved confinement, as observed in other machines. An overview over enhanced confinement scenarios is given in [45]. The transient peaking of the density profiles resembles the Pellet Enhanced Performance 'PEP' mode as discovered in the tokamak JET [46]. There, reduced ion transport correlated with density peaking was observed, this effect could be confirmed in many other experiments. In the heliotron CHS, but also in other helical machines, the so-called 'reheat' could be observed, with a considerable improvement of the confinement and a peaked density profile, in particular directly after terminating the external gas puff [47, 48]. Presently, it is too early to state whether ECAPS is similar to PEP or reheat, even if the similarities are obvious. At least for reheat we have the obvious difference that ECAPS appears only after pellets, while reheat follows the termination of gas-puff. In LHD, however, reheat could also be maintained after series of pellets [16].
As an overview over the turbulence measurement data, and the accompanying changes in transport, together with the transport calculations, see [49].
5. Summary
Discharges fueled with series of pellets exhibit a transient phase of improved energy confinement, a few 100 ms after the last pellet entered the plasma. All attempts failed to stabilize this transient phase for a longer time. As a measure for the improvement of the energy confinement, the experimental energy confinement time is compared to prediction by the ISS04 scaling. Obviously, deep particle fueling by pellets with the formation of subsequent peaked density profiles are an essential condition to maintain ECAPS. Low wall recycling fluxes, low impurity radiation losses and a low neutral gas pressure accompany the enhanced phase. Ion-root conditions with strong negative Er in the gradient region might play a role for the improvement of the energy confinement, possibly for turbulent transport, and, as far as they play a role for the discharges presented here, for the neoclassical transport coefficients. The ECAPS phenomenon exhibits numerous mutually coupled aspects, both at the plasma edge and in the plasma center, making a compact interpretation difficult, so far. A variety of other investigations is presently ongoing and results will be reported in future publications.
Acknowledgment
This work has been carried out within the framework of the EUROfusion Consortium and has received funding from the Euratom research and training program 2014–2018 and 2019–2020 under grant agreement No. 633053. The views and opinions expressed herein do not necessarily reflect those of the European Commission.