
Abstract
Objective. Dynamic cerebral autoregulation (dCA) is a well-established mechanism that acts to maintain cerebral blood flow (CBF) reasonably constant in response to short-term fluctuations in blood pressure. It is known to be impaired in many clinical conditions, including stenosis, which is also a major risk factor for ischaemic stroke. However, it is not yet well understood whether impairment in dCA in one brain region is independent or not on dCA impairment in other brain regions, for example, whether there are spatial effects of stenosis on dCA. This is due to the complex blood flow environment and the lack of physiological experiments. Approach. We thus establish and apply a novel computational stenosis model including the circle of Willis to investigate and to quantify the degree of dCA impairment and CBF patterns as a function of stenosis fraction, measured in different configurations of the cerebral vasculature. Main results. We find some evidence for dependence between dCA in different brain regions, although this is very preliminary and much more experimental data will be required to answer this question fully. Significance. Our study has provided a first attempt to consider the effect of stenosis in various arteries on cerebral autoregulation to investigate spatial variations in dCA. This has potential applications in the treatment of cerebrovascular diseases where the control of cerebral perfusion is critical but where measurements are scarce.
Export citation and abstract BibTeX RIS

Original content from this work may be used under the terms of the Creative Commons Attribution 4.0 licence. Any further distribution of this work must maintain attribution to the author(s) and the title of the work, journal citation and DOI.
Introduction
Cerebral autoregulation (CA) is a vital mechanism within the human brain that acts to maintain cerebral blood flow (CBF) approximately constant in response to short-term fluctuations in arterial blood pressure (ABP) (Payne 2006). The tightly limited range of CBF set by both static CA (sCA) and dynamic CA (dCA) can substantially reduce the occurrence of both hyper- and hypo- perfusion, reducing the risk of damage to the brain. Even a temporary impairment of dCA can significantly alter the supply of CBF to the brain and the maintenance of normal perfusion after events such as Acute Ischaemic Stroke (AIS) plays an important role in clinical practice. One factor that is known to affect dCA is stenosis, with a number of studies having investigated dCA in patients with varying degrees of stenosis.
Stenosis is a phenomenon of abnormal vessel narrowing, often caused by a plaque leading to a near blockage of a major blood vessel, which can cause a significant increase in local vessel resistance. In ageing populations, atherosclerosis has become more prevalent, leading to a rise in stenosis prevalence (Freeman and Otto 2005). Severe (70%) extracranial internal carotid artery (ICA) stenosis has also been found to be an important cause of ischaemic stroke or transient ischaemic attack (TIA) (Flaherty ML 2013). AIS is the cause of 87% of strokes, occurring when thrombotic or embolic clots block large cerebral blood vessels (Benjamin et al 2018). Approaches for treatments include using intravenous recombinant tissue plasminogen activator (IV rt-PA) and mechanical thrombectomy that have both been validated to treat ischaemic stroke and are now seen as gold standards (HACKE et al 1995), (Palaniswami and Yan 2015). To decrease the risk of recurrent stroke, prompt revascularization using carotid endarterectomy (CEA) and carotid artery stenting (CAS) has been widely adopted (Rothwell et al 2003), (Gong et al 2006). Decreased cerebrovascular reactivity (CVR) in asymptomatic stenosis is also a major risk factor for both TIA and stroke (Diehl 2002).
Both dCA and CVR in middle cerebral arteries (MCA) are known to be impaired due to stenosis in the ipsilateral ICA (White and Markus 1997), and dCA has been shown to be severely impaired in bilateral ICA stenosis (Reinhard et al 2003). Stenosis has been found to impair both static and dynamic cerebral autoregulation, and the degree of impairment is strongly positively correlated with the degree of carotid cerebral stenosis (Reinhard et al 2008). The rate of recovery (RoR) and phase have been shown to be impaired and inversely related to the degree of MCA stenosis above 50% (Chen et al 2014), and dCA has been shown to be ipsilaterally impaired and to have the potential to spread contralaterally in severe unilateral MCA stenosis in asymptomatic patients (Wang et al 2015). In a more recent study, it was shown that CA is bilaterally impaired in ICA stenosis caused by ischaemic stroke, and that the CA impairment pattern is heterogeneous in different stroke mechanisms (Tian et al 2021). A summary of previous studies in terms of numbers of subjects, status, and the choice of dCA metrics is shown in table 1; it should be noted that direct comparison between these studies is difficult due to the wide choice of different dCA metrics. Understanding the reason why dCA is not impaired for small values of stenosis and finding the value of the threshold for impairment are both important for a better understanding of dCA.
Table 1. Summary of previous studies on the effect of stenosis on dCA.
| Subject numbers | dCA metrics used | Authors |
|---|---|---|
| 27 patients with carotid stenosis (>60%) 21 age-matched normal controls | Autoregulatory index (ARI) | White and Markus (1997) |
| 30 patients with severe bilateral carotid stenosis (≥75%) 30 patients with unilateral stenosis | Transfer function analysis (phase shift) | Reinhard et al (2003) |
| 165 patients with ICA stenosis (>70%) | Dx and Mx phase | (Reinhard et al (2008) |
| 21 patients with MCA stenosis (mild, <50%; moderate, 50%–69%; severe stenosis, 70%–99%) 15 healthy controls | Rate of recovery, phase and CVR | Chen et al (2014) |
| 57 patients with asymptomatic unilateral MCA stenosis (mild, <50%; moderate, 50%–69%; severe stenosis, 70%–99%) 8 patients with symptomatic severe unilateral MCA stenosis (> 70%) 24 healthy controls | Transfer function analysis (phase difference and gain) | Wang et al (2015) |
There are however only a few attempts to model the effect of stenosis on sCA or dCA. Liang et al proposed a stenosis-induced pressure drop using an empirical model proposed by Young and Tsai (1973), to determine the risk and location of post-CAS hyperperfusion through analysis of the circle of Willis (CoW) anatomy and stenosis distribution patterns (Liang et al 2011). Another study used a simple way to connect stenosis with CA by changing the vessel radius with different stenosis degrees:

where  is the initial artery radius, and
  represents the level of stenosis; this study proved the importance of high-level collateralization for blood supply compensation (Krames et al
2019). However, these models did not consider the effect of stenosis on both sCA and dCA. We thus extend our previous model of dCA (Tong et al
2021), in which a single vascular regulation model has been integrated within a whole-brain compartmental model to consider the spatial variations and effects of stenosis in dCA to examine whether changes in dCA in one region influence changes elsewhere. This will be important in understanding the relationships between sCA and dCA in different brain regions.
represents the level of stenosis; this study proved the importance of high-level collateralization for blood supply compensation (Krames et al
2019). However, these models did not consider the effect of stenosis on both sCA and dCA. We thus extend our previous model of dCA (Tong et al
2021), in which a single vascular regulation model has been integrated within a whole-brain compartmental model to consider the spatial variations and effects of stenosis in dCA to examine whether changes in dCA in one region influence changes elsewhere. This will be important in understanding the relationships between sCA and dCA in different brain regions.
Methodology
We adopt the simplified circuit equivalent model previously proposed (Kennedy McConnell and Payne 2016) as shown in figure 1. This symmetric model assumes that each large artery can be considered as a simple resistance. The connections mimic the CoW, which consists of eight major parts including two anterior cerebral arteries (ACAs), an anterior communicating artery (ACoA), two internal carotid arteries (ICAs), two middle cerebral arteries (MCAs), two posterior communicating arteries (PCoAs), two posterior cerebral arteries (PCAs), a basilar artery (BA), and two vertebral arteries (VAs). The anterior circulation consists of the MCAs and ACAs with the blood supply from ICAs perfusing the frontal, parietal, and temporal regions of the brain. The posterior circulation is provided by PCAs with the blood supply from BA and VAs perfusing the stem region. The ACoA and PCoAs provide the interconnection between anterior and posterior circulation. In the model, there are four blood flows into the circulation, from the left and right VA and ICA, and six blood flows out of the circulation at the PCA, MCA, and ACA on both sides.  represents the peripheral venous blood pressure of the outflow, which is assumed throughout here to be 5 mmHg.
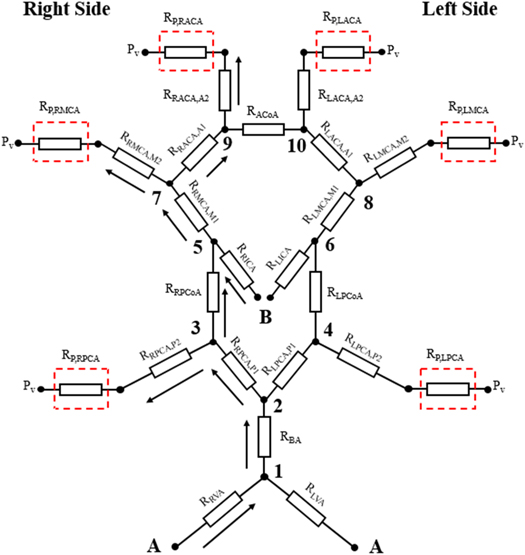
Figure 1. Schematic of simplified circuit equivalent network. Figure adapted from Kennedy McConnell and Payne (2016). (A) and (B) represent the points of input blood pressure. Red dashed squares represent the peripheral resistances near the outflow. © 2016 IEEE. Adapted, with permission, from Kennedy McConnell and Payne 2016.
Download figure:
Standard image High-resolution imageFrom the figure, we can see that there is a link between ICA stenosis and the local conditions in the PCAs, MCAs, and ACAs. In particular, there is both a direct effect of ICA stenosis on the other three arterial branches due to changes in flow conditions that are caused by changes elsewhere in the network, and also an indirect effect of ICA stenosis due to an indirect link between the ICA and the other three arterial branches, i.e. there must be some co-ordination of autoregulation across the different territories. This means that autoregulation is not a set of individual regulating vessels, rather a more coordinated response to changes in ABP. We can also see that bilateral MCA stenosis can cut off the flow to the ACAs, which will cause a significant CA impairment.
In the large arterial vessels, to avoid using a full CFD solver, for simplicity, we use Poiseuille's equation with the assumption that the blood flow is laminar and fully developed, i.e.:

where  is the viscosity of the blood flow with the value of 4.5 × 10⁻³ Ns m−1,
  is the vessel length,
  is the vessel radius,
  is the pressure drop alongside the vessel, and
  is the blood flow. The parameters for each arterial resistance are taken from Alastruey et al (2006) as shown in table 2. Since the major part of MCA is the M2 part and the rest is M1, we assume that the resistance value of RMCA,M2 consists of 90% and RMCA,M1 consists of 10% of the RMCA. The pressures at each point shown in figure 1 can easily be obtained by solving standard conservation of flow relationships.
In the model proposed here, we replace the peripheral resistances, shown in red dash-squared boxes in figure 1. We divide the whole peripheral resistances into two parts including the small arterial compartment and the capillary and venous compartment, which is adapted from our previous autoregulation model (Tong et al 2021) as shown in figure 2.
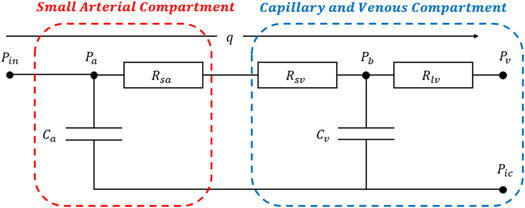
Figure 2. Schematic of peripheral resistance. Figure adapted from Tong et al (2021). Adapted from Tong et al 2021, Copyright 2021, with permission from © 2021 IPEM. Published by Elsevier Ltd. All rights reserved.
Download figure:
Standard image High-resolution imageThe equation for  is given by:

where  is the effective number of parallel arterioles in the vascular tree with the assumption that the vascular network fully consists of parallel-arranged identical arterioles, and which is set manually to be 7000 by adjusting the model to ensure correct baseline flows in the larger vessels based on the experimental data quoted by Ursino et al (1996), where the CBF baseline in the PCA is 1.2598 ml s−1, in the MCA is 1.3364 ml s−1, and in the ACA is 1.2895 ml s−1 at a baseline ABP of 100 mmHg. We use the same ratio between
  and
and  as given in Payne (2006) to obtain the specific value of venous resistances in each peripheral resistance as shown in table 3.
The definitions of the compliance and the blood volume in both the venous and arterial compartments are given by Tong et al (2021):

where  is the compliance of venous,
  is the stiffness coefficient for venous compliance,
  is venous pressure,
  is intracranial pressure, and
  is the pressure offset for venous compliance. The blood volume in the venous compartment
  can be obtained from the integration of equation (4) to give:

Similarly, the compliance of the arterial compartment  is defined as:

where  is the stiffness coefficient for arterial compliance,
  is the pressure offset of arterial compliance. The blood volume in the arterioles is given as:

where  is the offset.
To examine the model's dynamic response and hence to quantify dCA, we increase the inlet pressure by 10% of the baseline inlet pressure (100 mmHg), to investigate the response of vessel radius over time (Tong et al
2021). To conduct the simulation, we always assume that  for simplification, i.e. that the systemic circulation maintains a uniform inlet pressure despite any flow changes within the brain. We then simulate the effect of stenosis by increasing the value of resistance by decreasing the radius in the related vessels shown in equation (1). To quantify the degree of dynamic autoregulation response, we use RoR for CBFV, which is a simple and commonly used parameter to measure the recovery degree of the CBFV step response after a step pressure change in time domain of dCA. This is defined by Chen et al (2014) as:

where the first 3 s after the step pressure changes are used for the calculation.
Results
We conducted the computational simulation using MATLAB to investigate both the static and dynamic autoregulation impairment as a function of the effect of stenosis. For sCA, we first adjusted our model without any stenosis by setting the effective number of parallel arterioles in the vascular tree  to 7000 as mentioned in the previous section to fit Lassen's curve obtained from cats and rats (Ursino et al
1996). Having validated the feasibility of our model, we then conducted the simulation of sCA with 70% stenosis in the left ICA and CBFV measured in the systemic arterial tree as an illustration. The results are shown in figure 3.
to 7000 as mentioned in the previous section to fit Lassen's curve obtained from cats and rats (Ursino et al
1996). Having validated the feasibility of our model, we then conducted the simulation of sCA with 70% stenosis in the left ICA and CBFV measured in the systemic arterial tree as an illustration. The results are shown in figure 3.
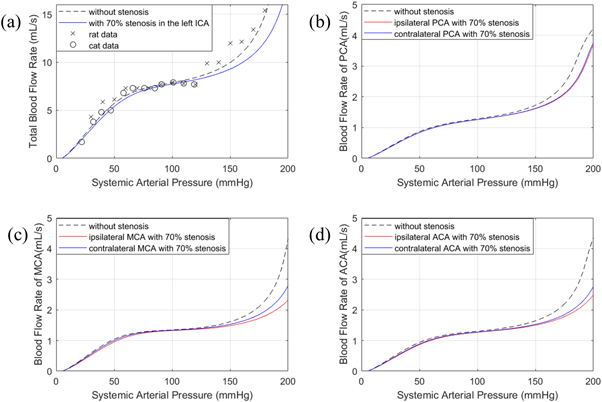
Figure 3. sCA response without stenosis and ipsilateral and contralateral MCA 70% stenosis in (a) total blood flow; (b) PCA; (c) MCA; (d) ACA.
Download figure:
Standard image High-resolution imageAlthough our model does not perfectly fit the sharp jump in the experimental data exhibited between 120 mmHg and 130 mmHg, the trends that we find at the higher values of ABP are still in good agreement, comparable to that found by other authors, enabling us to draw conclusions from this model. From this figure, with 70% stenosis in the left ICA, we find that sCA is only significantly impaired beyond a certain level in the high systemic arterial pressure range with the appearance of severe stenosis, while the impairment in the lower limit and plateau parts of Lassen's curve appears to be much smaller. Compared to the baseline, the CBFV measured at the aggregate arterial tree was found to decrease by just 1.55% at 100 mmHg, and 6.70% at 150 mmHg respectively. Additionally, CBFV measured at the ipsilateral PCA decreased 1.17% and contralateral PCA decreased 0.98% at 100 mmHg, and 5.88% and 5.46% respectively at 150 mmHg. CBFV measured at the ipsilateral MCA decreased 1.91% and contralateral MCA decreased 0.62% at 100 mmHg, and 8.26% and 5.36% respectively at 150 mmHg. Finally, CBFV measured at the ipsilateral ACA decreased 2.75% and contralateral ACA decreased 1.86% at 100 mmHg, and 8.40% and 6.94% respectively at 150 mmHg. Thus, even in response to large changes in driving pressure, CBF was found to be highly robust, indicating that sCA was only minimally impaired in the presence of significant stenosis, if no other factors were assumed to affect static CBF.
To validate the robustness of our model, we also conducted the Sobol global sensitivity analysis towards 9 different parameters including 8 most top-right parameters in figure 13 in our previous paper (Tong et al
2021) and  with ±5% variation on figure 3(a). The results are shown in figure 4.
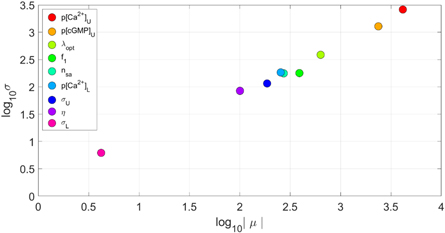
Figure 4. The sensitivity analysis with ±5% variation.
Download figure:
Standard image High-resolution imageFor dCA, we investigated the effects of stenosis on dCA both in the same arterial and in different arterial vessels. First, we conducted simulations for both unilateral and bilateral MCA stenosis measured at ipsilateral MCA, PCA, and ACA respectively. We quantified the comparison by calculating the RoR at different degrees of stenosis, which is calculated as the difference between the value of CBFV at 3 s after the step pressure occurs and the initial value of CBFV. For ease of comparison, each value of RoR is compared to the baseline condition, i.e. the 0% stenosis condition. We performed this calculation of relative changes in dCA strength to enable us to compare our results more easily with the many different metrics of dCA used in the literature. Then we conducted the same simulations for unilateral and bilateral PCA and ACA stenosis. The results are shown in figure 5.
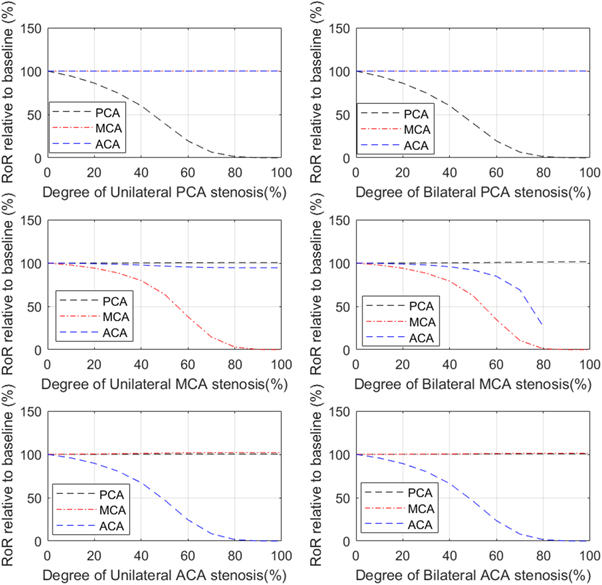
Figure 5. Relationship between RoR, relative to baseline, and degree of unilateral and bilateral PCA, MCA, ACA stenosis measured at ipsilateral (where relevant) PCA, MCA, and ACA. Note that no solutions were obtained for flow in the ACA in the bilateral MCA stenosis model beyond 80% stenosis.
Download figure:
Standard image High-resolution imageFrom this figure, we can clearly see that the RoR drops dramatically past approximately 50% stenosis when measured in the same arterial branch, indicating a severe dCA impairment. This finding is consistent with the results from Chen et al (2014). We also find, however, that both unilateral and bilateral stenosis have little effect on the strength of dCA in different arterial branches, indicating that stenosis appears to only have a local effect rather than a global effect. The one exception to this is that bilateral MCA stenosis significantly affects dCA in the ACA branch. This is likely because the baseline flow in these circumstances will be very significantly altered in the presence of significant stenosis. Hence, it appears that changes in dCA in one vessel occur largely independently of changes in dCA in another vessel.
For comparison with previous studies, Chen et al (2014) used RoR to indicate the strength of dCA function measured in the MCA in the MCA stenosis condition. The results, using just the quoted average value, showed that the relative values of RoR in the mild stenosis (<50%) are 75.24%, that in the moderate stenosis (50%−69%) are 44.83%, and that in the severe stenosis (>70%) are 2.93%, all relative to baseline conditions. These strongly nonlinear relationships are well captured by our model, although it is difficult to perform a direct comparison given the wide ranges of values quoted in the experimental studies and the very strongly nonlinear relationship shown.
Wang et al (2015) used phase difference to quantify dCA and obtained similar results, in that dCA was found to be impaired at severe unilateral MCA stenosis measured in the ipsilateral MCA. The results, using the averaged values, showed that the relative phase differences in the mild stenosis (<50%) are 73.28%, that in the moderate stenosis (50%−69%) are 80.14%, and that in the severe (>70%) asymptomatic and symptomatic stenosis are 47.67% and 22.63%, all relative to baseline. It is again difficult to compare these results directly with ours, but as above a strong nonlinear relationship is shown with a sharp drop-off as the degree of stenosis increases.
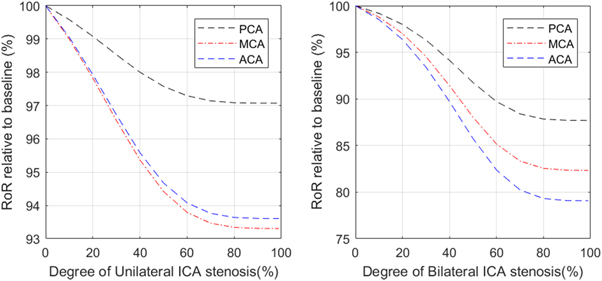
We next performed simulations with both unilateral and bilateral ICA stenosis to investigate its effect on the dCA measured in all three branches (PCA, MCA, and ACA). The results are shown in figure 6. Although the decrease in dCA (as measured by RoR) occurs even for small degrees of stenosis, the range of change in RoR is much smaller than was shown in the previous results for MCA stenosis, indicating that ICA stenosis has a much smaller impact on dCA than MCA stenosis.
Figure 6. The relationship between RoR and degree of unilateral (LHS) and bilateral (RHS) ICA stenosis, measured at PCA, MCA, and ACA.
Download figure:
Standard image High-resolution image
From the results, we find that both unilateral and bilateral ICA stenosis have a global effect on dCA in all the MCA, PCA and ACA. However, the effects are smaller, with even the bilateral stenosis having only a maximum reduction of 21% in dCA. dCA measured in the MCA has been found to be impaired with 75%–89% bilateral ICA stenosis and profoundly impaired with 90%–100% bilateral ICA stenosis by Reinhard et al (2003). This experimental study used phase shift calculated via TFA to represent the relationship between bilateral ICA stenosis and the degree of dCA impairment measured at the MCA. We also find that dCA is impaired, but not to the same degree as in the experimental studies. We also find that the impairment is different in each arterial branch: although the MCA and ACA show similar behaviour, the PCA is also affected but to a smaller degree.
To provide an initial validation of the clinically feasibility of our model, we rerun the simulations shown in figures 3, 5, and 6 with ±5%  variations while keeping other parameters the same (results shown in figures S1, S2, and S3 in the Supplementary Information). From these figures, we can clearly see that the results obtained here are largely insensitive to the precise value of
  and the trends remain the same, which provides reassurance on the potential future use of the model in clinical applications.
The results thus show that whilst stenosis in the MCA directly impairs dCA across the different vascular territories through the changes in flow conditions discussed earlier, with indirect effects less evident, stenosis in the ICA appears to cause a smaller direct effect on dCA with the changes observed experimentally needing the presence of a significant indirect effect to explain the large reductions in dCA. White and Markus (1997) quantified the relationship between unilateral ICA stenosis and the degree of dCA impairment measured at the ipsilateral MCA using ARI. Despite the positive relationship between these two factors, dCA was still found to be preserved in some patients (5/23) and the significant impairment was only found in a minority of cases (7/23) even in the severe ICA stenosis (>80%). The changes in ARI were found to be very significant, with ARI dropping from around 6 to below 3 for stenosis above 80%, which appears to be a much larger change than found in our simulations.
Discussion
In this study, we have used a mathematical model to simulate different stenosis conditions in order to investigate the question of whether dCA impairment in one large vessel leads to dCA impairment in other large vessels. We first conducted a simulation to study the relationship between the systematic arterial pressure and CBFV, in which we found that CBFV is preserved even in the most significant changes and that sCA is little affected by stenosis. We then performed simulations to study the spatial effect of stenosis in dCA, in which we found that both bilateral and unilateral stenosis in PCAs, MCAs, and ACAs largely only have a local influence, and that the stenosis degree is positively related to dCA impairment degree measured in the same artery. This finding is consistent with the conclusion of Chen et al however, both bilateral and unilateral ICA stenosis have a global influence, and bilateral stenosis can have a large impact on dCA impairment, which has also been shown by Reinhard et al (2003).
Reinhard et al used LF phase shift measured using TFA to represent the impairment degree of dCA. Their results show that LF phase shift is preserved (53.6 ± 33.7) in the 75%–89% bilateral ICA stenosis but is profoundly reduced (8.6 ± 15.6) in 90%–100% bilateral stenosis. A similar result is found in unilateral ICA stenosis. The phase shift value is preserved (53.2 ± 26.9) in the 75%–89% stenosis but is significantly reduced (30.1 ± 25.4) in 90%–100% stenosis. Although the LF phase shift in healthy subjects is not quoted, we still can measure the impairment degree of severe stenosis by comparing the phase shift value measured in the 90%–100% stenosis group with the value measured in the 75%–89% stenosis group since this value is preserved so that it can roughly be treated as the measured healthy control group. Therefore, the impairment degree measured in 90%–100% bilateral ICA stenosis is 83.96% and that measured in unilateral ICA stenosis is 43.42%. Compared with the results gained from our simulation, we do not find the same degree of impairment, but we also find that dCA is much more impaired in bilateral ICA stenosis than in unilateral ICA stenosis.
With the results given above, we can attempt to provide some insight into the spatial effects of dCA impairment. First, only severe stenosis can impair sCA but even this effect is small, indicating that sCA is very robust to the presence of stenosis. Second, stenosis in the PCA, MCA, and ACA only significantly affects dCA in the same artery. Although the dCA impairment degree is positively related to the stenosis degree, the CoW can largely function well due to its collateral pathways, and bilateral stenosis is not common (although it should be noted that we do not have information about the completeness of the CoW in these subjects and have assumed a complete CoW throughout in our numerical study). Finally, ICA stenosis can have a global effect, which indicates that ICA stenosis might be more likely to impact stroke response than stenosis in other arteries and should be more carefully studied in future.
One of the major difficulties in comparing our model predictions with experimental results is the wide variety of different metrics used to quantify dCA (there are of order several dozen available in the literature and even the relatively small number of stenosis studies use a substantial number). For example, Reinhard used the phase angle at low frequency, but this is very difficult to predict with a mathematical model (hence our choice of RoR to represent the impairment degree of dCA). This is a persistent problem with the metrics of dCA. In addition, the small number of studies (even though the numbers of subjects are large) means that not all the links between local stenosis and dCA in the different arterial branches have been experimentally measured, for example, there is no study that has investigated the effect of bilateral ICA stenosis on the PCA. Thus, we have restricted ourselves to considering two types of stenosis to quantify the relationships between dCA in the different large vessels.
There are three major limitations in this study. First, we adopted the multiscale mathematical cerebral autoregulation model that we previously proposed without further refinement. Many physiological mechanisms including intercellular conduction reaction, neural control, and metabolic mechanisms are not considered here. The reason that we adopted our previous model, however, is that it provides a simple but physiological way in which to compare different results. Second, we made a series of simplifications and assumptions when we incorporated the CoW into our existing CA model. For example, as mentioned previously in this paper, we assume that the initial resistance values of Rsv and Rlv in every large arterial segment share the same ratios (Tong et al 2021): we assume that the M2 part of the MCA consists of 90% of the total resistance as it contributes the major part of the vessel, and we also assume that stenosis happens essentially simultaneously both in 1 and 2 parts in each large arterial stenosis in our simulations. These assumptions may not be perfectly consistent with the actual physiological conditions but are sufficient in this study to provide an initial insight into the regional behaviour of dCA. Lastly, our conclusion for the spatial variation effect of stenosis may lack direct support from physiological experiments as there is little research on the global effect of stenosis in the existing literature.
With these limitations, future works can focus on the refinement of the CA and stenosis model and further validation with more clinical data. In detail, we can add further detailed elements of CA, for example, including the effects of heart rate (Deegan et al
2010) and CO2 levels (Meng and Gelb 2014), to establish more compartmental models to achieve a better prediction of CA. We can also refine the assumptions regarding stenosis that we adopted in this study with more accurate physiological parameters. Moreover, with more studies on the global effect of stenosis, we can further refine our prediction and analyse the sensitivity of our model with all parameters. We can also perform a detailed validation by recording simultaneous TCD recordings in multiple large vessels in both healthy controls and patient groups if data become available in the future. We can establish a 3D CFD model to better understand the spatial effect of stenosis on dCA based on the work done by Kaufmann et al (2012), Neidlin et al (2014), and Ferrandez et al (2002). Although in our paper, a sensitivity analysis has been conducted and the ±5%  variation has been simulated to verify our model's feasibility, this model of course still needs to be further tested with more parameter variations to show that the generalisability of the trends is the same even with the variation, in order to determine its potential clinical applicability. Moreover, we will consider the transfer function approach including gain, phase, and coherence function, as this is commonly used in dCA analysis, in our future work to improve standardisation of dCA measurement to use our model clinically.
Conclusion
In this paper, we have proposed a new model of CA and systematically investigated the spatial effects in dCA with the presence of stenosis when measured in different arteries. With the results obtained from our simulation, we find that both sCA and dCA can be affected by stenosis. For sCA, we find that it is only minimally impaired even with severe stenosis. For dCA, we find that it is predominantly locally influenced rather than globally influenced by stenosis and that it can be fully impaired either with the appearance of 100% stenosis measured in the same large artery (PCA, MCA, and ACA), or with ICA stenosis, which has a global effect. In brief, our study gives a preliminary prediction of spatial effects of stenosis in CA and introduces an insight for future physiological studies. The data used in this paper is shown in the
Data availability statement
All data that support the findings of this study are included within the article (and any supplementary information files).
Appendix
Table 2. The parameters of each arterial segment and calculated value of initial resistance.
| Arterial segment | Length (cm) | Initial inner radius (cm) | Initial resistance (mmHg s ml−1) |
|---|---|---|---|
| ACoA | 0.3 | 0.074 | 0.8599 |
| R.ACA,A2 | 10.3 | 0.120 | 4.2694 |
| L.ACA,A2 | 10.3 | 0.120 | 4.2694 |
| R.ACA,A1 | 1.2 | 0.117 | 0.5504 |
| M.ACA,A1 | 1.2 | 0.117 | 0.5504 |
| R.MCA | 11.9 | 0.143 | 2.4460 |
| L.MCA | 11.9 | 0.143 | 2.4460 |
| R.ICA | 17.7 | 0.200 | 0.9508 |
| L.ICA | 17.7 | 0.200 | 0.9508 |
| R.PCoA | 1.5 | 0.073 | 4.5400 |
| L.PCoA | 1.5 | 0.073 | 4.5400 |
| R.PCA,P2 | 8.6 | 0.105 | 6.0813 |
| L.PCA,P2 | 8.6 | 0.105 | 6.0813 |
| R.PCA,P1 | 0.5 | 0.107 | 0.3279 |
| L.PCA,P1 | 0.5 | 0.107 | 0.3279 |
| BA | 2.9 | 0.162 | 0.3619 |
| R.VA | 14.8 | 0.136 | 3.7185 |
| L.VA | 14.8 | 0.136 | 3.7185 |
Table 3. The value of venous resistances in each peripheral resistance.
| Arterial segment | Rv (mmHg s ml−1) | Rsv (mmHg s ml−1) | Rlv (mmHg s ml−1) |
|---|---|---|---|
| MCAs | 12.18 | 8.55 | 3.63 |
| PCAs | 22.61 | 15.88 | 6.73 |
| ACAs | 17.30 | 12.15 | 5.15 |
Supplementary data (0.4 MB DOCX)