
Abstract
Objective. Although the Zika virus (ZIKV) seems to be prominently neurotropic, there are some reports of involvement of other organs, particularly the heart. Of special concern are those children exposed prenatally to ZIKV and born without microcephaly or other congenital anomalies. Electrocardiogram (ECG)—derived heart rate variability (HRV) metrics represent an attractive, low-cost, widely deployable tool for early identification of developmental functional alterations in exposed children born without such overt clinical symptoms. We hypothesized that HRV in such children would yield a biomarker of fetal ZIKV exposure. Our objective was to test this hypothesis in young children exposed to ZIKV during pregnancy. Approach. We investigated the HRV properties of 21 children aged 4–25 months from Brazil. The infants were divided into two groups, the ZIKV-exposed (n = 13) and controls (n = 8). Single-channel ECG was recorded in each child at ∼15 months of age and HRV was analyzed in 5 min segments to provide a comprehensive characterization of the degree of variability and complexity of the heart rate. Main results. Using a cubic support vector machine classifier we identified babies as Zika cases or controls with a negative predictive value of 92% and a positive predictive value of 86%. Our results show that a machine learning model derived from HRV metrics can help differentiate between ZIKV-affected, yet asymptomatic, and non-ZIKV-exposed babies. We identified the box count as the best HRV metric in this study allowing such differentiation, regardless of the presence of microcephaly. Significance. We show that it is feasible to measure HRV in infants and toddlers using a small non-invasive portable ECG device and that such an approach may uncover the memory of in utero exposure to ZIKV. We discuss putative mechanisms. This approach may be useful for future studies and low-cost screening tools involving this challenging to examine population.
Export citation and abstract BibTeX RIS
Introduction
The sudden outbreak of children being born with microcephaly in Brazil in 2015 led to the identification of a new teratogen in humans: the Zika virus (ZIKV) (Rasmussen et al 2016, Schuler-Faccini et al 2016). A specific pattern of 'fetal brain disruption sequence' (Russell et al 1984) with a small skull and pronounced craniofacial disproportion, overlapping cranial sutures, occipital prominence and redundant skin in the head and neck, joint contractures, and severe neurological impairments was described, and brain imaging (CT scan or MRI) presenting multiple calcifications, poor and abnormal gyral patterns, increased intracranial fluid, and cortical destruction (Del Campo et al 2017, Moore et al 2017). However, there is a spectrum of less severe abnormalities after congenital ZIKV exposure including postnatal microcephaly, hydrocephalus, brain calcifications, ophthalmic alterations, seizures, and other neurological dysfunctions (van der Linden et al 2016, Aragao et al 2017, Zin et al 2017).
Although ZIKV seems to be prominently neurotropic, there are some reports of involvement of other organs, particularly the heart. Cavalcanti et al found 14/103 (13.5%) Brazilian children with congenital zika syndrome (CZS) to present with echocardiograms compatible with congenital heart disease (Di Cavalcanti et al 2017). Most of them, however, were septal defects with no hemodynamic significance. Similarly, Orofino et al reported 13/97 (10.8%) major cardiac defects (atrial septal defect, ventricular septal defect, patent ductus arteriosus) on echocardiographic exams in infants with confirmed ZIKV exposure (Orofino et al 2018). None of the defects were severe, i.e. without relevant hemodynamic significance. It is not known whether intrauterine exposure to ZIKV leaves any more subtle yet lasting developmental physiological imprints on a child's cardiac activity.
Of special concern are those children exposed prenatally to ZIKV born with no microcephaly or other congenital anomaly at birth. Electrocardiogram (ECG)—derived heart rate variability (HRV) metrics represent an attractive, low-cost, widely deployable tool for early postnatal identification of developmental functional alterations in exposed children born without such overt clinical symptoms.
Following our early preprint publication of this work,(Herry et al 2018) a report in a cohort of 15 infants with vertical exposure to ZIKV was published (Orofino et al 2020). Using conventional group statistical comparisons and 24 h Holter recordings with at least 18 h of clean ECG, the authors showed that SDNN, a linear domain statistical measure of HRV, is reduced in infants with severe microcephaly or in infants with CZS. While this study did not provide a diagnostic metric for early identification of asymptomatic infants exposed to ZIKV in utero, it indicated the potential of HRV for early screening of such exposures.
We hypothesized that ECG-derived HRV in such children, even when asymptomatic, would yield a biomarker of fetal ZIKV exposure.
Methods
The study was approved by the local Ethics Board (CAAE: 56176616.2.1001.5327). This was a convenience sample from a group of children being followed by us according to the guidelines of the Surveillance and Response Protocol published by the Brazilian Ministry of Health Anon (2016). All mothers or legal guardians of infants provided full written informed consent for data collection and registration.
Recruitment
We investigated the HRV properties of 21 infants aged 4–25 months from Brazil. Congenital infections were diagnosed using the following criteria: (1) ZIKV: confirmed by maternal real-time polymerase chain reaction (RT-PCR) result (in the blood) consistent with ZIKV disease during pregnancy; (2) cytomegalovirus (CMV): confirmed by positive RT-PCR in the urine of the baby.
The infants were divided into two groups, the ZIKV-exposed and controls: (1) group with ZIKV maternal infection during pregnancy (n = 13) and (2) a control group (n = 8) of children with other diagnoses reported to authorities due to microcephaly (4 congenital infection, 1 genetic syndrome, 1 small for gestational age—normal development; 2 normal infants). In the exposed group, two were diagnosed with CZS with severe microcephaly. The remaining 11 children were born with normal head circumference (HC), but to the mothers with RT-PCR confirmed ZIKV infection during pregnancy (n = 9) or probable ZIKV infection by clinical/epidemiological criteria (n = 2). Symptoms of ZIKV in this sample were in the first trimester of pregnancy (n = 3); second (n = 6) and third (n = 4).
Data acquisition
Single-channel ECG was recorded at 1000 Hz sampling rate in each child at ∼15 months of age using the Zephyr device (Zephyr Technology Corporation, Annapolis, MD) for 20 min on average. The recording was performed in the morning, before the clinical examination with the baby held by the mother in the upright position in her lap. The baby/infant was calm and awake. We aimed to exclude children who got too agitated or with excessive crying. In the presented data, one child was excluded because its recording was too short (<1 min).
HRV analysis
R-peaks were extracted automatically from the ECG recordings in order to create R-peak to R-peak interval time series (Elgendi 2013). Non-stationarity was assessed for each window and windows deemed non-stationary were excluded from the analysis. The R-peak locations were visually inspected to make sure the detection algorithm worked correctly. Noisy portions (saturated, very noisy periods) were discarded from the subsequent analysis. Only continuous 5 min windows with no gaps were used for the analysis. The 5 min windows where variability analysis could not be calculated because of gaps or noise were discarded from the summary analysis. Overall, the quality of the recordings was very high. Consequently, on average, around 15 min of ECG recordings were usable for the HRV analysis.
Using the well-established continuous individualized multi-organ variability system, the HRV analysis was done using 5 min moving windows and 2.5 min overlap and a set of 48 variability metrics were calculated for each 5 min window, in order to provide a comprehensive characterization of the degree of variability and complexity of the heart rate (tables 1 and S1) (Bravi et al 2011, Durosier et al 2015). Each HRV metric was then averaged overall 5 min windows.
Table 1. Physiological classification of heart rate variability metrics (reproduced from Frasch et al 2019) a .
| Time-domain metrics: | |||
|---|---|---|---|
| Simple statistical description of variability in the time domain | |||
| Metric name | Description and meaning | Meaning of change | References |
| CoV | Coefficient of variation: standard deviation normalized by the mean | Small = low variability | Anon (1996), Sassi et al (2015) |
| histSI | Similarity index between the statistical distribution of two consecutive data blocks | Small = more complex | Huang et al (2008) |
| Hjorth's complexity | Measure of 'excessive details with reference to sine wave', assesses complexity in the signal | Small = less complex | Hjorth (1970, 1973) |
| Spectral content: | |||
| Quantification of the power in different frequency bands | |||
| LF power | Power contained in the low frequency band (0.04–0.2 Hz for fetal recordings) of the ECG spectrum. Reflects both sympathetic and vagal activity, and blood pressure regulation via baroreceptors | Small = less power | Press and Rybicki (1989), Anon (1996), Sassi et al (2015) |
| HF power | Power contained in the high frequency band (0.2–2 Hz for fetal recordings) of the ECG spectrum. Mostly reflects vagal modulation of HR and is related to the respiratory cycle | Small = less power | Press and Rybicki (1989), Anon (1996), Sassi et al (2015) |
| LF/HF ratio | Represents sympathetic and parasympathetic modulation but its interpretation is experiment dependent and unclear in general | Small = less power | Press and Rybicki (1989), Anon (1996), Sassi et al (2015) |
| VLF power | Power in the very low frequency band (0.003–0.04 Hz). Thought to relate to thermoregulation and to be sympathetically mediated | Small = less power | Press and Rybicki (1989) Anon (1996), Sassi et al (2015) |
| Poincaré plot analysis: | |||
| Recurrence map analysis with a delay of one normal–normal (NN) interval, i.e. scatter plot of NNn+1 against NNn | |||
| SD1 | Standard deviation perpendicular the line of identity. Represents short interval variations and reflects parasympathetic index of sinus node control. Equivalent to RMSSD | Small = low variability | Brennan et al (2001b), Sassi et al (2015) |
| SD2 | Standard deviation along the line of identity. Represents long interval variation and is linked to both parasympathetic and sympathetic tones. Related to standard deviation | Small = low variability | Brennan et al (2001b), Sassi et al (2015) |
| CSI | Cardiac sympathetic index: Ratio between SD2 and SD1, represents unpredictability of the RR time series | Small = more random/scattered | Toichi et al (1997) |
| CVI | Cardiac vagal index: log of the area of the ellipse fitted to Poincare plot, i.e. total variability | Small = low variability | Toichi et al (1997) |
| Entropies: | |||
| Quantification of the amount and rate of production of information of a signal; assesses regularity/predictability | |||
| shannEn | Shannon entropy: average information content of a signal | Small = less complex | Shannon (1948) |
| QSE | Quadratic sample entropy: sample entropy normalized to standard deviation. Represents signal unpredictability/ regularity within short-time segments | Small = less complex | Lake and Moorman (2010) |
| Multiscale entropy | Sample entropy over multiple scales | Small = less complex | Costa et al (2008) |
| KLPE | Kullback Leibler permutation entropy indicating deviation from randomness and predictability of the system | Small = more complex | Frank et al (2006) |
| ARerr | Predictive error from an autoregressive model, assessed predictability | Small = low variability | Kampouraki et al (2009) |
| Indices of fractality: | |||
| Metrics quantifying self-similarity and fractal- or multifractal-like behaviors | |||
| aFdP | Describes fractal-like point processes via a modified estimate of the Allan factor based on the average distance to a homogeneous Poisson point process | Small = less complex | Turcott and Teich (1996) |
| fFdP | Describes fractal-like point processes via a modified estimate of the Fano factor, based on the average distance to a homogeneous Poisson point process | Small = less complex | Turcott and Teich (1996) |
| IoV | Describes degree of variability at multiple time scales. For a self-similar process, IoV is equivalent to a Hurst parameter at multiple time scales | Small = less complex | Lazarou et al (2009) |
| MultiFractal C1 | Maximum of the multifractal spectrum that can be viewed as the most common variability within a window, similar to a global variability | Small = more variability | Wendt et al (2007), Doret et al (2011) |
| MultiFractal C2 | Width of the multifractal spectrum, i.e. how variability departs from C1 value. Small C2 = variability changes little over time | Small = less variability | Wendt et al (2007), Doret et al (2011) |
| Correlation dimension | Overall complexity; related to fractal dimension; minimum number of variables required to characterize system dynamics | Small = less complex | Grassberger and Procaccia (1983) |
| DFA α1 | Scaling analysis method representing short-term correlation properties. Thought to reflect baroreceptor reflex and parasympathetic modulation | Rough ≈ 0.5 smooth ≈ 1.5 healthy ≈ 1 | Peng et al (1993, 1995), Delignieres et al (2006), Silva et al (2017) |
| DFA α2 | Scaling analysis method representing long-term correlation properties. Thought to reflect beat cycle regulatory mechanisms and autonomic modulation. Related to the Hurst exponent | Rough ≈ 0.5 smooth ≈ 1.5 healthy ≈ 1 | Peng et al (1993, 1995), Delignieres et al (2006), Silva et al (2017) |
| DFA AUC | Area under the DFA curve estimating the total variance of the signal across time scales | Small = low variability | Bravi et al (2011) |
| Power law slope | Slope of the linear portion of the power spectrum on a log–log plot. Represents long-term scaling of fractal-like processes with long-range dependence (i.e. 1/f power-law exponent) | Small = less complex | Press and Rybicki (1989), Anon (1996), Delignieres et al (2006) |
| Hurst exponent | Index of long-range dependence and related to the fractal dimension of a system, i.e. the minimum number of degrees of freedom of the dynamical system. | Small = higher fractal dimension | Delignieres et al (2006) |
| AsymI | Degree of temporal asymmetry and lack of invariance of the statistical properties of a signal; pathologic signals are more symmetric than healthy ones | Small = less complex | Costa et al (2008) |
| Chaos: | |||
| Quantification of chaotic and stochastic behaviors | |||
| SDLEalpha | Estimates the (negative) slope of Lyapunov exponents at multiple scales on a log–log plot. Characterizes the speed of loss of information, i.e. the uncertainty involved in predicting the value of a random variable | Steeper slope = more complex | Gao et al (2006, 2013), Hu et al (2010) |
| Box count (gcount) | Trajectory of a dynamical system is represented on a discrete grid and the number of 'visited' pixels is counted. Represents the degree of complexity or chaotic dimension | Small = less complex | Roopaei et al (2010) |
| sgridAND | Estimates similarity between discretized delayed versions of dynamical system trajectories. Measures spread of trajectories and their similarity between two time instants | Small = low variability | Roopaei et al (2010) |
| Nonlinear energy operators: | |||
| Metrics characterizing local energy distribution in a signal | |||
| Teo | Teager energy operator average energy: estimates local energy of a signal (related to that of a sine wave) and identifies portions with high energy | Small = low variability | Kaiser (1990), Ruffo et al (2010) |
| PSeo | Plotkin and Swamy energy operator average energy: generalized version of the Teager's operator | Small = low variability | Agarwal et al (1998) |
| Recurrence quantification analysis (RQA): | |||
| Quantification of patterns on a recurrence plot, which is a visualization of the recurrent states of a dynamical system. RQA assesses periodicity, chaos, laminarity and recurrences. | |||
| pD | % of recurrent points forming diagonal lines, with a minimum of two adjacent points (deterministic). Measures predictability | Small = more chaotic | Webber and Zbilut (1994), Marwan et al (2002) |
| pDpR | Ratio of %determinism over %recurrence. Quantifies transition/non-stationary periods in a system. | Small = more stationary | Webber and Zbilut (1994), Marwan et al (2002) |
| pL | % of Laminarity, i.e. laminar states (chaos–chaos transitions) and rapid changes in RR intervals | Small = more complex | Webber and Zbilut (1994), Marwan et al (2002) |
| pR | % of recurrence (global measure of recurrence). Periodic dynamics have higher % of recurrence than aperiodic dynamics | Small = more complex | Webber and Zbilut (1994), Marwan et al (2002) |
| dlmax | Max length of diagonal structures, representing exponential divergence of the trajectories. Detects transitions from periodic to chaotic behavior and Inversely related to largest Lyapunov exponent | Small = more chaotic | Webber and Zbilut (1994), Marwan et al (2002) |
| dlmean | Average length of the diagonal structures. Mean prediction time of the system | Small = more chaotic | Webber and Zbilut (1994), Marwan et al (2002) |
| tTime | Trapping time: average length of vertical lines. Information about the frequency of the laminar states and their durations | Small = more chaotic | Webber and Zbilut (1994), Marwan et al (2002) |
| sedl | Shannon entropy of the diagonals. Rough measure of the information content of the trajectories (diagonal lines) on a recurrence plot | Small = less complex | Webber and Zbilut (1994), Marwan et al (2002) |
| sevl | Shannon entropy of the vertical lines. Rough measure of the information content of the trajectories (vertical lines) on a recurrence plot | Small = less complex | Webber and Zbilut (1994), Marwan et al (2002) |
| vlmax | Max length of vertical lines. Information about the time duration of the laminar states and marker of intermittency | Small = more chaotic | Webber and Zbilut (1994), Marwan et al (2002) |
| Symbolic dynamics | |||
| Description of a system's dynamics with a limited number of symbols, amounting to a coarse-graining of the dynamics and describing global short-time dynamics | |||
| SymDce_2 | Modified conditional entropy: Characterizes entropy rate | Small = less complex | Voss et al (1996), Porta et al (2001) |
| SymDfw_2 | Number of forbidden words. A high number of forbidden words indicates a more regular behavior of time series | Small = more complex | Voss et al (1996), Porta et al (2001) |
| SymDp0_2 | Patterns with no variation, i.e. all the symbols are equal. Thought to reflect to cardiac autonomic modulation, predominantly sympathetic modulation | Small = more complex | Voss et al (1996), Porta et al (2001, 2007), Guzzetti et al (2005) |
| SymDp1_2 | Patterns with 1 variation, i.e. two consecutive symbols are equal and the remaining one is different | Small = less complex | Voss et al (1996), Porta et al (2001, 2007), Guzzetti et al 2005 ) |
| SymDp2_2 | Patterns with 2 variations (either like or unlike variations). Thought to reflect cardiac autonomic modulation, predominantly parasympathetic modulation | Small = less complex | Voss et al (1996), Porta et al ( 2001, 2007), Guzzetti et al 2005) |
| SymDse_2 | Shannon entropy of patterns: Characterizes entropy, i.e. complexity of the pattern distribution | Small = less complex | Voss et al (1996), Porta et al (2001, 2007), Guzzetti et al (2005) |
a Small = low variability means small value of the variability metric means lower variability. This is to enable a fair comparison between HRV metrics as some metrics are inversely related to the concept of variability (i.e. they decrease when variability increases).
The HRV metrics used were described elsewhere in detail and can be accessed freely; for this reason, we do not repeat this information here (Bravi et al 2011, Frasch 2019, Frasch et al 2019, Herry et al 2019). The information is also available on GitHub as table S1 ('Abbreviations and meaning of HRV metrics') (https://github.com/martinfrasch/vagus_HRV_code).
Classification
A cubic support vector machine (SVM) classifier was used to classify babies as Zika cases or controls. The SVM kernel was scaled automatically and we used a regularization factor of 1. A 100 repeat, five-fold cross-validation process was used to select the best single variability metric and estimate the performance of the cubic SVM classifier on the 20 subjects to estimate classification performance. A single metric was selected due to the limited sample size.
Both HRV processing and classification were implemented in Matlab R2016b (Mathworks Inc.).
Statistical analysis
Clinical features were compared using Fisher's exact test. Kolmogorov–Smirnov test was used to check for normality of distribution. Parametric (t-test) or non-parametric tests (Mann–Whitney U or Wilcoxon rank-sum) were performed as appropriate. Multiple linear regression analysis using age and group (case/control) as independent variables was used to account for the effect of age on the difference between ZIKV and non-ZIKV-exposed subjects. Multiple comparisons correction was made with the false discovery rate method (Benjamini and Yekutieli 2001). P value smaller than 0.05 was assumed to reflect a statistically significant difference. Following the above-described classification approach, Area under the Receiver Operating Curve, sensitivity, specificity, negative predictive, and positive predictive values were computed to estimate the performance of the cubic SVM classifier.
Results
The clinical characteristics of the cohort are summarized in table 2. There were fewer microcephalic children in the ZIKV-exposed group and they were older during the ECG recording than the control group. Other characteristics were similar.
Table 2. Clinical features among ZIKV-exposed babies and controls.
| Controls (Total n = 7) | ZIKV-exposed (Total n = 13) | ||
|---|---|---|---|
| N% | N% | p a | |
| Sex male | 6 (85.7%) | 7 (53.8%) | 0.329 |
| Microcephaly | 7 (100.0%) | 2 (15.3%) | 0.001 |
| Age at heart exam | |||
| 4–12 months | 5 (71.4%) | 0 | 0.001 |
| 13–24 months | 2 (28.6%) | 13 (100%) | |
| Gestational age | |||
| ≤36 weeks | 2 (28.6%) | 2 (15.3%) | 0.587 |
| ≥37 weeks | 5 (71.4%) | 11 (84.6%) | |
| Head circumference Z-score | |||
| <−3 | 3 (42.9%) | 2 (15.3%) | 0.161 |
| −3 to −2 | 1 (14.3%) | 0 | |
| ≥−2 | 3 (42.9%) | 11 (84.6%) | |
| ZIKV symptoms | |||
| 1st trimester | — | 3 (23.0%) | |
| 2nd trimester | — | 6 (46.1%) | |
| 3rd trimester | — | 4 (30.7%) |
Of the HRV metrics studied, in direct comparison, three HRV metrics differed between the groups prior to correction for multiple comparisons: DFA alpha2, correlation dimension, and dlmax, and none differed after the correction (table 3).
Table 3. HRV metrics showing a difference between ZIKV-exposed and control subjects.
| Controls | ZIKV-exposed | p-value | |
|---|---|---|---|
| DFA α2 | 0.96 (±0.14) | 1.12 (±0.09) | 0.0089 |
| Correlation dimension | 5.20 (±1.41) | 4.23 (±1.10) | 0.0174 |
| dlmax | 0.03 (±0.01) | 0.05 (±0.02) | 0.0140 |
| Box count | 5.19 (±0.60) | 4.25 (±1.41) | 0.0961 |
Note. Mean (± standard deviation) of HRV metrics that were significantly different before correction for multiple comparisons (DFA α2, correlation dimension, dlmax) and box count.
Since ZIKV-exposed toddlers were older than controls, we examined the effect of age on our findings to account for the potential effects of maturation on our findings. To do this we included age and group as independent variables in a regression model to predict each HRV metric and found the following. Age was a significant predictor for a few HRV metrics (see table 1 for the review of HRV metrics studied): coefficient of variation, Poincare SD2, LF Power, DFA α2.
When correcting for age, the only HRV measures that were found to be significantly different between cases and controls were Shannon entropy, SymDse_2 and Hurst exponent.
Age and/or group were not significant predictors of correlation dimension and dlmax, which were found to differ significantly between the groups (before correction for multiple comparisons). Of note, age (or group) was not a significant predictor for box count.
None of the significant differences remain after correcting for multiple comparisons.
The machine learning approach using the SVM classifier yielded the best HRV metric to be the box count (sometimes also referred to grid count), a complexity metric derived from a grid transformation of a dynamical system trajectory (Roopaei et al 2010). The box count method divides the phase-space trajectory of the system (created with an embedding dimension of 2 and a delay of 5) into a grid (100 × 100 in our case) and counts the number of box pixels (or grids if one will) that are visited by the trajectory.
Results in the following table 4 are averaged overall repeats and folds of the cross-validation process. box count—based SVM classification performed at AUROC = 95%. On average, box count tended to be lower in the ZIKV-exposed infants compared to the control group (p = 0.096) (figure 1).
Table 4. Identification of ZIKV-exposed/control toddlers using HRV metric box count.
| AUC | SEN | SPE | NPV | PPV |
|---|---|---|---|---|
| 94.51% | 85.71% | 92.31% | 92.31% | 85.71% |
Note. AUC: area under the receiver operating curve; SEN: sensitivity; SPE: specificity; NPV: negative predictive value; PPV: positive predictive value.
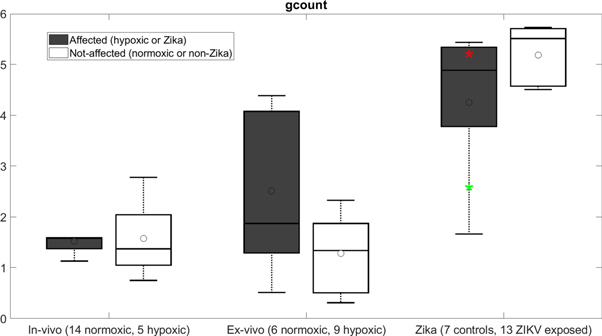
Figure 1. The discriminating HRV metric box count (gcount) is shown in hypoxic versus normoxic (both in vivo and ex vivo) near-term ovine fetuses (∼0.9 gestation) presented elsewhere (Durosier et al 2014, Xu et al 2014, Frasch et al 2017, 2019) and ZIKV-exposed versus control human cohorts. All recordings were performed at baseline conditions and analyzed in the same way. The rationale for this juxtaposition is the purported chronic hypoxic effect of ZIKV exposure on fetal development. See the discussion for details. Horizontal lines are median and open circles are mean. The box is the interquartile range. Outliers are not shown but 'whiskers' represent 95%. Red and green * represent the two cases of microcephaly in the ZIKV-exposed group. ZIKV-exposed versus control: p = 0.096; ZIKV-exposed versus in vivo hypoxic: p < 0.001; non-Zika control versus in vivo normoxic: p < 0.001. (All tests are Wilcoxon rank-sum tests.)
Download figure:
Standard image High-resolution image
Excluding the two ZIKV-exposed toddlers with microcephaly did not change these findings. Figure 1 shows that the box count metric of HRV for these two children was within the range of other ZIKV group subjects. We return to figure 1 in discussion where we discuss the changes in box count HRV metric in comparison to the previously published study in chronically hypoxic near-term sheep fetuses.
Discussion
Our results show that HRV metrics combined with a SVM learning approach can help differentiate between ZIKV-affected, yet asymptomatic, and non-ZIKV-exposed babies. We identified the box count as the best HRV metric in this study allowing such differentiation, regardless of the presence of microcephaly.
In contrast to Orofino et al (2020) where 18–24 h of ECG was used to compute HRV, here we identify ZIKV exposure using HRV derived from ECG recordings of only 20 min duration. Unlike in the present study, SDNN was reduced in infants with severe microcephaly or in infants with CZS compared to healthy controls (Orofino et al 2020). We did not find differences in the highly correlated SDNN equivalent, Poincaré SD2 metric of HRV, in the asymptomatic infants exposed to ZIKV in utero compared to controls (Brennan et al 2001a). These differences in SDNN behavior may reflect the underlying pathophysiological differences arising from the symptomatic versus asymptomatic ZIKV exposures in the respective cohorts.
Future studies including a larger sample size will permit to possibly identify an even more precise subset of HRV metrics with regard to the ability to differentiate between ZIKV-exposed babies and controls.
Box count HRV metric of HRV: a memory of fetal chronic hypoxia?
Our finding aligns with the recently published study in near-term ex vivo fetal sheep hearts where we identified metrics of chaotic behavior and recurrence plots as correlated to left ventricular end-diastolic pressure and altered due to fetal chronic hypoxia (Frasch et al 2019).
ZIKV exposure in utero causes placental hypoperfusion (Hirsch et al 2018). Understanding that ZIKV exposure can create a chronic hypoxic environment for the fetus, in particular for the developing fetal heart, we can attempt to explain our HRV finding using figure 1 where we rendered the data from the present manuscript together with the previously published findings in chronically hypoxic and normoxic near-term fetal sheep model of human development (Durosier et al 2014, Xu et al 2014, Frasch et al 2019). All recordings in fetal sheep were done at baseline and the data was analyzed in the same way as in the present study. This allows us to make observations on the behavior of box count metric of HRV across fetal and early postnatal development and as a function of fetal chronic hypoxia.
First, albeit temporal profile of box count metric has not been studied in human development yet, we can expect with reasonable confidence based on the behavior of other HRV metrics (Van Leeuwen et al 1999) that the overall increase of the box count metric seen in figure 1 reflects physiological maturation of the dynamic interaction between the developing cardiac pacemaker cells and autonomic nervous system, i.e. increase in complexity of these systems. This dynamic interaction is further complicated by the hypoxia-induced sympathetic hyperactivity affecting both systems (Frasch et al 2019).
Second and most intriguingly, the relationship between the ZIKV-exposed children and controls is inverse compared to what we see ex vivo. In the setting of chronic fetal hypoxia, the box count appears to serve as a memory of in utero hypoxia in the intrinsic HRV ex vivo. Ex vivo, a removal of hypoxically triggered chronic sympathetic hyperactivity may manifest as a rise in box count. Increasing beta-adrenergic drive on cardiac pacemaker cells synchronizes their activity in acute mechanistic experiments (Yaniv et al 2014). These findings likely hold true for the synchronizing impact chronic sympathetic activity exerts on sinus node pacemaker cell coupling in vivo. Withdrawal of such driving input might be expected to result in a rebound of uncoupling which would explain the rise in box count.
Conversely, its developmental counterpart in vivo would behave in the opposite, because a postnatal intact innervated heart does not experience the rebound response we observe ex vivo. Along such lines of thought, chronic hypoxia with elevated sympathetic activity would continue on postnatally imprinting stronger cardiac pacemaker cell coupling and relatively lower box count (Frasch and Giussani 2020).
Can we stipulate a specific origin of the box count metric measured from HRV in vivo? As we discuss in Frasch et al (2019), a precise causal attribution to the developing autochthonic cardiac pacemaker cell activity giving rise to the intrinsic HRV or to the maturation of autonomic nervous system activity seems not possible at this time. This is due to the complexity of the system and the indirect method of measurement deployed here. Further dissection may be achieved in more reductionist approaches such as reported and discussed in the previous studies (Frasch et al 2019, Herry et al 2019).
In summary, box count metric of HRV may reflect the dynamic impact of ZIKV exposure-triggered fetal chronic hypoxia on the physiological maturation and the developmental trajectory of the cardiac pacemaker cells under the influence of the developing autonomic nervous system characterized by the hypoxia-triggered sympathetic hyperactivity.
Technical considerations
The question is frequently asked how it is possible that the statistical analysis of group differences between the HRV metrics and the machine learning-based binary classification approaches do not 'agree' as seems to be the case in the present study. Indeed, using statistical testing, box count differences between Zika-exposed and control group toddlers were found to be not statistically significant after adjustment for multiple comparisons, whereas using binary classification, high diagnostic accuracy was found for the box count-based SVM classifier in identifying the subjects from these groups. We suggest that there are two perspectives to seeing this finding. First, fundamentally, the statistical comparisons and the machine learning approaches are two distinct analyses. Their results must not agree with each other (Guyon and Elisseeff 2003). Second, in light of the pilot nature of the study and as we highlight below, albeit we may not have been powered for the statistical analysis, we submit that its presentation provides useful context for the presented SVM approach (see the third point in Limitations).
For the box count metric, the parameters used (embedding dimension and delay) depend on the overall dynamics of the signal used. In both the referenced paper (Roopaei et al 2010) and the present study, it is ECG. The method used in the referenced paper is an image-based method so the authors chose an embedding dimension of 2. We did not optimize that dimension as our modification of the grid size does not change the gist of the method: it is still an image-based processing method. Moreover, the embedded dimension was not optimized in the referenced paper either. The time delay was chosen based on a large internal (unpublished) database of ECG recordings and has not been optimized for this paper specifically. Although the clinical problem studied in the referenced paper is different, the task that the authors of that paper were attempting to do was to differentiate between two or more groups/conditions based on some specific chaotic features, which is the same task we are concerned within the present study albeit with a wider range of potential features.
We chose to exclude HRV metrics that were redundant or equivalent to measures present in table 1. For instance, RMSSD is equivalent to Poincaré SD1 and Poincaré SD2 is a nonlinear combination of SDNN and SDSD and otherwise mostly behaves like SDNN. We decided to keep the Poincaré plot measures to be consistent with other measures that we derive from Poincaré plot (CSI, CVI).
The terminology of time-domain analysis can be seen as ambiguous in our table as it might not refer to classical time-domain measures. However, despite their classification as correlates of complexity in the signal, histSI and Hjorth's complexity are derived from a time-domain analysis and were therefore included in that category.
Limitations
We acknowledge several limitations of this pilot study. First, there was some variance in ages during ECG recording which may have contributed to the difference in HRV metrics, because, as discussed above, HRV metrics may show a maturational increase (Javorka et al 2017). A counter-argument to a confounding effect of HRV maturation is that despite more cases of microcephaly, HC was similar in both groups. Despite these considerations, we state that the difficulty in enrolling children in that population and the pilot nature of this work ultimately meant that we were unable to age-match the control and case groups. This remains a limitation of our statistical analysis. However, we show that the putative influence of age, i.e. maturation, on the classification task turned out to be less pronounced than one might have expected. Notably, age was not a significant predictor for box count.
Second, there exists a wide range of gestational ages when the presence of ZIKV symptoms was reported. Future studies will need to show whether such a broad developmental window of exposure has a variable effect on the HRV phenotype. The more interesting is the impact on one particular HRV metric, box count, despite the wide developmental window of exposure. Considering that the pacemaker cell activity commences as early as 24 d of gestation (Weisbrod et al 2016), even early Zika exposure may result in similar effects we capture compared to late exposure. This is a speculation based on the current pilot study and warrants further investigations into how exposure to the virus during different trimesters impacts HRV.
Third, the small size of the dataset poses a limitation and the results need to be confirmed on a larger sample size. However, our study shows potential for differentiating between otherwise asymptomatic Zika and non-Zika babies. Overfitting was mitigated by using repeated cross-validation and limiting the number of features used in the model. Although we report results for a single-feature SVM, we tested all single and combination of two features, with limited improvements in test results, hence we chose to present the simplest model available. It is quite likely that a combination of features would perform better in a larger dataset and we will explore that in future work. However, we also note that statistically significant features do not guarantee optimal results in classification tasks and a combination of non-statistically significant features can outperform significant ones (Guyon and Elisseeff 2003). In the context of HRV, a combination of various HRV metrics may reflect the underlying code of brain-body communication (Herry et al 2019, Frasch 2020).
Lastly, two of the ZIKV-exposed babies presented with microcephaly, i.e. unlike the remaining eleven subjects, were clinically symptomatic. We confirmed that these two subjects had however no significant impact on our HRV findings.
Conclusion
We show that it is feasible to measure HRV in infants and toddlers using a small non-invasive portable ECG device and that such an approach may uncover the memory of in utero exposure to ZIKV using machine learning techniques. This approach may be useful for future studies involving this challenging-to-examine population. Future studies in fetuses of infected mothers could use the non-invasive transabdominal ECG to test if such HRV techniques can detect exposure to ZIKV as early as in utero.
Acknowledgments
Funded by the University of Washington Global Innovation Fund (UW GIF) (L S F, C H, M G F); Canadian Institutes of Health Research (M G F); Brazilian Ministry of Health, and by CNPq—Brazilian National Council of Research and Technology (L S F).
Findings
In a machine learning framework, box count metric of HRV serves as the best ECG-derived biomarker of fetal exposure to ZIKV with high classification performance.
Meaning
It is feasible to measure HRV in infants and toddlers using a small non-invasive portable ECG device. Such a screening approach may uncover the memory of in utero exposure to ZIKV.