
Abstract
Objective: The purpose of this study was to evaluate whether the complexity of the corneal pulse (CP) signal can be used to differentiate patients with primary open-angle glaucoma (POAG) from healthy subjects. Approach: The study sample consisted of 28 patients with POAG and a control, age-matched group of 30 subjects. After standard ophthalmic examination, the CP signal from a randomly selected eye of each participant was measured using non-contact ultrasonic micro-displacement measurement technology. After pre-processing, the complexity of the CP signal was estimated using refined composite multiscale fuzzy entropy (RCMFE) up to scale factor 50. The average RCMFE values were computed from three repeated measurements of the CP signals for each participant and each scale factor. Main results: The complexity of the CP signal in glaucomatous eyes was higher than that observed in healthy ones. Also, RCMFE of the CP signal was found to differentiate (statistically significantly) between the two groups for scales in the range from 26 to 43. For these scales, the one for which the lowest p-value (t-test, p = 0.017) was obtained when comparing RCMFE between the two groups was selected as the optimal scale. Next, a receiver operating characteristic analysis for the optimal scale showed that the proposed approach of calculating the multiscale entropy of the CP signal has some potential to discriminate between patients with POAG and healthy controls (sensitivity, specificity and accuracy of 0.643, 0.700 and 0.672, respectively). Significance: In conclusion, RCMFE, as a complexity measure, may be considered an auxiliary indicator to support glaucoma diagnostics.
Export citation and abstract BibTeX RIS

Content from this work may be used under the terms of the Creative Commons Attribution 4.0 licence. Any further distribution of this work must maintain attribution to the author(s) and the title of the work, journal citation and DOI.
1. Introduction
Corneal pulsation reflects temporal expansion of the cornea related to variations in intraocular pressure (IOP) and ocular circulation – a complex phenomenon called the ocular pulse (Zuckerman et al 1977, Silver et al 1989, Kiel 2011, Kowalska et al 2011). Characteristics of the corneal pulse (CP) signal measured with non-invasive methods reveal a high correlation with cardiovascular activity (Hørven and Nornes et al 1971, Trew et al 1991, Kasprzak and Iskander 2007, Danielewska et al 2012). In addition, it has been observed that the CP waveform changes with pathological alterations to the ocular blood supply (Hørven and Nornes et al 1971). The morphology of the CP signal was found to change with age (Danielewska et al 2014a) and more frequently in patients with glaucoma than in healthy individuals (Danielewska et al 2014b). These specific changes, in the form of a double-peak wave in the CP signal during one heart cycle, have been called the ocular dicrotic pulse (Danielewska et al 2014a) and are thought to correspond to higher ocular rigidity of glaucomatous eyes or alterations in their ocular hemodynamics. Furthermore, spectral analyses of the CP signal have proved to be useful for indirect assessment of biomechanical alterations in the cornea after canaloplasty (Danielewska et al 2019a, Danielewska et al 2019b). Taking all of the above into account, it is anticipated that the morphological parameters of the CP may support the diagnosis of glaucoma.
Analysis of the waveform morphology of ocular pulse signals, such as IOP (Asejczyk-Widlicka et al 2014, Evans et al 2002, Bozic et al 2012), pulsatile ocular blood flow (Pinto et al 2012), retinal displacement (Dion et al 2013) and corneal displacement (Danielewska et al 2014b), reveals the potential to discriminate between patients with glaucoma (or those suspected of having glaucoma) and normal subjects. For example, the pattern of blood flow velocity in the ophthalmic artery throughout the cardiac cycle was found to differ between glaucoma patients and healthy volunteers (Pinto et al 2012), and spectral analysis of the IOP pulse wave revealed differences between healthy and glaucomatous eyes (Asejczyk-Widlicka et al 2014). However, feature extraction from ocular pulse signals is not straightforward because they are irregular and non-stationary due to the variaiton of their spectral content in time, which is caused by changes in heart rate (Kasprzak and Iskander 2007). Therefore, the selection and application of an appropriate method for shape analysis of such signals requires careful consideration, especially with regard to interpretation of the chosen metrics and their potential impact on further clinical decision-making.
Shape analysis of ocular tissue displacements is particularly challenging. Specifically, the CP signal contains several artifacts, such as head movements, eye blinks and device measurement noise. Hence, applying the standard arithmetic averaging method to find the best representative shape of the cycles of such signals is not the correct approach. Efforts have been made to detect the ocular dicrotic pulse signal effectively without the need to acquire any additional cardiovascular signals. This can be achieved using the dynamic time warping method (Danielewska et al 2014a, 2014b), the family of beta cumulative distribution functions (Mirecki et al 2018) or conglomeration of a set of features based on a combination of the continuous wavelet transform representation of the CP signal (Melcer et al 2015).
There is still a need to find a particular feature of the CP signal that would enable glaucoma patients to be distinguished from healthy individuals without needing to explicitly identify the ocular dicrotic pulse signal or perform synchronous measurements of the cardiovascular signal. To address this we propose to utilize the multiscale entropy algorithm to evaluate signal complexity. Previous studies have shown that the entropy of various physiological signals is altered in a wide range of pathological conditions (Costa et al 2015, Azami et al 2017). Also, entropy of the CP signal has been used to study the influence of canaloplasty on changes in CP parameters in patients with primary open-angle glaucoma (POAG) (Danielewska et al 2018). The aim of this work is therefore to evaluate whether the complexity of the CP signal, assessed using multiscale entropy, could differentiate patients with POAG from healthy individuals.
2. Methods
The study was approved by the Bioethics Committee of the Military Institute of Medicine in Warsaw (decision no. 67/WIM/2015) and adhered to the tenets of the Declaration of Helsinki. Twenty-eight patients with POAG and 30 healthy age- and IOP-matched control subjects were included in the study. We purposely selected two groups of subjects with matching IOP to evaluate the potential of the proposed technique to differentiate healthy eyes and those affected by POAG when the confounding factor of IOP is removed.
Before any measurements, the purpose of the study and the study protocol were explained to the participants. Afterwards, written informed consent was obtained from all individuals. The past and current general medical history of all participants was reviewed. Participants underwent standard ophthalmic examination, including slit lamp biomicroscopy, indirect funduscopy, gonioscopy, IOP measurement with Goldmann tonometry and optical biometry using the IOL Master 700 (Carl Zeiss Meditec AG, Jena, Germany). Exclusion criteria were any previous ocular surgical procedure, conjunctival or intraocular inflammation, history of acute angle closure, any corneal abnormalities, and high myopia (spherical equivalent greater than 6 D).
Patients with POAG were taking antiglaucoma medications of four types, including beta-blockers (64%), prostaglandin analogues (86%), carbonic anhydrase inhibitors (36%) and alpha-2 adrenergic agonists (11%), in various combinations.
2.1. Corneal pulse measurement
The CP signals of a randomly selected glaucomatous eye in bilateral POAG patients and a randomly selected eye in healthy subjects were measured using a non-contact ultrasonic technique (Ultralab, Wrocław, Poland) (Licznerski et al 2011). The sensor was placed in a dedicated custom-designed holder mounted on a slit lamp and positioned in front of the central cornea of the subject within its working distance (around 12–15 mm). The ultrasonic system allowed 10 s of continuous data acquisition with the sampling frequency set to 400 Hz and in vivo registration of the CP amplitude with an accuracy below 1 µm (Licznerski et al 2011). For each eye, CP measurements were repeated five times. Next, three recordings of good quality that were not affected by eye blink artifacts, as evaluated by an expert, were chosen for further analysis. During the measurement, the subject's head movements were minimized using a belt that strapped the head to the frame of the ophthalmic headrest, and the subject was instructed to abstain from blinking and to fixate on a stationary target, set at his or her far point. Synchronously with the CP signal, the arterial blood pressure signal was measured using a CNAP Monitor 500 (CNSystems Medizintechnik GmbH, Graz, Austria).
2.2. Data analysis
Raw CP signals were first pre-processed by linear-trend removal and band-pass filtering in the range of 0.5–20 Hz. Then, the complexity of CP signals was assessed by the refined composite multiscale fuzzy entropy (RCMFE) method (Azami et al 2017). Briefly, RCMFE is defined as a sequence of fuzzy entropies (FuzEn) (Chen et al 2007) computed for selected scale factors, where consecutive scales correspond to decreasing granularity of the analyzed time series. RCMFE is a modification of the well-known multiscale entropy method (Costa et al 2002), which extends sample entropy to multiple scales. In both RCMFE and multiscale entropy, a coarse-grained time series associated with scale τ (τ > 1) is obtained by dividing the original time series into τ-sample-long non-overlapping segments and calculating a specific statistic (here the mean) for each of them. One of the limitations of classical multiscale entropy is that it may yield inaccurate estimates of entropy when applied to short signals. This problem is particularly noticeable for higher scales (Wu et al 2014), since a constructed coarse-grained time series corresponding to scale τ becomes, by definition, τ times shorter than the original one (Costa et al 2002). RCMFE tackles this limitation in two ways. Firstly, instead of estimating entropy for scale τ from only one coarse-grained time series, RCMFE estimates it using τ coarse-grained data sequences (Wu et al 2014). Secondly, RCMFE is based on FuzEn, which can provide stable and reliable results for relatively short time series, in contrast to sample entropy used in the classical multiscale entropy method.
Both sample entropy and FuzEn are defined as the negative natural logarithm of the conditional probability that two sequences similar for m consecutive data points will remain similar when the (m + 1)th point is included. What differentiates sample entropy and FuzEn is the way of assessing similarity between two vectors. Sample entropy does this using a criterion with a fixed threshold and a binary output, whereas FuzEn relies on a fuzzy function. A detailed description of calculating FuzEn is as follows. Having an N-sample-long time series  , m-sample-long zero-mean vectors are constructed as
  for
for  , where m is the embedding dimension. For a given m, the distance between any two such vectors is expressed as the maximum absolute difference of their corresponding components, i.e.
  , where
  , and their degree of similarity is evaluated via a fuzzy function:
where n and r are the power and the tolerance, respectively. As in the case of sample entropy, the total similarity φm
for a given m is calculated taking into account all pairs of different vectors  :
:

Finally, with φm and φm + 1 computed according to equation (2), FuzEn is defined as

The parameters for RCMFE were chosen as m = 2, n = 2 and r = 0.15SD, where SD is the standard deviation of the original time series (Azami et al 2017). Calculations were performed up to scale factor 50. Coarse-grained time series were obtained by computing mean values of consecutive samples of the original time series. The average values of RCMFE were calculated from three repeated measurements of the CP signals for each participant and each scale factor.
For each recording, mean arterial blood pressure was computed. Systolic and diastolic values of blood pressure were estimated by dividing 10 s recordings into segments of an empirically determined length , identifying the maximum and minimum value of pressure in each of them, and then averaging those values across all segments. Finally, representative values of the mean, systolic and diastolic blood pressure for each participant were obtained from three repeated recordings.
2.3. Statistical analysis
Since null hypotheses of normality of age, IOP, ocular biometric and blood pressure parameters, as well as the RCMFE obtained for each scale were not rejected by the Kolmogorov–Smirnov test, the values of these parameters were compared between the two groups using the unpaired two-tailed t-test. The significance level α was set to 0.05. Calculations were performed using SPSS 22.0 (SPSS, Inc., Chicago, IL, USA).
To check whether the RCMFE has the potential to discriminate healthy eyes from those with POAG, a receiver operating characteristic (ROC) curve was used to find the optimal value of threshold for RCMFE at the optimal scale factor  , i.e. the factor for which the lowest p-value had been obtained in the abovementioned t-test. The ROC analysis was performed in MATLAB (MathWorks, Inc., Natick, MA, USA).
3. Results
No statistically significant differences in age, IOP, ocular biometric or blood pressure parameters were found between patients with POAG and healthy group of subjects (see table 1). Illustrative time characteristics of the CP signals for a healthy subject and a POAG patient are shown in figure 1.
Table 1. Group demographics and clinical characteristics.
| Variables | POAG group | Healthy group | Group difference |
|---|---|---|---|
| (n = 28) | (n = 30) | ||
| Age (years) | 70 ± 6 | 66 ± 6 | t(56) = 0.874 |
| (60–78) | (55–76) | p = 0.386 | |
| Sex (female/male) |

| 17/13 | - |
| IOP (mmHg) | 17.2 ± 2.3 | 16.1 ± 1.8 | t(56) = 0.903 |
| (12.0–21.0) | (13.0–20.0) | p = 0.370 | |
| CCT (µm) | 531 ± 30 | 533 ± 42 | t(56) = 0.085 |
| (481–595) | (460–630) | p = 0.933 | |
| ACD (mm) | 3.10 ± 0.35 | 2.97 ± 0.34 | t(56) = 1.673 |
| (2.53–3.79) | (2.22–3.67) | p = 0.100 | |
| AL (mm) | 23.27 ± 0.99 | 23.15 ± 0.80 | t(56) = 0.578 |
| (21.76–25.44) | (21.54–24.49) | p = 0.566 | |
| MD (dB) | −4.69 ± 3.00 | – | – |
| (−0.92 to −13.29 ) | |||
| PSD (dB) | 4.56 ± 2.52 | – | – |
| (1.65–10.32) | |||
| SBP (mmHg) | 145 ± 18 | 139 ± 19 | t(56) = 1.857 |
| (123–177) | (102–172) | p = 0.069 | |
| DBP (mmHg) | 83 ± 9 | 80 ± 8 | t(56) = 1.841 |
| (68–97) | (64–105) | p = 0.071 | |
| MAP (mmHg) | 105 ± 9 | 102 ± 11 | t(56) = 1.707 |
| (91–119) | (79–126) | p = 0.093 |
*Values are presented as mean ± standard deviation (range). Results of unpaired two-tailed t-test. ACD, anterior chamber depth; AL, axial length; CCT, central cornea thickness; DBP, diastolic blood pressure; IOP, intraocular pressure; MAP, mean arterial pressure; MD, visual field mean deviation; PSD, visual field pattern standard deviation; SBP, systolic blood pressure.
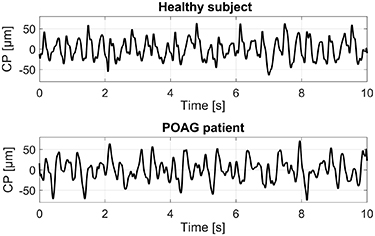
Figure 1. Illustrative corneal pulse (CP) signals for a healthy subject and a patient with primary open-angle glaucoma (POAG).
Download figure:
Standard image High-resolution imageGroup-averaged values of RCMFE represented as a function of scale factor in the two groups are shown in figure 2(a), whereas the results of the statistical comparison between the two groups for consecutive scale factors are presented in figure 2(b). Note that mean values of RCMFE are statistically significantly different between the groups for scales in the range of 26–43, where the lowest p-value (p = 0.017) was found at the scale factor of  . The result of the unpaired t-test applied for mean values of RCMFE computed at scale
  for the two groups is shown in figure 3.

Figure 2. Refined composite multiscale fuzzy entropy of the corneal pulse signal. (a) Mean values of RCMFE ± 1.96 standard error of means for primary open-angle glaucoma (POAG) patients and healthy subjects. For better visibility, only even numbers of the scale factor are shown. (b) p-values resulting from the comparison between the two groups for each scale factor using the unpaired t-test.
Download figure:
Standard image High-resolution image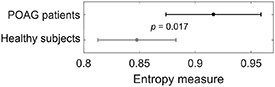
Figure 3. Mean values of refined composite multiscale fuzzy entropy ± 1.96 standard error of means at the scale factor  for the two groups (POAG, primary open-angle glaucoma).
Download figure:
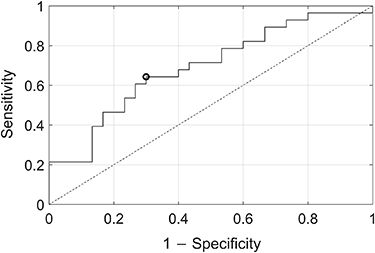
Standard image High-resolution imageFigure 4 shows a ROC curve for RCMFE. The area under the ROC curve achieved a value of 0.691. The threshold that corresponds to the optimal operating point was RCMFE = 0.909, with a sensitivity and specificity of 0.643 and 0.700, respectively, and an accuracy of 0.672.
Figure 4. Receiver operating characteristic curve showing the performance of refined composite multiscale fuzzy entropy to discriminate between primary open-angle glaucoma patients and healthy individuals. The black circle denotes the optimal operating point.
Download figure:
Standard image High-resolution image
4. Discussion
Eye dynamics changes with age and even more with the progression of glaucoma (Danielewska et al 2014a, Danielewska et al 2014b, Bozic et al 2012, Dion et al 2013, Hommer et al 2008). It is reflected in alterations of the characteristics of ocular pulse signals, such as the IOP (Silver et al 1989, Dastiridou et al 2009), pulsatile ocular blood flow (Silver et al 1989, Schmetterer and Kiel 2012), and pulsatile corneal and retinal displacements (Kowalska et al 2011, Dion et al 2013, Schmetterer et al 1955, Zuckerman et al 1977, and Kasprzak 2006). Several invasive and non-invasive techniques have been applied to characterize eye dynamics in glaucoma patients and age-matched subjects, pointing at higher stiffness of glaucomatous eyes (Hommer et al 2008, Ebneter et al 2009). For example, the ocular rigidity coefficient calculated from amplitudes of the IOP waveform and fundus pulsation, measured with pneumotonometry and laser interferometry, respectively, revealed significantly higher values in POAG patients than in controls (Hommer et al 2008). Furthermore, waveforms of pulsatile ocular blood flow signals were found to be altered in patients with glaucoma (Dion et al 2013, Shiga et al 2013). The morphology of the CP signal, measured with a non-contact ultrasonic technique, was also shown to change in glaucoma patients with respect to healthy controls. This phenomenon has been described as ocular dicrotism (Danielewska et al 2014b). However, up to now, all studies investigating corneal pulsation have presented the analysis of the CP signal waveform in inherent dependence on the cardiovascular signals. This study circumvents the need to measure additional cardiovascular signals and presents an assessment of complexity of the CP signal as a potential method to differentiate POAG patients from healthy individuals. Hence, the proposed approach of calculating the multiscale entropy of the CP signal alone may offer a new, auxiliary indicator in glaucoma diagnostics.
According to the theory of loss of complexity in aging and disease, complexity usually breaks down with aging (Goldberger et al 2002, Lipsitz and Goldberger 1992) and pathological states (Goldberger et al 2002, Smits et al 2016, Calvo et al 2017, Li et al 2019). However, Vaillancourt and Newell (2002a, 2002b) suggested a modification to this theory by proposing that the complexity of physiological signals may not only decrease but also increase under certain pathological conditions. They came to this conclusion on the basis of the results of approximate entropy, with the values computed for fluctuations in concentration levels of cortisol and adrenocorticotropin in subjects with Cushing's disease being found higher than those for healthy individuals (Hartman et al 1994). Considering the above-mentioned theory, one might be tempted to infer that glaucomatous eyes should be characterized by a lower entropy of the CP signal (represented RCMFE) compared with healthy eyes. However, the results of the current study reveal the opposite tendency, showing higher complexity of the CP signal in glaucomatous eyes, which is in line with Vaillancourt and Newell's view. We hypothesize that the higher complexity of the CP signal in glaucoma patients than in healthy subjects could be related to higher ocular stiffness (higher mechanical resistance of the cornea) and, in turn, to higher harmonic vibrations of tissue as a response to the pulsatile component of the IOP. Indeed, the animal study by (Rogala et al 2017) indicated that the higher power of the CP third harmonic corresponds to greater stiffness of rabbit corneas expressed by the greater Young's modulus and increased central corneal thickness (Rogala et al 2017). It was also concluded that those changes in the CP signal contribute to the formation of a dicrotic pulse, the incidence of which was found to be higher in glaucoma patients (Danielewska et al 2014b).
Recently, investigation of CP signal complexity using RCMFE in POAG patients undergoing canaloplasty provided evidence that this surgical procedure leads to a decrease in the complexity of this signal, corresponding to a decrease in IOP values (Danielewska et al 2018). The highest entropy of the CP signal was observed after the stage when glaucoma medications were washed out, at which the IOP reached its highest value. Also, high complexity of the CP signal was maintained up to 3 months after surgery, corresponding to the stiffened limbus area due to the tensioning suture in Schlemm's canal. As demonstrated in a recent study of changes in spectral parameters of the CP signal in POAG patients (Danielewska et al 2019b), the tensioning of the suture, which changes the boundary conditions for the cornea, is reflected in the amplified CP third harmonic compared with its first harmonic. This evidence clearly shows that alterations in corneal biomechanics related to the increase in IOP and the surgical intervention in glaucoma patients are also manifest in changes in the complexity of the CP signal. The current study supports these findings by revealing differences in the complexity of the CP signal between glaucoma patients and healthy individuals.
The presented method of assessing the complexity of the CP signal is a relatively simple procedure because it just requiress the CP signal, without the need to acquire any additional cardiovascular signals, and yields an index that is easy to interpret. Namely, the higher value of entropy reflects relevant information encoded in the signal shape, referring to the biomechanical changes in the cornea of glaucomatous eyes. Furthermore, the presented ROC analysis showed that RCMFE of the CP signal has some potential to discriminate between POAG patients and healthy controls. Therefore, the proposed approach can be considered a promising supportive tool for glaucoma diagnosis.
There are some limitations to the present study. To obtain results with a higher degree of confidence the analysis needs to be repeated on a larger sample of participants. Also, more male participants should be recruited if gender-specific differences are to be investigated. Another limitation is that the glaucoma patients were receiving topical antiglaucoma medication, which has been shown to modify corneal structure (Konowal et al 1999, Bergonzi et al 2010) and biomechanics (Bolivar et al 2015, Tsikripis et al 2013, Wu et al 2016) as well as ocular hemodynamics (Carenini et al 1994, Fuchsjager-Mayrl et al 2005, Arend et al 2003). Since all patients had fixed-combination drug therapy this study limits the ability to evaluate the impact of specific medications on CP signal complexity. Based on an earlier study with POAG patients in which the complexity of the CP signal reached the highest value after a period of during which antiglaucoma medications were washed out (Danielewska et al 2018), it can be assumed that drug therapy merely lowers the complexity of this signal to a level that enables significant differentiation of glaucoma patients from healthy controls.
In conclusion, this study shows that multiscale entropy applied to the computation of CP signal complexity is a way to differentiate POAG patients from healthy individuals without the need to detect ocular dicrotism. The proposed entropy of the CP signal may, in the future, constitute a new auxiliary indicator of changes in ocular stiffness, thus supporting glaucoma diagnostics.
Acknowledgment
The study was supported by the National Centre for Research and Development, Poland, Grant No. LIDER/074/L-6/14/NCBR/2015.