

Abstract
Objective. The bowel is an important organ at risk for toxicity during pelvic and abdominal radiotherapy. Identifying regions of high and low bowel motion with MRI during radiotherapy may help to understand the development of bowel toxicity, but the acquisition time of MRI is rather long. The aim of this study is to retrospectively evaluate the precision of bowel motion quantification and to estimate the minimum MRI acquisition time. Approach. We included 22 gynaecologic cancer patients receiving definitive radiotherapy with curative intent. The 10 min pre-treatment 3D cine-MRI scan consisted of 160 dynamics with an acquisition time of 3.7 s per volume. Deformable registration of consecutive images generated 159 deformation vector fields (DVFs). We defined two motion metrics, the 50th percentile vector lengths (VL50) of the complete set of DVFs was used to measure median bowel motion. The 95th percentile vector lengths (VL95) was used to quantify high motion of the bowel. The precision of these metrics was assessed by calculating their variation (interquartile range) in three different time frames, defined as subsets of 40, 80, and 120 consecutive images, corresponding to acquisition times of 2.5, 5.0, and 7.5 min, respectively. Main results. For the full 10 min scan, the minimum motion per frame of 50% of the bowel volume (M50%) ranged from 0.6–3.5 mm for the VL50 motion metric and 2.3–9.0 mm for the VL95 motion metric, across all patients. At 7.5 min scan time, the variation in M50% was less than 0.5 mm in 100% (VL50) and 95% (VL95) of the subsets. A scan time of 5.0 and 2.5 min achieved a variation within 0.5 mm in 95.2%/81% and 85.7%/57.1% of the subsets, respectively. Significance. Our 3D cine-MRI technique quantifies bowel loop motion with 95%–100% confidence with a precision of 0.5 mm variation or less, using a 7.5 min scan time.
Export citation and abstract BibTeX RIS

Original content from this work may be used under the terms of the Creative Commons Attribution 4.0 licence. Any further distribution of this work must maintain attribution to the author(s) and the title of the work, journal citation and DOI.
Introduction
Curative radiotherapy for gynaecologic cancer patients consists of external beam radiotherapy to the pelvic area with or without a brachytherapy boost. The majority of patients experience diarrhoea at the end of treatment and some patients develop chronic severe bowel toxicity (Laan et al 2017, Seppenwoolde et al 2021). Recent research has revealed an association between V42% and V57% with diarrhoea (Jensen et al 2021) and between D2cc of the bowel and G3 gastrointestinal toxicity (Spampinato et al 2022). To reduce this risk, radiation to the bowel should be minimized. Previous attempts to establish dose constraints through the QUANTEC review have been inadequate (Muren et al 2003, Kvinnsland and Muren 2005, Hysing et al 2008, Kavanagh et al 2010), likely due to the dynamic nature of small bowel motion or bowel motility (Jadon et al 2019, Liu et al 2021). For example, gynaecologic cancer patients with a history of major abdominal surgery are at higher risk (Laan et al 2017), suggesting that adhesions that impede normal bowel motility play a role in radiation-induced toxicity. Such toxicity has a significant impact on the quality of life of survivors (Kuku et al 2013, Nicholas et al 2017). Incorporating bowel motion into radiotherapy treatment planning has the potential to reduce radiation-induced bowel toxicity and allow for more accurate dose-effect modelling.
An MRI scan is part of the standard care treatment planning for gynaecologic cancer patients according to the GEC-ESTRO guidelines (Dimopoulos et al 2012). Previous research has introduced a 3D cine-MRI acquisition technique and image analysis framework to quantify average bowel motion, primarily in gynaecologic cancer patients (Barten et al 2021). However, relying solely on average motion one might overlook high-motion or low-motion areas, requiring a more refined approach.
While a 10 min MRI acquisition provides an estimate of bowel motion, the precision of this estimate remains unknown. The aim of this study is to determine the precision of bowel motion quantification and to estimate the minimum MRI acquisition time to determine bowel motion without compromising the precision of the measurements.
Materials and methods
Cohort and acquisition
The data for this study was derived from the same cohort of 22 patients as presented in a previous study (Barten et al 2021). These 22 gynaecologic cancer patients were undergoing external beam radiotherapy and brachytherapy with curative intent. All patients gave written informed consent, and the study was approved by the medical ethical committee.
As part of the standard of care, each patient underwent an MRI session prior to the initiation of external beam radiotherapy. For this study, a dedicated 3D cinematic MRI (cine-MRI) acquisition for quantification of bowel motion was added to the scanning protocol.
The 3D cine-MRI's, referred to as bowel motion scans, were acquired with a 3T Philips Ingenia MRI scanner (Philips, Best, Netherlands) using a 3D balanced turbo field echo sequence with an echo time of 1.39 ms and a repetition time of 2.8 ms. The field-of-view (FOV) was 200 × 200 × 125 mm3 with a reconstructed voxel size of 1.25 × 1.25 × 2.5 mm3 and no gaps. Each 3D volume had an acquisition time of 3.7 s, and a complete acquisition consisted of 160 volumes, referred to as dynamics, resulting in a total acquisition time of approximate 10 min for the 3D motion scan. The scan was located at the abdomen and included large part of the small bowel. A 3D distortion correction was applied.
Motion metrics determination
The methodology used in this study was based on our prior research (Barten et al 2021). In brief: deformable image registration (DIR) was performed using the Elastix toolbox version 4.900 (Klein et al 2010) on consecutive pairs of dynamics, resulting in 159 deformation vector fields (DVFs). A quality assurance (QA) procedure was applied to these DVFs. The QA process included evaluating the DVFs based on two key metrics: the Jacobian determinant (JAC) and the harmonic energy (HE), with references to established standards (Forsberg et al 2013, Kierkels et al 2018, Riyahi et al 2018).
Established criteria indicate JAC values <0 (tissue folding) and >2 (unrealistic expansion) as indicative of erroneous deformations (Brock et al 2017). Acceptable values for HE are yet to be defined. We employed JAC0%, JAC2%, and mean HE (μHE) as QA metrics (Barten et al 2021).
The QA criteria, set to maintain sufficient DVF accuracy for accurate displacement measurements, were determined based on a population-wide assessment and defined as any DVF exceeding the median plus two times the interquartile range (2*IQR) across all registrations from all MRIs. Cutoff values were determined based on population statistics, setting thresholds at JAC0% = 4.5%, JAC2% = 5.0%, and μHE = 4.0 to ensure the selection of physiologically realistic deformation vector fields. DVFs that met the predefined QA criteria were retained for further analysis.
The DIR algorithm takes into account the relationships between voxels and the gradient between adjacent voxels, which can provide sub-voxel accuracy. This approach has been validated in previous studies (Gurney-Champion et al 2018), which demonstrated its capability to capture sub-voxel motions. Registration of sub-voxel displacements, e.g. 0.2 mm, has been achieved with voxel sizes (2 × 2 × 2 mm) similar to the ones used in our study.
The accuracy of the DVFs that passed the DIR QA was estimated to have a potential error of approximately 0.25 mm (Gurney-Champion et al 2018, Barten et al 2021). We also considered geometric fidelity errors, such as susceptibility artefacts, which, due to their systematic nature, had a limited impact on the calculation of DVFs.
In this study, to depict high-motion and low-motion areas, a 3D motion map was constructed by calculating a median- and a maximum displacement motion metric per voxel from the 159 DVFs, per cine-MRI. The histogram of this complete set of 159 DVFs showed a chi-squared distribution, see figure 1(A), with a high frequency of low displacement values and a tail towards the high displacement values.

Figure 1. Determination of motion metrics (example of Patient 4). (a) Distribution of deformation vectors in the bowel bag volume. Example of the distribution of 159 deformation vectors for a specific voxel located in the bowel bag, representing the variation within this voxel in a single patient, following a chi-squared distribution. The median vector length (VL50) value and the 95th percentile vector length (VL95) value for this voxel are indicated by colored lines. (b) 3D motion maps of different motion metrics. Example of axial slices from 3D motion maps, depicting the 50th percentile vector length (VL50) and the 95th percentile displacement (VL95) motion metrics. Each voxel shows a motion value based on the set of 159 motion values obtained across the entire acquisition. (c) Motion-volume-histograms (MVHs) of VL50 and VL95. MVHs illustrating the distribution of median (VL50) and 95th percentile (VL95) displacements for this patients, summarizing the entire motion distribution of the bowel bag volume into a single curve. The minimum motion in 50% of the bowel bag (M50%) in indicated by the blue dotted line.
Download figure:
Standard image High-resolution imageBased on this, the median displacement value was selected as the motion metric describing the median bowel motion during the scan acquisition, referred to as 'VL50' (figure 1(B)).
The maximum displacement value is very sensitive to registration errors since it is based on a single DVF. Therefore we chose the more robust 95th percentile of the distribution (VL95) metric as an estimator of high bowel motion (figure 1(B)).
Motion-volume histograms (MVHs) were calculated from both the VL50 and the VL95 motion maps (Barten et al 2021), summarizing the entire motion distribution into a single curve.
The region of interest, referred to as the bowel bag, was defined as the bowel region between L5 and the symphysis and was delineated on all slices of the first dynamic of each motion scan. The bladder, uterus, sigmoid and rectum were delineated and subtracted from the delineated bowel bag. This region of interest was co-registered with the 3D motion map and used to generate the MVH. The combination of a 3D motion map and a MVH allowed visual and quantitative assessment of bowel motion. For comparison among individual patients, the minimum motion in 50% of the bowel bag volume, defined as the 'M50%', was extracted from the MVH for further analysis and to be able to make comparisons (figure 1(C)). For a more detailed explanation of the acquisition and registration method and the concept of MVHs, see the previous study by Barten et al 2021.
Determination of minimum acquisition time
To assess the precision of the motion metrics, the full dataset of 160 dynamics was divided into subsets of 40, 80, and 120 consecutive dynamics, corresponding to acquisition times of 2.5 min, 5.0 min, and 7.5 min, respectively. From the full 160 dynamics, the subsets were generated according to a sliding window strategy (figure 2). For example, a subset of 40 consecutive dynamics was generated 120 times. The precision of the motion metrics was defined by the variation, represented by the interquartile range (IQR), of the metric within the subsets.
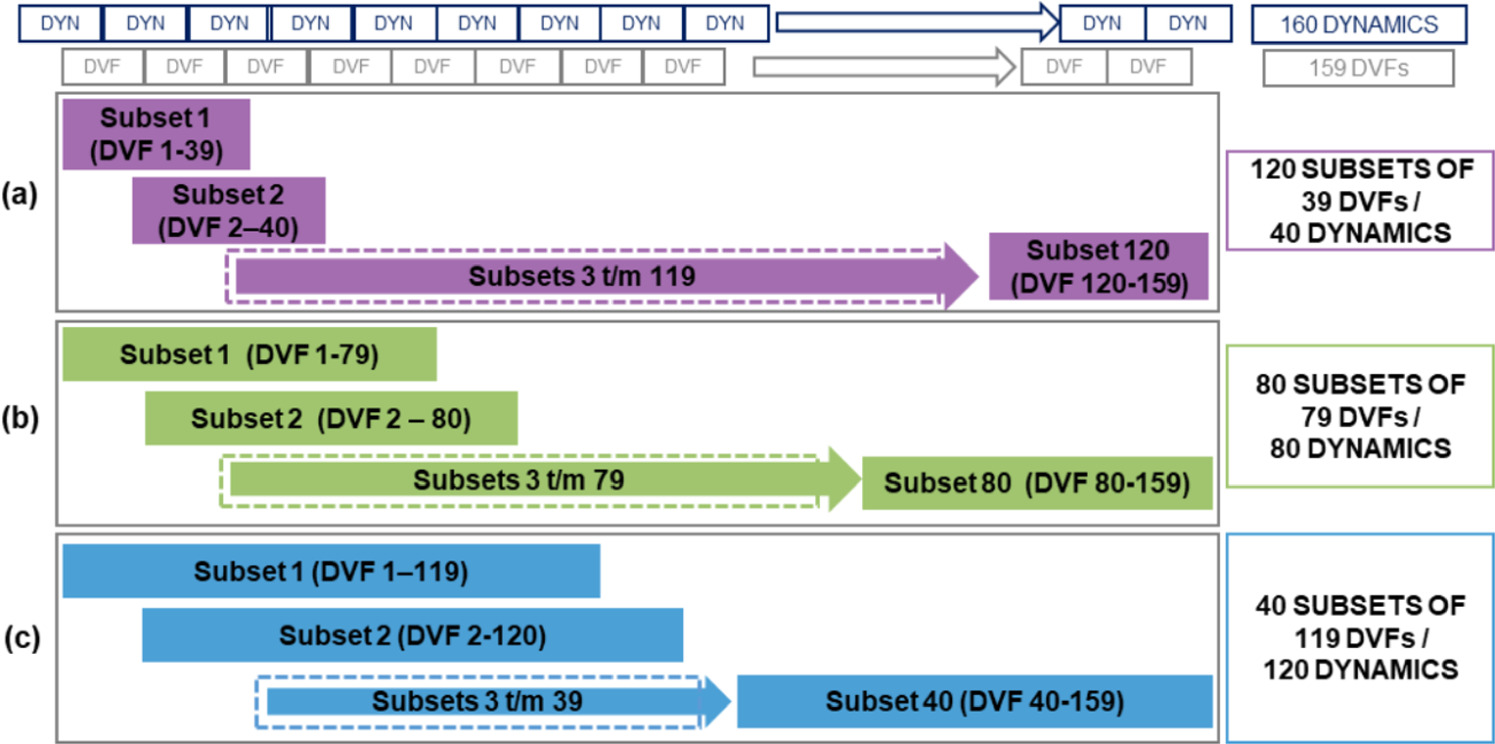
Figure 2. Creation of subsets for feasibility testing of different acquisition times. A complete dataset consists of 160 dynamics (3D volumes) from which 159 deformation vector fields (DV Fs) are obtained. A registration of two dynamics results in 1 DVF. As a sliding window 40, 80 or 120 subsets were created. (a)Schematic representation of 120 subsets, each consisting of 39 DVFs from 40 consecutive dynamics, to evaluate an acquisition time of approximately 2.5 min. (b) Schematic representation of 80 subsets, each consisting of 79 DVFs from 80 consecutive dynamics, corresponding to an acquisition time of approximately 5 min. (c) Schematic representation of 40 subsets, each consisting of 119 DVFs from 120 dynamics, representing an acquisition time of approximately 7.5 min.
Download figure:
Standard image High-resolution imageA total of 120 subsets of 39 consecutive DVFs, 80 subsets of 79 DVFs, and 40 subsets of 119 DVFs were evaluated (figure 2). As a result of the QA of the DIR, registrations were rejected if the QA criteria were not met, resulting in fewer than 120 subsets available for analysis.
For each subset, an MVH was constructed of both the VL50 and VL95, and the M50% was calculated. The median M50% and mean IQRs were determined for each subset, providing insight into the variability of each motion metric across the subsets. A variability of less than 0.5 mm was considered precise enough for treatment planning purposes (Tanderup et al 2008) and an observable displacement in bowel motion. We hypothesize that an accuracy of 0.5 mm in bowel motion is reasonably achievable with a 2.5 mm voxel size MRI matrix, which allows for a large FOV acquisition with a 3.7 s acquisition time per volume. Furthermore, 0.5 mm is below the geometric fidelity of a 3T MRI scanner within a sphere of 30 cm in diameter from the magnetic isocenter for non-EPI acquisitions (Netherlands Commission on Radiation Dosimetry 2023).
Results
A total of 22 3D cine-MRI scans (of the 22 patients) were included in the analysis. During the DIR QA, the quality of each DVF is assessed, and those that do not meet the required quality standards are excluded. In our prior study, we conducted DIR QA analysis for a total of 3498 registrations. Notably, in two patients, more than 40 DVFs were rejected. For a detailed breakdown of rejected DVFs per patient, please refer to our earlier publication (Barten et al 2021).
As a result, for patient 6, there were insufficient DVFs (fewer than 40) to conduct the 120 subset analysis, and for patient 9, there were an insufficient number of DVFs available for both the 40, 80, and 120 subset analyses. Figure 3 illustrates the calculated MVHs for the VL50 motion metric in an example patient with different subset sizes. Panel A shows 120 MVHs with 39 DVFs each, with slightly different shapes. For this patient, the VL50 M50% was 1.9 mm and showed a variation of 0.5 mm for subset size 40. As the subset size increased (panels B and C), this variation decreased and converged to a single M50% value of 2.1 mm when all 159 DVFs were included.
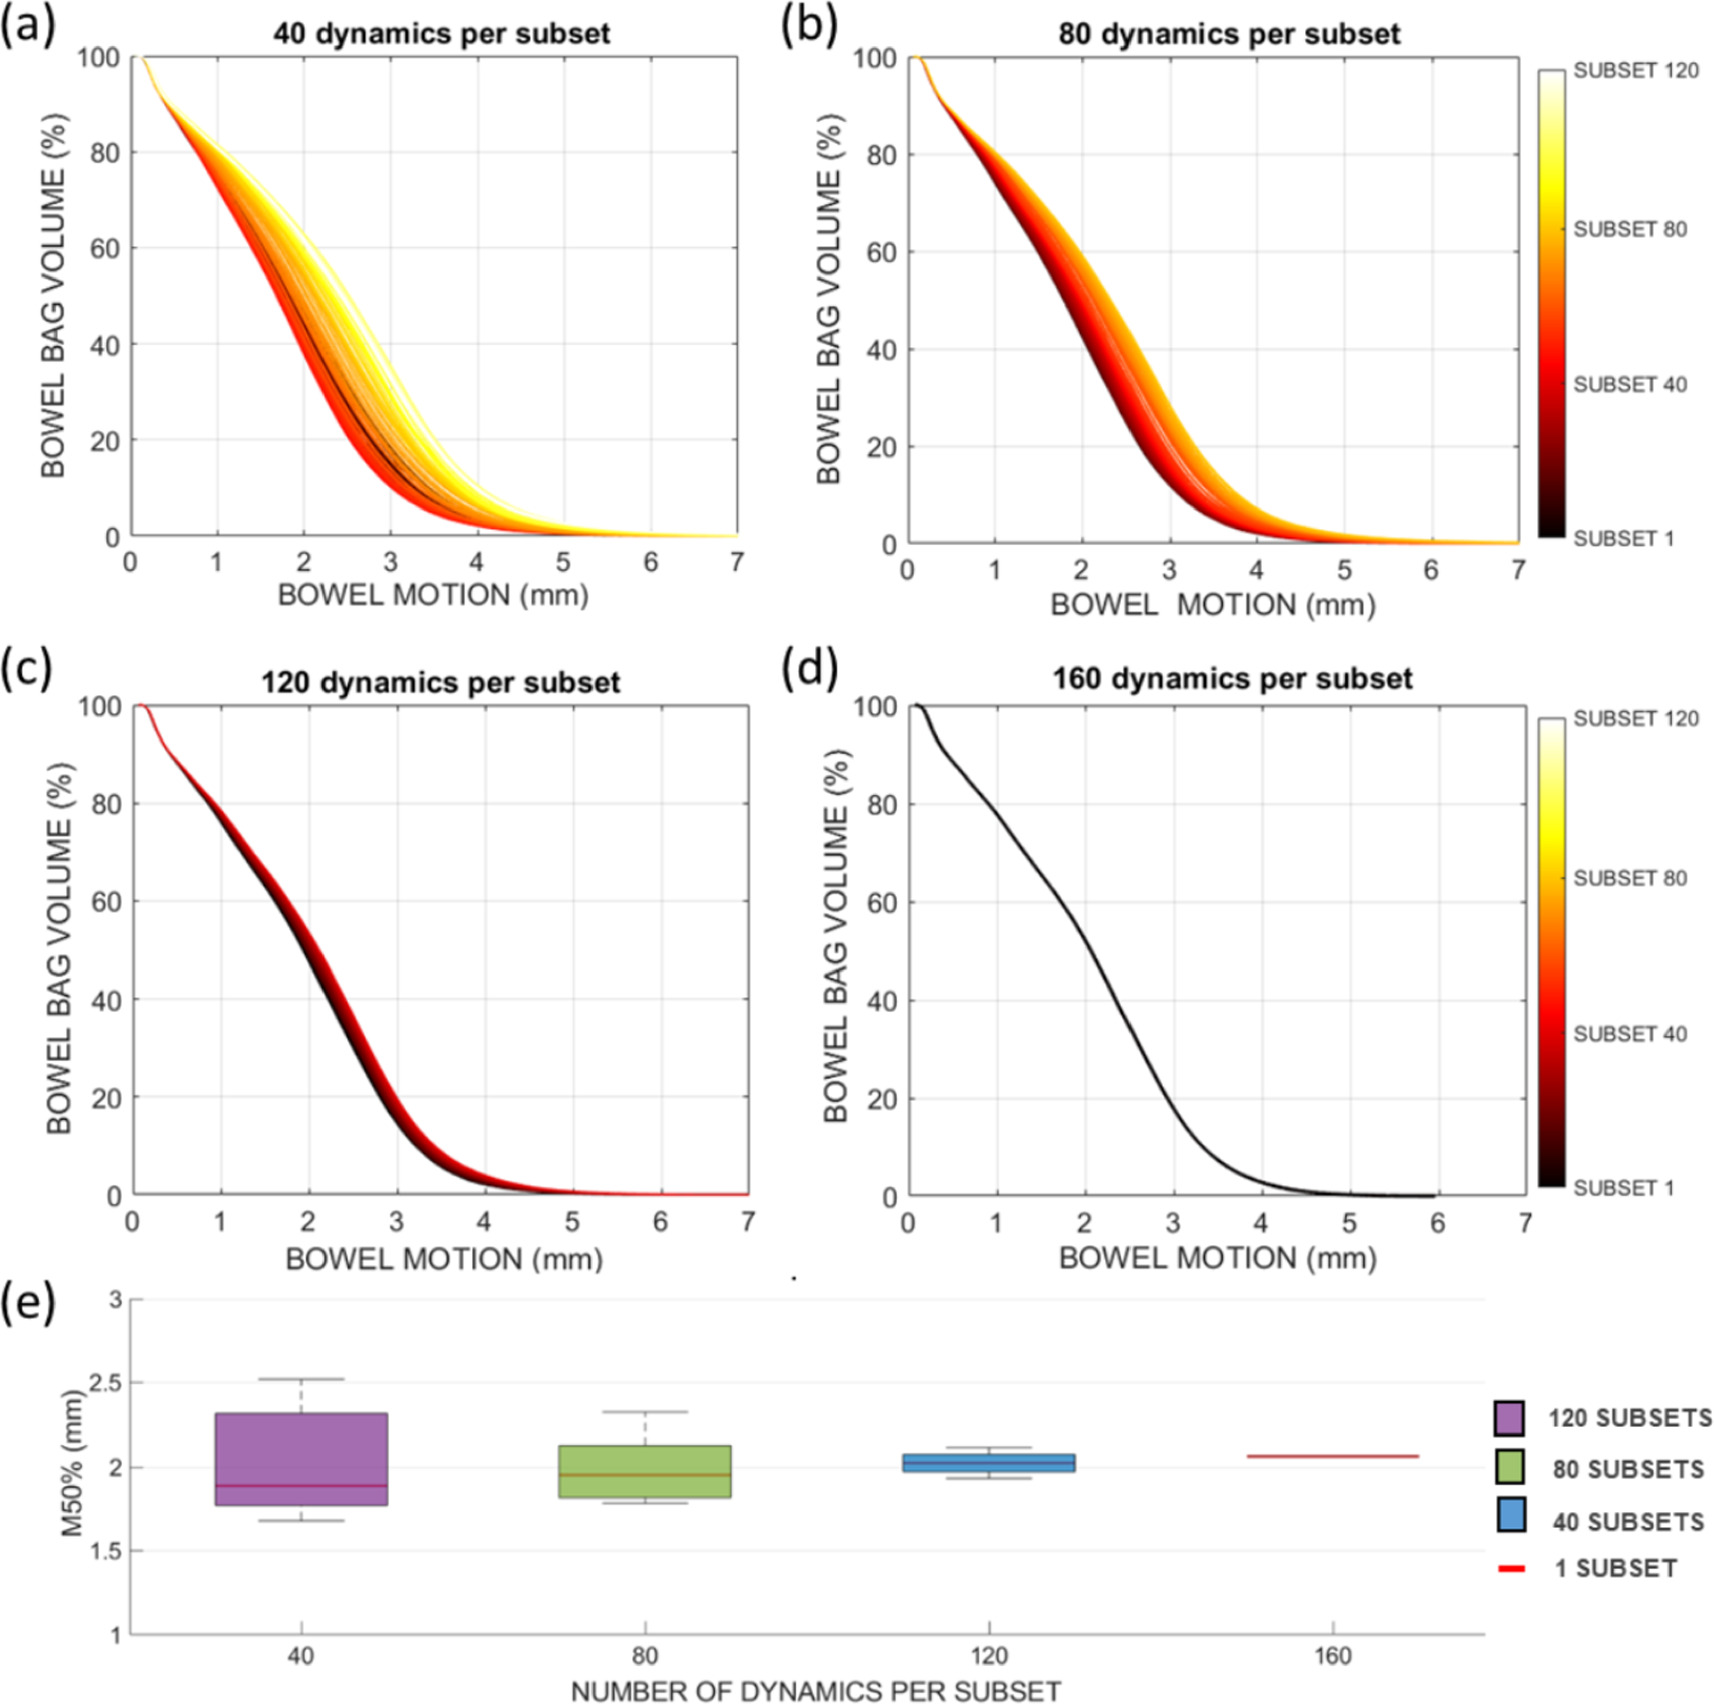
Figure 3. Example of the motion-volume histograms (MVHs) that were constructed for the median motion metric (VL50) for different subset sizes in patient 13. (A) MVHs of the 120 subsets of 40 consecutive dynamics. (B) MVHs of the 80 subsets of 80 consecutive dynamics. (C) MVHs of the 4 subsets of 120 consecutive dynamics. (D) MVH based on the complete set of 160 dynamics. (E) Boxplot of M50% values per subset. Boxes: median value and lower and higher quartiles, whiskers: lowest and highest data point within 1.5 times the inter-quartile range.
Download figure:
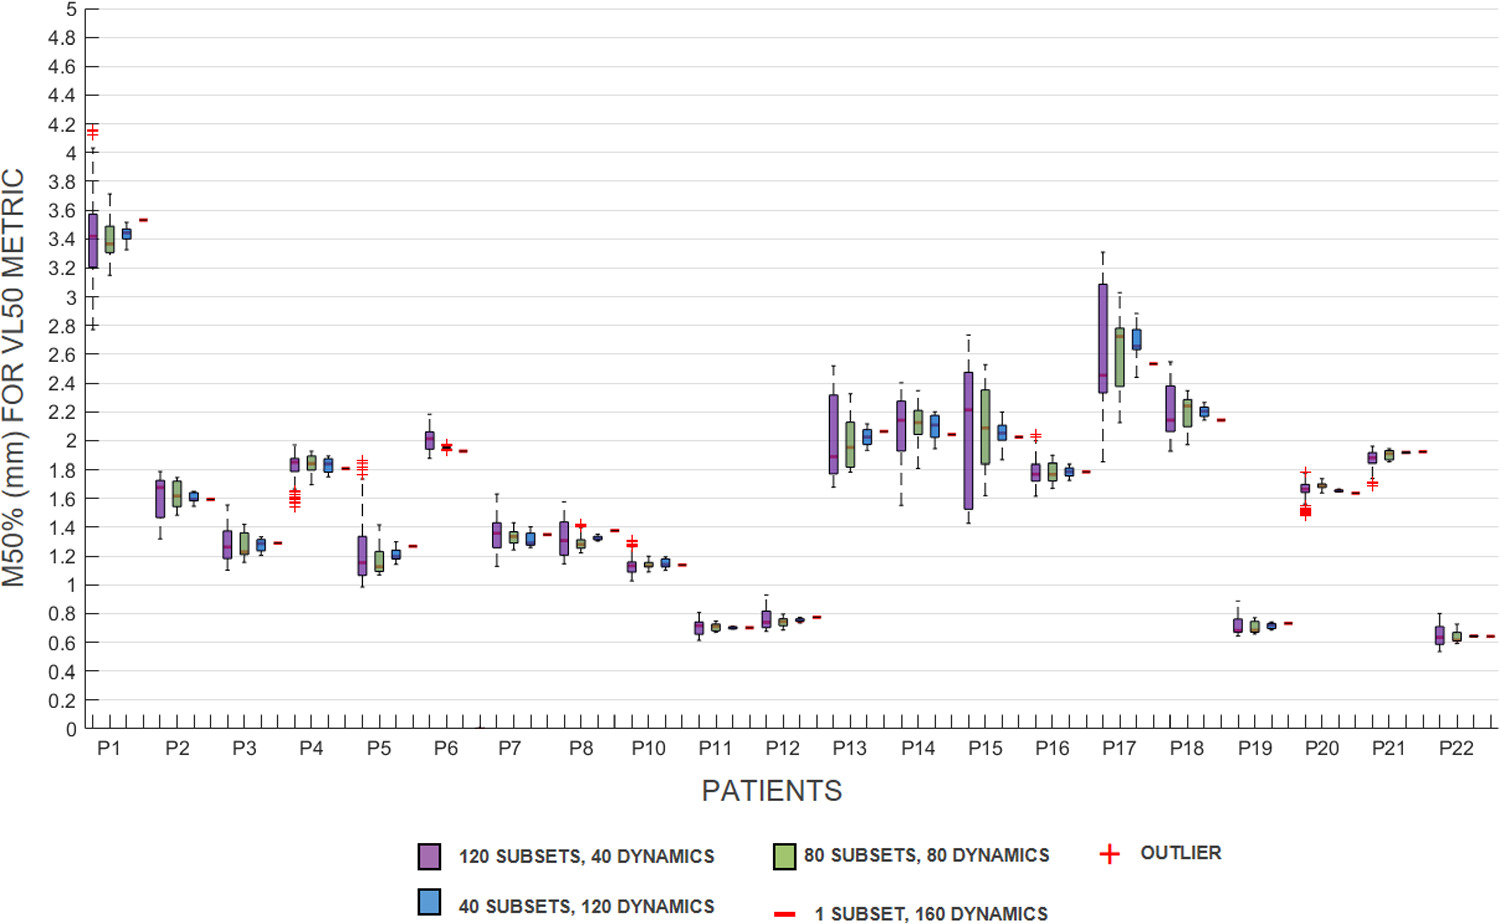
Standard image High-resolution imageFigure 4 shows the convergent pattern across all patients, with the variation of the M50% decreasing as the subset size increases. Some patients showed a rapid decrease in variability with increasing subset size (e.g. patients 13, 14, 18), while others show initially less variation.
Figure 4. The calculated M50% for the VL50 of each patient, per subset size. Each patient shows from left to right the M50 for 120 subsets, 80 subsets, 40 subsets and 1 subset. Boxes: median value and lower and higher quartiles, whiskers: lowest and highest data point within 1.5 times the inter-quartile range, crosses: outliers.
Download figure:
Standard image High-resolution image
Figure 4 shows a consistent convergent pattern across all patients, wherein the variation of the median bowel motion (M50%) decreases as the subset size increases. Notably, some patients, such as patients 15 and 17, exhibit larger variations between subsets, with greater dispersion observed in the 40-subset analysis, which gradually diminishes as the subset size increases. This variation is notably smaller in other patients (i.e. 11, 12, 19 and 22), demonstrating more consistent bowel motion across all subsets.
The mean observed variation for the M50% of the VL50/VL95 motion metric was 0.3 mm/0.6 mm, 0.1 mm/0.4 mm, and 0.1 mm/0.2 mm for subset sizes of 40, 80, and 120, respectively. Table 1 shows the number of scans that achieved an IQR below 0.5 mm for each subset size. In addition, the mean and maximum IQR values over the patient population are provided for the various subset sizes for both the VL50 and VL95. It is plausible that for each patient the M50% converges to a single value within the IQR of the 40/80/120 subsets, when all 160 dynamics in one subset are considered. For VL50, the maximum difference between the average M50% of all 160 dynamics compared to the subsets of 40/80/120 dynamics is 0.6/0.3/0.2 mm, respectively. For VL95, these differences are larger.
Table 1. Median bowel motion (M50%) and its variation (IQR) for VL50 and VL95 motion metrics, over all patients, per subset (40, 80, and 120 dynamics) a .
| VL50 | VL95 | |||||
|---|---|---|---|---|---|---|
| Subset 40 | Subset 80 | Subset 120 | Subset 40 | Subset 80 | Subset 120 | |
| median M50% | 1.7 | 1.7 | 1.6 | 5.4 | 5.4 | 5.2 |
| mean IQR (mm) | 0.3 | 0.1 | 0.1 | 0.6 | 0.4 | 0.2 |
| max IQR (mm) | 0.9 | 0.5 | 0.2 | 1.9 | 1.3 | 0.4 |
| mean difference M50% 160-subset (mm) | 0.1 | 0.1 | 0.0 | 0.4 | 0.3 | 0.2 |
| max difference M50% 160-subset (mm) | 0.6 | 0.3 | 0.2 | 1.5 | 0.9 | 0.5 |
| Total scans | 21 | 21 | 20 | 21 | 21 | 20 |
| #Scans IQR < 0.5 mm | 18 | 20 | 20 | 12 | 17 | 20 |
| Percentage accuracy (IQR < 0.5 mm) | 85.7% | 95.2% | 100.0% | 57.1% | 81.0% | 100.0% |
a The calculated median M50% and its variation, over all patients is shown. The mean M50% for a single MVH (160 dynamics) was compared with each subset, reported as a mean and maximum difference in M50%. The number of scans and the number of scans with a variation below 0.5 mm is shown.
Discussion
In this study we assessed the precision of bowel motion quantification using a 3D cine-MRI technique to determine the minimum MRI acquisition time to obtain precise results. The variation of calculated motion metrics was investigated using subsets of the acquired images, corresponding to variable MRI acquisition scan times. Fewer dynamics correspond to shorter acquisition times, which is important to prevent unnecessary time spent in the MRI and thus increase patient comfort.
The median displacement value (VL50) was identified as a feasible motion metric for assessing overall bowel motion. It represents the most frequent displacements in the bowel volume during the (e.g. 10 min) scan acquisition.
The 95th percentile displacement value (VL95) was found to be suitable for detecting regions of high and low motion in the bowel bag volume. Regions of low bowel motion might be representative for an area of bowel adhesions resulting from abdominal surgery. These adhesions might fixate bowel segments in the high-dose area, possibly increasing the risk of radiation-induced bowel toxicity. Conversely, a large displacement of a bowel segment into a higher dose area may result in excessive local radiation delivery, also posing a potential risk of toxicity. Therefore, incorporating the VL95 metric into an adaptive radiotherapy treatment planning may prove useful. Fixed bowel adhesions can be taken into account during planning due to their known location and lack of displacement. However, for dynamic bowel loops entering and exiting the radiation field, reliable identification and tracking methods are necessary for successful adaptive planning. Addressing this challenge is vital to optimize adaptive radiotherapy and improve treatment outcomes. Further research is needed to develop robust strategies for handling these dynamic bowel structures, helping to optimize treatment planning and delivery.
Regarding the accuracy of the 10 min scan strategy, we observed a converging pattern in the variation of the M50% with increasing dataset size. The median variation of the M50% in the set of 120 dynamics (corresponding to a 7.5 min MRI acquisition time) was 0.1 mm and 0.2 mm for VL50 and VL95, respectively. In addition, a maximum difference of 0.5 mm in median M50% was observed between 160 and 120 dynamics, indicating that the precision of the bowel motion quantification framework using a 10 min MRI acquisition is in the order of 0.5 mm. Importantly, the variation within patients is smaller than the variation observed between different patients, indicating that individual patient characteristics play a prominent role in shaping bowel motion patterns during radiotherapy. These findings underscore the importance of considering patient-specific factors when quantifying bowel motion and highlight the potential for tailored treatment planning to optimize radiation delivery and minimize toxicity risks based on individualized motion characteristics.
While our study does not provide direct insight into the reproducibility of motion measurements across different days, we acknowledge the importance of these aspects and recognize that further research is needed to investigate such dynamics, especially in the context of radiotherapy and potential changes in bowel motion due to treatment effects.
The precision of bowel motion quantification must be sufficiently high to detect significant changes in bowel motion for various purposes, including the identification of adhesions. Considering the effect of bowel motion on the delivered dose, a 0.5 mm precision is clinically relevant, especially for high dose gradient treatments such as brachytherapy, where a 1 mm difference in applicator position results in a 5% dose difference in the rectum and bowel (D2cm3) (Tanderup et al 2008).
With this work, we have demonstrated that our motion quantification framework has a mean variation in M50% of less than 0.2 mm for 7.5 min. Other factors contributing to overall accuracy, such as DIR accuracy (estimated at 0.25 mm) and the limited effect that image deformation variation between dynamics have, add up to an estimated accuracy of the method of 0.5 mm. It is important to emphasize that these estimated accuracy figures pertain to a global, population-level assessment. Achieving <0.5 mm accuracy for real-time tracking of the bowel on an individual cine MRI basis may present challenges.
This study shows that by reducing the scan time to approximately 7.5 min, the variation of the M50% VL50/VL95 remained below 0.5 mm in 100% of the cases, demonstrating the potential efficiency while precision is ensured. However, the temporal resolution is also a key factor for accurate assessment of bowel motion (de Jonge et al 2018). Higher temporal resolution could increase the accuracy of deformable registrations and improve the accuracy of calculated motion-volume parameters. Additionally, it has the potential to capture more intricate motion patterns. Thus, the feasibility of quantifying bowel motion depends on finding a balance between temporal resolution and total acquisition time.
This work is important for radiotherapy clinical practice as it initiates a deeper understanding of bowel motion during treatments. While our primary focus was determining the precision of bowel motion quantification, this study marks the initial phase in integrating bowel motion considerations into radiotherapy. Future research will explore dose-effect associations and identify low-motion regions like adhesions, aiming to enhance toxicity outcomes. Subsequent studies will determine if bowel motion mapping can serve as a valuable biomarker for assessing radiation-induced bowel toxicity risk factors.
Conclusion
In conclusion, bowel motion can be quantified using the VL50 and VL95 motion metrics to identify overall bowel motion during different treatment phases and high motion volumes, respectively. With an MRI acquisition time of 7.5 min, the variation of the minimum displacements of 50% of the bowel bag volume remained below 0.5 mm. These motion metrics can provide insight into the effects of radiotherapy on bowel motion and facilitate the incorporation of bowel motion into (adaptive) radiotherapy treatment planning aiming to reduce particularly bowel toxicity.
Data availability statement
All data that support the findings of this study are included within the article (and any supplementary information files).
Conflict of interest disclosure statement
Barten is involved in several projects supported by Elekta. Dr van Kesteren has research collaborations with Philips Healthcare, GE Healthcare and Varian. Prof. Bel is involved in several projects supported by Varian, a Siemens Healthineers company (Palo Alto, Ca, USA) and Elekta AB (Stockholm Sweden), outside the scope of this study. Dr Pieters has an Elekta research grant to the institute, and payment to institute for presentation by BD. Prof. Stoker has research collaboration with Motilent concerning MRI of motility and research consultancy for Sanofi. Dr de Jonge has a research collaboration with Motilent focused on imaging analysis of the gastrointestinal tract.
These companies had no involvement in study design, data collection and analysis, or writing of the manuscript. We disclose any and all potential conflicts of interest that could bias the results reported in the manuscript.
Ethical statement
This study was performed in accordance with the Declaration of Helsinki. This study was performed in accordance with the Nurenberg Code. This human study was approved by Medisch Ethische Toetsingscommissie AMC 2018. The study was not registered as a clinical trial because The study was not registered as a clinical trial because, according to the METC application, this was not necessary for such small non-invasive pilot studies. All adult participants provided written informed consent to participate in this study.