

Abstract
Objective. This study is aimed to explore the effects of vascular and sonication parameters on ex vivo vessel sonicated by high-intensity focused ultrasound. Approach. The vascular phantom embedding the polyolefin tube or ex vivo vessel was sonicated. The vascular phantom with 1.6 and 3.2 mm tubes was sonicated at three acoustic powers (2.0, 3.5, 5.3 W). The occlusion level of post-sonication tubes was evaluated using ultrasound imaging. The vascular phantom with the ex vivo abdominal aorta of rabbit for three flow rates (0, 5, 10 cm s−1) was sonicated at two acoustic powers (3.5 and 5.3 W). Different distances between focus and posterior wall (2, 4, 6 mm) and cooling times (0 and 10 s) were also evaluated. The diameter of the sonicated vessel was measured by B-mode imaging and microscopic photography. Histological examination was performed for the sonicated vessels. Main results. For the 5 cm s−1 flow rate, the contraction index of vascular diameter (Dc) with 5.3 W and 10 s cooling time at 2 mm distance was 39 ± 9% (n = 9). With the same parameters except for 0 cm s−1 flow rate, the Dc was increased to 45 ± 7% (n = 4). At 3.5 W, the Dc with 5 cm s−1 flow rate was 23 ± 15% (n = 4). The distance and cooling time influenced the lesion along the vessel wall. Significance. This study has demonstrated the flow rate and acoustic power have the great impact on the vessel contraction. Besides, the larger lesion covering the vessel wall would promote the vessel contraction. And the in vivo validation is required in the future study.
Export citation and abstract BibTeX RIS
Introduction
Uterine fibroids are the most common benign neoplasms of reproductive-aged women. Around 77% of women are diagnosed with uterine fibroids (Islam et al 2013). The women with symptomatic fibroid approach 25%. Fibroid would cause menorrhagia, heavy uterine bleeding and pelvic pain, and the symptoms may affect the patient's life (Stewart 2015, '[Consensus for diagnosis and treatment of uterine myoma]' 2017). There are several minimally invasive and noninvasive options for patient with fibroid, and uterine artery embolization (UAE) can preserve uterus and patient satisfaction rate is quite high (de Bruijn et al 2016). Blood supply is the key to fibroid growth, and fibroid shrinkage and symptom relief can be achieved with UAE. The UAE is to selectively embolize the fibroid vessels through injecting embolic agents, and the long-term follow-up result has indicated that UAE can be a safe and effective alternative to hysterectomy (Kim et al 2020, Dehbozorgi et al 2021). High-intensity focused ultrasound (HIFU) has been widely used for treatment of uterine fibroid (Stewart 2015), and it could be another noninvasive option for fibroid devascularization because HIFU has been proved to occlude the ex vivo (Ota et al 2009, Petrusca et al 2009, Senoo et al 2011, Siu et al 2017) and in vivo blood vessels in small (Delon-Martin et al 1995, Hynynen et al 1996, Rivens et al 1999, Denbow et al 2000, Fujiwara et al 2002, Hwang et al 2003, Ishikawa et al 2003, Ichizuka et al 2007, Okai et al 2013) and large animals (Shaw et al 2016, 2018, Barnat et al 2019, Shaw et al 2019, Barnat et al 2020).
The feasibility of fibroid devascularization has been proven with both magnetic resonance-guided HIFU (Voogt et al 2012) and ultrasound-guided HIFU (Zhou et al 2021). The vessels of three fibroids were covered by multiple 12 and 8 mm treatment cells, and the acoustic power (120–180 W) was adjusted in the sonication according to MR thermometry (Voogt et al 2012). Therefore, the acoustic power could affect vascular occlusion. The 1 month non-perfusion volume rate (NPVR) of nine in 42 treated patients was less than technical success predictor (50%), and the treatment outcome such as NPVR and fibroid shrinkage correlated negatively with the Adler grade which is used to semi-quantitatively assess the blood flow (Zhou et al 2021). In addition, the acoustic power was also needed to be adjusted, and it could not ensure that the focal spots be set on the vessel walls owing to the difficulty in targeting the fibroid vascularity. As a result, the sonication of treatment cells was repeated. More studies are required to improve the treatment efficacy of fibroid devascularization. The influence of vascular and sonication parameters on vascular occlusion are needed to be evaluated. The flow rate and focus shift could influence the size and shape of the lesion (Siu et al 2017) and the compressed vein was easier to be occluded (Ota et al 2009, Barnat et al 2019). Vein compression can reduce the lumen area and cooling effect of blood flow. Different acoustic intensities could lead to different histological changes and vascular constriction (Denbow et al 2000, Fujiwara et al 2002, Ishikawa et al 2003, Pichardo et al 2006, Ichizuka et al 2007). And veins have been used in most of the studies about the vascular occlusion (Pichardo et al 2006, Ota et al 2009, Petrusca et al 2009, Barnat et al 2019, 2020). The artery components are different from veins: tunica media of arteries has thicker smooth muscle; arteries have their own elastin layers. Therefore, the artery closure with HIFU may be different from veins. For the vessels with the largest diameter, the diameter of saphenous vein in sheep was 3.2 ± 1.0 mm (Barnat et al 2020) and the mean diameter of sheep placental vessels was 1.4 mm (0.3–4.1 mm) (Shaw et al 2019). In the above studies, vessels were occluded using different vascular parameters (diameters and flow rates) and sonication parameters. The purpose of this study is twofold: (1) to develop an ex vivo vascular phantom that can mimic the vessel and blood flow; (2) to evaluate the effect of vascular and sonication parameters on the vessel contraction.
In the study, a vascular phantom embedding the polyolefin tube or ex vivo artery was established, and the blood mimic solution was circulated in the vessel. Firstly, the vascular phantom with the 1.9 and 3.2 mm polyolefin tubes was used to assess the effect of vessel diameter, flow rate and acoustic power, and appropriate sonication parameters were determined for the ex vivo experiment. Secondly, the vascular phantom with the ex vivo abdominal aorta of rabbit (range: 2.7–4.2 mm) was used to investigate the influence of flow rate and sonication parameters (acoustic power, the distance between focus and posterior wall and cooling time) upon the vessel. Thirdly, ultrasound imaging, microscopic photography and histology examination were performed to evaluate the post-sonication vessels.
Methods and materials
Vascular phantom
20% (weight/volume, w/v) corn syrup (Chungjungwon, Seoul, Republic of Korea) and 50% (volume/volume, v/v) deionized and degassed water were added into a beaker. Then 12% (w/v) bovine serum albumin (BSA) was added in the corn syrup solution until BSA (Beyotime, Shanghai, China) was completely dissolved. The solution was set in the desiccant chamber and degassed with a vacuum pump (Daertuo, Zhejiang, China) at 0.098 MPa for about one hour. The 17.5% (v/v) aqueous solution of 40% (w/v) acrylamide (Sigma, California, USA), 5% (v/v) trizma hydrochloride buffer solution (Invitrogen, Shanghai, China) and 0.5% (v/v) of 10% (w/v) ammonium persulfate (Macklin, Shanghai, China) solution were mixed in the degassed solution. Then, 0.2% (v/v) N, N, N', N'- tetramethylethylenediamine (Aladdin, Shanghai, China) was added in the solution to accelerate polymerization (Guntur and Choi 2014). The final solution was poured into the acrylic containers. After 15 min, the gel phantoms were formed and then stored in sealed bags. And they were stored in a 4 °C refrigerator. Two sizes of phantoms were prepared: phantom #1 (length (L) × width (W) × height (H) = 37 mm × 20 mm × 30 mm) and phantom #2 (L × W × H = 37 mm × 40 mm × 15 mm).
The characteristics of the fabricated vascular phantom was similar to the blood vessels and surrounding tissues. The vascular phantom could mimic the blood and vessel. A blood vessel (vessel mimic tube or ex vivo vessel) was located 15 mm below the top surface of the phantom. Polyolefin tube, as a vessel mimic material, was embedded into phantom #1 (figure 1). Its diameters were chosen at 1.9 and 3.2 mm. Its acoustic and thermal parameters can be found in table 1. The ex vivo blood vessel was compressed by two pieces of phantom #2 (see figure 1). Blood mimic material was composed of 225 ml deionized and degassed water, 25 ml glycerin solution and 0.5 g glass beads. Its acoustic and thermal parameters were similar to those of the blood (Kim et al 2017) (see table 1). The blood mimic material was stirred uniformly and poured into a 250 ml infusion bag. Two straight tube connectors were fixed at both ends of the ex vivo vessel. The tube dedicated for peristaltic pump, the infusion bag and the vessel were connected by the connectors (see figure 2). The peristaltic pump (Longer Precision Pump, Hebei, China) was assembled with silicone tubing to drive the circulation of blood mimic material. At the pump speed of 100 rounds per minute (rpm), the flow rate of vascular mimic tube was measured, and they were respectively 14.4 cm s−1 (1.9 mm diameter) and 10.4 cm s−1 (3.2 mm diameter). The flow rate of ex vivo vessel was 5 cm s−1 at 50 rpm pump speed.
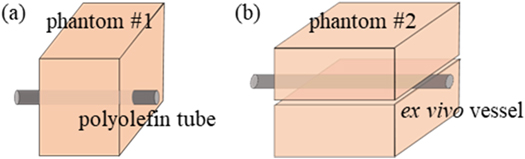
Figure 1. The structure of phantom #1 (a) and phantom #2 (b).
Download figure:
Standard image High-resolution imageTable 1. Acoustic and thermal parameters of blood vessel (Kim et al 2017), blood (Ellens and Hynynen 2014) and their mimic materials.
| Sound velocity (m s−1) | Attenuation coefficient (dB cm−1·MHz) | Density (kg m−3) | Specific heat capacity (J/kg·K) | Thermal conductivity (W/m·K) | |
|---|---|---|---|---|---|
| Human blood vessel | 1513 ± 21 | 1.45 | 1066 | 1.56 ± 0.03 | N/A |
| Polyolefin tube | 1516 ± 7 | 1.18 ± 0.34 | 919 ± 28 | 1.39 ± 0.04 | N/A |
| Human blood | 1590 | N/A | 1050 | 3850 | 0.506 |
| Blood mimic material | 1577 | N/A | 1026 | 4002 | 0.575 |
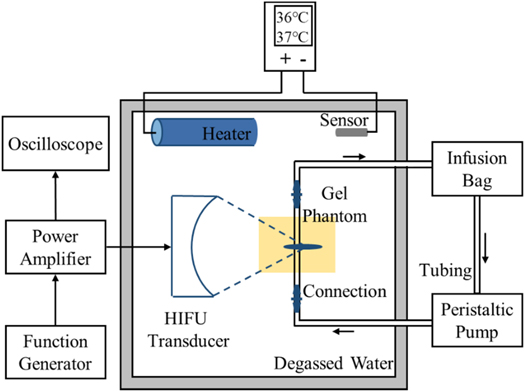
Figure 2. Experimental setup for vascular phantom with HIFU exposure.
Download figure:
Standard image High-resolution imageExperimental setup
The experimental setup is illustrated in figure 2. The spherical transducer (PA885, Precision Acoustics, Dorchester, UK) had an aperture of 60 mm and a radius of curvature of 75 mm. It worked at its third harmonic frequency (3.35 MHz). The lengths of −6 dB focal region were 6.75 mm and 0.75 mm respectively in axial and lateral directions using open-access FOCUS software (McGough RJ 2010). The excitation signal generated by a function generator (33500B, Keysight Technologies, CA, USA) and a power amplifier (1020 L, Electronics & Innovation, NY, USA) was fed to the transducer. An oscilloscope (DSO-X 4024 A, Keysight Technologies, CA, USA) was used to measure the output voltage of the transducer. The transducer and vascular phantom were placed at the fixed positions in the experimental setup. They were immersed in the tank (L × W × H = 32 cm × 25 cm × 15 cm) full of degassed and deionized water.
A heating system was used to maintain the temperature of the degassed water in the range of 36 °C–37 °C in the tank. It consisted of a heater, temperature sensor and controller. The heater and temperature sensor were fully immersed in degassed water when in use. The starting temperature and ending temperature of the temperature controller were set to 36.0 °C and 37.0 °C.
HIFU sonications
The root mean square voltage of the excitation pulse had three settings (150 mV, 200 mV and 250 mV). The acoustic pressure under small amplitude was measured with a hydrophone (HNR-0500, ONDA, CA, USA). It was used to obtain the acoustic power by HIFU simulator v1.2 (Soneson 2009). The electric power of excitation pulse was measured by power meter (4421, BIRD Electronic Corporation, OH, USA). The electroacoustic efficiency was calculated by dividing the acoustic power of the small signal by the electric power. The ratio of acoustic power to electrical power was used to calculate the acoustic powers of three settings, that was 2.0 W, 3.5 W, 5.3 W (see table 2). For the acoustic power of 5.3 W, spatial-peak intensity simulated by HIFU simulator in water was 2083 W cm−12. Peak positive and negative acoustic pressures were 14.6 and −5.2 MPa. For phantom #1, the pulse repetition period was 1 s, and the duty cycle was 60%. For phantom #2, the duty cycle was increased to 100%. To ensure the same energy delivery, the sonication time was 9 s, 5 s and 3 s, respectively at 2.0 W, 3.5 W and 5.3 W. Each spot was sonicated three times and the inter-sonication cooling time was 10 s. Besides, another setting of the sonication parameters was used for phantom #2: the sonication time was 6 s at 5.3 W, the spot was sonicated once and no cooling time was needed. The focal spot was located behind the vascular posterior wall along the propagation direction of the sound beam. The distance between the focal spot and the posterior wall was 2 mm, 4 mm and 6 mm.
Table 2. Simulated acoustic power, pressure and intensity in water.
| Excitation signal (mV) | Acoustic power (W) | Positive/negative pressure (MPa) | Pressure (MPa) | Intensity (W cm−2) |
|---|---|---|---|---|
| 250 | 5.3 | 14.6/−5.2 | 5.0 | 2083 |
| 200 | 3.5 | 10.0/−4.5 | 4.1 | 1316 |
| 150 | 2.0 | 6.4/−3.6 | 3.2 | 600 |
Experiment design
Phantom #1
The phantom #1 was placed into the water tank until its temperature reached between 36 °C and 37 °C. According to the settings of tube diameter, flow rate and acoustic power, there were 18 groups (see table 3), and every group was repeated three times.
Table 3. Group summary of phantom #1.
| No. | Diameter (mm) | Flow rate (cm s−1) | Acoustic power (W) |
|---|---|---|---|
| #1 | 1.9 | 0 | 2.0 |
| #2 | 1.9 | 0 | 3.5 |
| #3 | 1.9 | 0 | 5.3 |
| #4 | 1.9 | 7.2 | 2.0 |
| #5 | 1.9 | 7.2 | 3.5 |
| #6 | 1.9 | 7.2 | 5.3 |
| #7 | 1.9 | 14.4 | 2.0 |
| #8 | 1.9 | 14.4 | 3.5 |
| #9 | 1.9 | 14.4 | 5.3 |
| #10 | 3.2 | 0 | 2.0 |
| #11 | 3.2 | 0 | 3.5 |
| #12 | 3.2 | 0 | 5.3 |
| #13 | 3.2 | 5.2 | 2.0 |
| #14 | 3.2 | 5.2 | 3.5 |
| #15 | 3.2 | 5.2 | 5.3 |
| #16 | 3.2 | 10.4 | 2.0 |
| #17 | 3.2 | 10.4 | 3.5 |
| #18 | 3.2 | 10.4 | 5.3 |
Phantom #2
The ex vivo experimental protocol was approved by the institutional review board at School of Biomedical Engineering of Shanghai Jiao Tong University (2020018). New-Zealand white rabbits (females, n = 18) were 2–4 months old and weighed 2.4–3.9 kg. Rabbits were sacrificed after anesthesia, and the abdominal aorta was dissected. Residual blood at abdominal aorta was washed with saline solution. The obtained vessels were stored in centrifuge tube filled with saline solution. Then it was placed in a 4 °C ice box and transported to the laboratory. All vessels were treated in 24 h after their removal from rabbits. Both ends of each vessel were connected to the straight tube connector using O-rings respectively. The flow saline solution went through the ex vivo vessel to test the intactness of the artery. The ex vivo blood vessel of 8 cm in length was cut into two segments of equal length. The segments were immersed in saline solution with the air removed using a vacuum pump at 0.098 MPa for 30 min Before experiments, phantom #2 was placed inside the 37 °C water tank until its temperature reached between 36 °C and 37 °C. The degassed water of blood mimic substances was replaced with normal saline solution. Before experiments started, blood mimic material was circulated for three minutes. The left and right ends of each blood vessel were sonicated. Considering the flow rate, acoustic power, cooling time and the distance between focus and posterior wall, there were nine groups (see table 4).
Table 4. Group summary of phantom #2.
| No. | Flow rate (cm s−1) | Acoustic power (W) | Cooling time (s) | Distance (mm) |
|---|---|---|---|---|
| #1 (n = 9) | 5 | 5.3 | 10 | 2 |
| #2 (n = 8) | 10 | 5.3 | 10 | 2 |
| #3 (n = 4) | 5 | 3.5 | 10 | 2 |
| #4 (n = 7) | 5 | 5.3 | 10 | 4 |
| #5 (n = 3) | 5 | 5.3 | 10 | 6 |
| #6 (n = 7) | 5 | 5.3 | 0 | 2 |
| #7 (n = 11) | 5 | 5.3 | 0 | 4 |
| #8 (n = 4) | 0 | 5.3 | 10 | 2 |
| #9 (n = 3) | 0 | 5.3 | 0 | 4 |
Two J-type thermocouples (Tronovo, Jiangsu, China) were immediately inserted into the center of the lesion interfacing with both vascular walls after sonications. The associated temperatures were then acquired at 1 s interval by the temperature recorder (DT-847UD, ATEST, Guangdong, China), and the three-minute acquisition was performed. The recorded temperature data was fitted with cubic curve (Maruvada et al 2012) to obtain the peak temperatures respectively on the anterior and posterior walls at the end of the sonication.
Evaluation
B-mode imaging: a linear array probe (Mylab 90, Esaote, Genoa, Italy) was used to observe the changes of ex vivo blood vessels. For polyolefin tubes, the lumen of treated area was observed. The diameter of the ex vivo vessel (d) was measured before and after sonications, and the measurement was repeated three times. The minimum inner diameter observed in the B-ultrasound image was taken as the inner diameter of treated group. Vessels in the untreated area were used as control.
Color Doppler flow imaging (CDFI): CDFI function of probe was used to observe occlusion after vascular sonication. Figure 3 shows the results of the sonicated vessel evaluated by the combination of B-mode imaging and CDFI. The changes of vascular mimic tubes were graded as three, L0, L1 and L2 (see table 5).
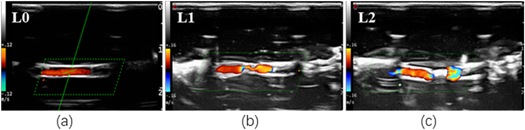
Figure 3. The occlusion level of ex vivo vessels in CDFI.
Download figure:
Standard image High-resolution imageTable 5. Grading of vascular occlusion levels described by B mode imaging and CDFI.
| Occlusion level | B mode imaging | CDFI |
|---|---|---|
| L0: not occluded | Obvious gap | Continuous color flow signal |
| L1: partial occlusion | Narrow gap | Thinner color flow signal |
| L2: complete occlusion | Obvious highlighted | Obvious breakpoint |
Microscopic photography: vascular deformation after sonication was observed by using low-magnification microscope (GP-660V, Gaopin, Jiangsu, China). Microscope electron magnification (30×–135×) fine-tuned to sample focus. Vascular segments of 2 mm in the treated and untreated area were cut with scalpel. The segment changes were observed and measured radially (see figure S1 (available online at stacks.iop.org/PMB/67/195005/mmedia) in supplemental material). The maximum inner diameter of the vasoconstriction in the treated area was taken as the inner diameter after HIFU exposure. The vessel segments in the untreated area were used as the control group. A contraction index of vascular diameter (Dc) was calculated for the contraction ratio of treated vessel. The index, which is expressed by

describes the vascular contraction. The contraction index of lumen area (Ac) is written as

Histological analysis: samples of the arterial segment were fixed in 4% paraformaldehyde solution for 48 h and sent for histological examination. Samples were embedded in paraffin and cut into 4 um slices along cross section. Slices were stained with hematoxylin and eosin (H&E) for evaluation.
Data preprocessing and statistical analysis
The raw data from all the groups of phantom #2 were preprocessed before statistical analysis. The outliers with Ac < 0 or much higher Ac were removed, and the samples with d ≥ 4 mm were removed. The processed d, Dc and Ac were presented as mean ± standard deviation (n = sample size), and the temperatures on the vessel walls were also processed and presented in the supplemental materials. The independent samples t-test was performed on the same parameter (flow rate, acoustic power, distance between focus and posterior wall, cooling time) for the inter-group comparison with different values. The null hypothesis was that the means of two groups were equal, and p < 0.05 indicated that significant difference existed between the compared groups. All the statistical analyses were performed with Excel 2019 (Microsoft, US).
Results
Diameter
After phantom #1 was sonicated at the acoustic power (Pa ) of 5.3 W, the occlusion levels of three 1.9 mm tubes were L2 (n = 2) and L1 (n = 1) when the flow rate (v) was 7.2 cm s−1. At the same acoustic power, the occlusion level of the three 3.2 mm tubes was L1 when v was 5.2 cm s−1, and the tube shrinkage was observed in the sonicated area. More details can be found in table S1.
Flow rate
After phantom #1 was sonicated at 3.5 W, three 1.9 mm tubes without flow were completely occluded, whereas the flow rate was increased to 7.2 or 14.4 cm s−1, the occlusion levels of three 1.9 mm tubes were L1 (n = 1) and L2 (n = 2). After the sonication of the 3.2 mm tubes at 5.3 W, three tubes without flow were completely occluded, while the flow rate was increased to 5.2 or 10.4 cm s−1, the occlusion levels of the three tubes were L1. Table S2 lists the detailed result.
With phantom #2 sonicated at 5.3 W, the distance (l) between focus and vascular posterior wall was 2 mm and cooling time (tc ) was 10 s. The Dc of the ex vivo vessels with a 5 cm s−1 flow rate was 1.1 times as large as that with a 10 cm s−1 flow rate (p = 0.51). The Dc without flow was 1.2 times as large as that with 5 cm s−1 flow rate (p = 0.26). For the vessels with 5 cm s−1 flow rate, the post-sonication diameter was decreased by 39 ± 9% (n = 9). When the flow rate was increased to 10 cm s−1, the Dc decreased to 35 ± 13% (n = 8). Without flow, the post-sonication diameter constricted by 45 ± 7% (n = 4). Table 6 provides the detailed result of groups #1, #2 and #8.
Table 6. Summary of vessel contraction after sonication with 10 s cooling time for different flow rates.
| No. | v (cm s−1) | d (mm) | Dc (%) | Ac (%) |
|---|---|---|---|---|
| #1 (n = 9) | 5 | 3.5 ± 0.4 | 39 ± 9 | 32 ± 8 |
| #2 (n = 8) | 10 | 3.7 ± 0.2 | 35 ± 13 | 24 ± 13 |
| #8 (n = 4) | 0 | 3.2 ± 0.4 a | 45 ± 7 | 28 ± 5 |
With phantom #2 sonicated at 5.3 W, no cooling time was set and the l was 4 mm. The vessels without flow had more obvious shrinkage than those with 5 cm s−1 flow rate. The Dc was 1.6 times as large as that with a 5 cm s−1 flow rate (p < 0.05). The Dc was 34 ± 9% (n = 11) for the vessels with 5 cm s−1 flow rate, while the Dc was increased to 53 ± 10% (n = 3) for the vessels without flow. Table 7 provides the detailed result of groups #7 and #9.
Acoustic power
After phantom #1 was sonicated at 5.3 and 3.5 W, the occlusion levels of three 1.9 mm tubes were L1 (n = 1) and L2 (n = 2) when the flow rate was 7.2 cm s−1. When the acoustic power was reduced to 2.0 W, the occlusion levels of three 1.9 mm tubes were L1. Table S3 lists the detailed result.
With phantom #2 sonicated with 10 s cooling time, the l was 2 mm and the flow rate was 5 cm s−1. The Dc of the vessels sonicated at 5.3 W was 1.7 times as large as that at 3.5 W (p = 0.06). The vessels constricted by 39 ± 9% (n = 9) in diameter after sonication at 5.3 W, while the Dc was decreased to 23 ± 15% (n = 4) after sonication at 3.5 W. Table 8 provides the detailed result of groups #1 and #3.
Table 8. Summary of vessel contraction after sonication at two different acoustic powers.
| No. | Pa (W) | d (mm) | Dc (%) | Ac (%) |
|---|---|---|---|---|
| #1 (n = 9) | 5.3 | 3.5 ± 0.4 | 39 ± 9 | 32 ± 8 |
| #3 (n = 4) | 3.5 | 3.7 ± 0.2 | 23 ± 15 | 16 ± 10 a |
Distance between focus and posterior wall
With phantom #2 sonicated at 5.3 W, the flow rate was 5 cm s−1 and cooling time was 10 s. The Dc of the sonicated vessels with 2 mm distance were 1.2 and 1.4 times as large as those with 4 mm (p = 0.28) and 6 mm distances (p = 0.16), respectively. When the distance was 2 mm, the post-sonication diameter constricted by 39 ± 9% (n = 9) in diameter. When the distance was increased to 4 mm, the Dc was 33 ± 10% (n = 7). When the distance was increased to 6 mm, the post-sonication diameter constricted by 27 ± 15% (n = 3) in diameter. Table 9 provides the detailed result of groups #1, #4 and #5.
Table 9. Summary of vessel contraction after sonication with 10 s cooling time for three different distances between focus and posterior wall.
| No. | l (mm) | d (mm) | Dc (%) | Ac (%) |
|---|---|---|---|---|
| #1 (n = 9) | 2 | 3.5 ± 0.4 | 39 ± 9 | 32 ± 8 |
| #4 (n = 7) | 4 | 3.2 ± 0.2 | 33 ± 10 | 26 ± 12 |
| #5 (n = 3) | 6 | 3.6 ± 0.1 a | 27 ± 15 | 18 ± 6b |
With phantom #2 sonicated at 5.3 W, no cooling time was set and the flow rate was 5 cm s−1. The Dc of the sonicated vessels (l = 4 mm) was 1.5 times as large as that with 2 mm distance (p < 0.05). When the l was 2 mm, the Dc was 22 ± 10% (n = 7), while the Dc was increased to 34 ± 9% (n = 11) when the l was 4 mm. Table 10 provides the detailed result of groups #6 and #7.
Cooling time
With phantom #2 sonicated at 5.3 W, the flow rate was 5 cm s−1 and the l was 2 mm. The Dc of the sonicated vessels with 10 s cooling time was 1.8 times as large as that without cooling time (p < 0.05). The Dc was 39 ± 9% (n = 9) with 10 s cooling time, whereas the Dc was decreased to 22 ± 10% (n = 7) without cooling time. Table 11 provides the detailed result of groups #1 and #6.
Table 11. Summary of vessel contraction after sonication with 2 mm distance and different cooling times.
| No. | tc (s) | d (mm) | Dc (%) | Ac (%) |
|---|---|---|---|---|
| #1 (n = 9) | 10 | 3.5 ± 0.4 | 39 ± 9 | 32 ± 8 |
| #6 (n = 7) | 0 | 3.2 ± 0.2 | 22 ± 10 a | 14 ± 12 a |
With phantom #2 sonicated at 5.3 W, the flow rate was 5 cm s−1 and the l became 4 mm. The post-sonication diameter was constricted by 33 ± 10% (n = 7) in diameter with 10 s cooling time. The Dc was increased to 34 ± 9% (n = 11) without cooling time. Table 12 provides the detailed result of groups #4 and #7.
Table 12. Summary of vessel contraction after sonication with 4 mm distance and different cooling times.
| No. | tc (s) | d (mm) | Dc (%) | Ac (%) |
|---|---|---|---|---|
| #4 (n = 7) | 10 | 3.2 ± 0.2 | 33 ± 10 | 26 ± 12 |
| #7 (n = 11) | 0 | 3.4 ± 0.3 | 34 ± 9 | 28 ± 11 |
Microscope view and histology
Figures 4(b) and (c) demonstrate that the microscope view of the post-sonication vessel was consistent with its histological section. In comparison with the vessel wall without sonication in figure 4(d), the sonicated vessel wall became thickened and multiple inward bulges (arrow heads) could be observed in figure 4(a). Besides, the elastic fibroblasts swelled with their intercellular spaces enlarged, and the cavities or microcapsules (arrows) appeared in some elastic fibroblasts. The elastic fibers degenerated in a wavy shape. Obvious hyalinization (stars) was found in the tunica adventitia.
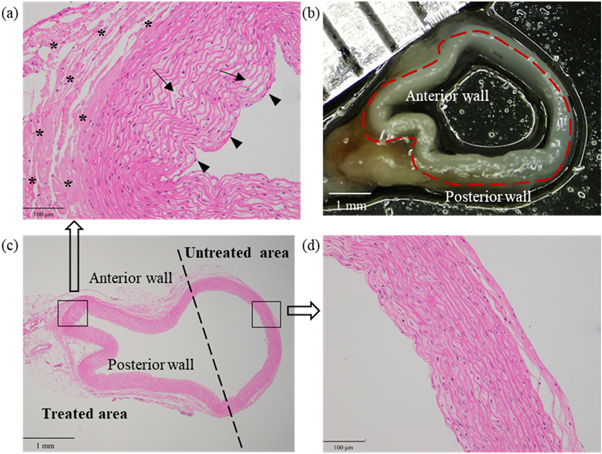
Figure 4. H&E stains and microscope observation of one post-sonication vessel in group #7. (a) The pathological result of the treated area (200×). Cavities or microcapsules (arrows) between some elastic fibroblasts and multiple inward bulges (arrow heads). (b) The microscopic result of the whole vessel. (c) The pathological result of the whole vessel (20×). (d) The pathological result of the untreated area (200×).
Download figure:
Standard image High-resolution imageWith phantom #2 sonicated at 5.3 W, no cooling time was set and l was 4 mm. Figures 5(a) and (b) demonstrate the H&E stains of the vessel with 5 cm s−1 flow rate in group #7 and that without flow in group #9. After sonication, the vascular wall without flow was obviously thicker than that with 5 cm s−1 flow rate. The lumen area was decreased due to the thickened vessel wall. The number of cavities or microcapsules without flow was higher than that with 5 cm s−1 flow rate.
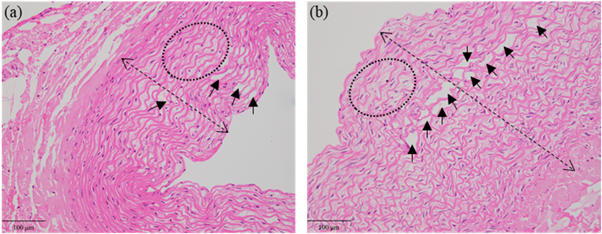
Figure 5. H&E stains of the vessels with 5 cm s−1 flow rate (a) and without flow (b). The double arrow indicates the wall thickness and the arrows indicate the cavities or microcapsules. The deformation of elastic fibers is shown in the ellipse.
Download figure:
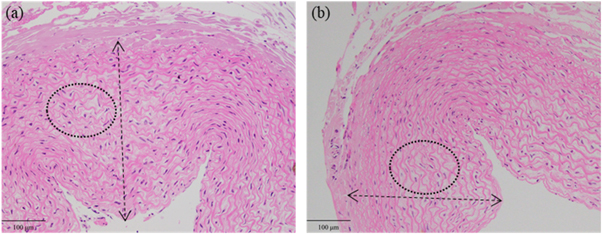
Standard image High-resolution imageWith phantom #2 sonicated with 10 s cooling time, the l was 2 mm and the flow rate was 5 cm s−1. Figures 6(a) and (b) demonstrate the H&E stains of vessels sonicated at 5.3 W in group #1 and 3.5 W in group #3. The vascular wall at 5.3 W was thicker than that at 3.5 W.
Figure 6. H&E stains of the vessels sonicated at 5.3 W (a) and 3.5 W (b). The double arrow indicates the thickness of vascular wall. The deformation of elastic fibers is shown in the ellipse.
Download figure:
Standard image High-resolution image
Discussion
Vascular phantom
A simple and reliable vascular phantom has been fabricated. Such phantom can be obtained by embedding ex vivo vessel (or vessel mimic tube) into the tissue-mimic phantom, and the vessel integration is convenient and cost-effective. The blood mimic solution was used as the circulating fluid instead of water (Dasgupta et al 2011, Siu et al 2017, Zhou and Lim 2021), or heparin-added animal blood (Greaby et al 2007, Henderson et al 2010). The ingredients of the blood mimic solution are easily obtained and stored, and this solution is also simple to be prepared. Compared with the previous experimental setups (Petrusca et al 2009, Henderson et al 2010), a peristaltic pump was used to circulate the blood mimic solution, and such design was much simpler than an electromagnetically driven metering pump (Greaby et al 2007). The flow rate was also significantly higher than that in the previous study (Pichardo et al 2006, Zhou and Lim 2021), and it was quite close to the real blood flow rate. The model of the ex vivo vascular phantom can be used to explore the effects of sonication parameters before in vivo study.
Vascular parameters
The microscope images of post-sonication sectioned vessel have shown the more obvious contraction in the anterior wall than that in the posterior wall. The pathology results have also demonstrated that the anterior walls were more inwardly concave than the posterior walls, which is in consistence with the microscope images (see figure 4). Compared with the posterior walls, the damage to the adventitial cells in the anterior wall were more serious and the vacuolization was prone to appear in the cells of the medial elastic fiber layer. Ota et al (2009) have found the similar vacuolization or even spongiosis in the cells in the post-sonication areas. After sonication, the venous lumen was obviously reduced due to coagulative type necrosis and loss of elastic fibers in the adventitia, and marked edema and constriction of the media (Henderson et al 2010). Besides, the substantial thickening was observed in the sonicated venous wall (Pichardo et al 2006). In this study, the temperatures were measured within the lesion and then obtained through the fitting. Tables S5–S11 demonstrate that the post-sonication temperatures on the anterior wall were much higher than those on the posterior wall. Although they were not the actual peak temperature on both vessel walls, they could explain some pathological results (figures S3 and S4). Therefore, the wall temperature is one vital factor affecting the vascular contraction.
Table S1 has demonstrated smaller tube diameter could result in higher occlusion level. The vascular diameter was positively correlated with the convective cooling effect (Solovchuk et al 2013, Mohammadpour and Firoozabadi 2019). The temperature on vessel walls greatly decreased for the 3 mm diameter (Solovchuk et al 2013). Thus, the increase in diameter can enhance the convective cooling effect of blood flow and take away more heat. In addition, the compressed vessels could decrease the lumen area in sonication and promote the occlusion (Ota et al 2009, Barnat et al 2019). Local anesthetics could also be injected into the surrounding tissue to cause edema and squeeze vessels (Senoo et al 2011). Table S2 has demonstrated that it is easier for the tube with lower flow rate to result in occlusion, and the tubes without flow were more likely to be occluded. Tables 6 and 7 have illustrated that higher flow rate resulted in lower Dc in phantom #2. The flow rate can influence the sonication efficiency because increasing flow rate can enhance the convection and prevent the temperature elevation on the vessel walls.
Acoustic power
Table S3 has demonstrated that the post-sonication tube occlusion could be associated with higher acoustic power. There are some differences in the acoustic and thermal properties between the tube and the ex vivo vessel. When the tube is heated over 80 °C, it will irreversibly shrink, and the heated tube is more malleable and prone to deformation. After heating, the acoustic impedance of the tube is changed, and strong reflection occurred at the phantom-tube interface. The ex vivo vessel has a certain thermal elasticity, and could return to the original state after heating. The phantom #1 was used to determine the appropriate sonication parameters for the phantom #2. Table 8 has shown that higher acoustic power resulted in higher Dc and Ac in phantom #2. The increase in acoustic power can expand the lesion into the walls, which is beneficial for vascular contraction. Moreover, the acoustic power would determine the acoustic intensity through the −6 dB size, and increasing the acoustic power may rapidly increase the temperature. The acoustic cavitation and nonlinear effect could appear with the acoustic power increased. The inertial cavitation at appropriate peak negative pressure and low duty factor could damage the endothelia and promote thrombogenesis (Hwang et al 2005), and it was beneficial to the vascular occlusion and hemostasis, while the cavitation effect may also cause vascular rupture or perforation, even bleeding (Shaw et al 2014), and it was not helpful for the vascular occlusion. The nonlinearity could rapidly increase the temperature on vessel walls (Solovchuk et al 2013) and generate higher acoustic radiation force and acoustic streaming. The local pressure gradient in the artery may be disrupted and the vessel may be temporarily compressed, which could promote the vascular contraction or even occlusion (Shaw et al 2014).
Lesion size
The role of distance between focus and posterior wall cannot be ignored in the vessel contraction for phantom #2. With the distance increased, the pressure of the focus decreased due to the increase in attenuation, and the axial length of the lesion was also decreased. The temperature rise on the anterior wall (Tar) was decreased and the temperature rise on the posterior wall (Tpr) was increased with the distance increased (see tables S8 and S9). The lateral lengths of lesion along the directions of posterior wall gradually increased. In comparison with the groups with 4 and 6 mm distances (groups #4 and #5), the Dc and Ac with 2 mm distance (group #1) were also largest. Without cooling time, the Dc and Ac of the vessels with 4 mm distance (group #7) was higher than that with 2 mm distance. The lateral lengths of lesion were 3 mm and 2 mm respectively along the directions of posterior wall in groups #7 and #6.
Larger lesion covering the vessel wall could lead to more vessel contraction. The size of lesion within the phantom without cooling time is different from that with cooling time. The cooling time can prolong the effective sonication time on the vascular wall (see videos 1 and 2), and it can enlarge the lesion area on the vessel wall. When the acoustic power was 5.3 W, figure S2 demonstrates that the lesion formed by the sonication without cooling time was close to that with 10 s cooling time. With 10 s cooling time added, the lateral lengths of lesion were 6 mm and 4 mm respectively along the anterior and posterior walls, while they were 5 and 3 mm without cooling time. And the Dc and Ac of vessels with cooling time was also higher (see table 11). Video 1 demonstrates that the lesion continued to expand towards the transducer, and the lesion formed by the consequent sonication was away from the vessel wall. Table 12 shows that the Dc and Ac with 10 s cooling time was close to those without cooling time for the 4 mm distance. Therefore, the cooling time and distance between focus and posterior wall together affect vascular shrinkage, and increasing the lesion length along the direction of the vessel walls can promote the vessel occlusion.
The lesion size depends on the frequency, aperture and curvature radius of the transducer. The radial length of the compressed vessel was close to the half circumference of the vessel wall (about 6 mm). The lateral length of lesion along the anterior wall was over the half radial length of the compressed vessel, however, the lateral length of lesion along the posterior wall was less than the half length of the compressed vessel. Therefore, only a fraction of the vessel section was covered by the lesion and figure S3 shows that the length of sonicated anterior wall was longer than that of posterior wall. Besides, figure S4 demonstrates that the lengths of the deformation area of the vessel wall were shorter than the lateral lengths of lesion within the phantom. The vessel will be more likely to be occluded once the lumen can be completely covered by the lesion, because the veins were almost completely occluded once the radial coverage area were 1.8 times the diameter (Barnat et al 2019). In the clinical practice, the lesion is needed to cover the entire vessel lumen to ensure the occlusion.
Limitations and future work
There are still several limitations in this study. Firstly, limited by the output range of power amplifier, higher acoustic power could not be used. Sonication time would be reduced once increasing the acoustic power, and the temperature of the vessel wall would be elevated fast and it is more conducive for vessel closure. Secondly, the lateral length of lesion along the vessel walls was between 2 and 6 mm, which could not cover the entire vascular lumen. It would be useful to increase the lateral length of lesion for vessel occlusion, and it could be achieved by spot-by-spot sonications or simultaneous sonications of several transducers. If several different foci along the vessel wall are sonicated at the same time, the pressure distribution would be complex because of the possible interference, and the pressure distribution of several transducers needs to be characterized. In the previous studies (Rivens et al 1999, Denbow et al 2000, Ishikawa et al 2003, Okai et al 2013, Shaw et al 2016, Shaw et al 2018, Shaw et al 2019), the operating frequencies of the transducers have varied in the range of 1.6–3.2 MHz, and the acoustic intensities are concentrated at 1300–5700 W cm−12 for the placental vessel occlusion. The peak acoustic intensity of 28 000 W cm−12 has been used to treat large-diameter veins. Thus, the range of peak acoustic intensity is very wide, and the relation of peak acoustic intensity and safe vessel occlusion is still unclear, which needs to be studied in future. Thirdly, the actual peak temperatures on both vessel walls were not acquired because of the following reasons: (1) the insertion positions of the two thermocouples were within the lesions rather than on the vessel walls; (2) although the insertion was performed by the same person (Huang), it could not ensure that the positions of the two thermocouples were the same ones in the lesions for each insertion; (3) there was unignorable delay between the sonication end and the insertion, and the delay may vary, which sometimes resulted in the small number of temperature samples and made the fitting peak temperature inaccurate. MR thermometry (Winter et al 2016), ultrasound thermometry (Ebbini et al 2018) and some invasive temperature measurements (Wust et al 2006) could be used to map the accurate temperature in future. Finally, this study was an ex vivo study, and in vivo study should be conducted in future. The ex vivo results can provide guidance for the choice of the parameters in the in vivo study.
Conclusion
In this study, a vascular phantom has been established to evaluate the effect of vascular and HIFU sonication parameters on the ex vivo vessel. The flow rate and acoustic power have great impact on the vessel contraction. In addition, the distance between the focus and posterior wall and cooling time could influence the lesion along the vessel wall, and the vessel covered by the lesion would more likely to be occluded.
Acknowledgments
This work has been supported in part by the Scientific Innovative Programs from Shanghai Jiao Tong University (YG2019ZDA21). The reviewers are also appreciated for their valuable comments.