
Abstract
Objective. Histotripsy is a non-thermal focused ultrasound ablation method that destroys tissue through the generation of a cavitation bubble cloud. Previous work studying intrinsic threshold histotripsy has shown that dense bubble clouds can be formed by a single-cycle pulse when the negative pressure exceeds an intrinsic threshold of ∼25–30 MPa, with the ablation efficiency dependent upon the size and density of bubbles within the cloud. This work investigates the effects of frequency on bubble-cloud behavior and ablation efficiency in intrinsic threshold histotripsy. Approach. A modular transducer was used to expose agarose tissue phantoms to 500 kHz, 1 MHz, or 3 MHz, histotripsy pulses. Optical imaging was used to measure the bubble-cloud dimensions, bubble density, and bubble size. The effects of frequency on ablation efficiency were also investigated by applying histotripsy to red blood cell (RBC) phantoms. Main results. Results revealed that the bubble-cloud size closely matched theoretical predictions for all frequencies. The bubble density, which is a measure of the number of bubbles per unit area, was shown to increase with increasing frequency while the size of individual bubbles within the cloud decreased at higher frequencies. Finally, RBC phantom experiments showed decreasing ablation efficiency with increasing frequency. Significance. Overall, results demonstrate the effects of frequency on histotripsy bubble-cloud behavior and show that lower frequency generates more efficient tissue ablation, primarily due to enhanced bubble expansion.
Export citation and abstract BibTeX RIS

Original content from this work may be used under the terms of the Creative Commons Attribution 4.0 licence. Any further distribution of this work must maintain attribution to the author(s) and the title of the work, journal citation and DOI.
Introduction
Histotripsy is a non-invasive and non-thermal ultrasound ablation method that destroys tissue through the precise control of acoustic cavitation (Xu et al 2004, Parsons et al 2006, Vlaisavljevich et al 2013b, 2016c). A focused ultrasound transducer generates the histotripsy 'bubble cloud' using high pressure (often >20 MPa) and short duration (<20 μs) pulses applied at very low duty cycles (<1%) (Bader et al 2019). The rapid expansion and collapse of the individual bubbles inside the histotripsy bubble cloud induce high stress and strain in the targeted tissue structures (cells and extracellular matrix), resulting in the ablation of the tissue into acellular debris (Xu et al 2007, Hall et al 2009, Vlaisavljevich et al 2016c). Over multiple pulses, histotripsy results in well-defined lesions closely matching the size and location of the bubble cloud (Zhang et al 2015, Vlaisavljevich et al 2017), with the number of pulses required to generate complete ablation of the focal volume dependent on the tissue properties and bubble-cloud behavior (Vlaisavljevich et al 2014a, 2017, Edsall et al 2021). Histotripsy can therefore ablate three-dimensional volumes of any required size and shape by translating the focal zone, as determined by the diffraction pattern of the array, through a predetermined volume. Due to these features, histotripsy is currently being developed for many clinical applications including the treatment of kidney stones (Duryea et al 2011), benign prostatic hyperplasia (Hempel et al 2011, Roberts et al 2014, Schuster et al 2018), deep vein thrombosis (Maxwell et al 2011a, Zhang et al 2015, Goudot et al 2019, Bader et al 2021), congenital heart disease (Xu et al 2010, Owens et al 2011, Miller et al 2013), biofilm ablation (Xu et al 2012, Bigelow et al 2018, Childers et al 2021), and cancer (Vlaisavljevich et al 2013b, 2016b, Brisbane et al 2017, Smolock et al 2018, Longo et al 2019, Schade et al 2019).
Three methods for generating histotripsy bubble clouds have been established in prior work: shock scattering histotripsy, boiling histotripsy, and intrinsic threshold histotripsy (Bader et al 2019). In shock scattering histotripsy, multi-cycle pulses (∼3–20 cycles) at peak negative pressures (p−) ranging from ∼10 to 28 MPa (with corresponding peak positive pressures, p+, of >30 MPa) form bubble clouds through shock scattering from initial bubbles that are expanded during the first cycles of the pulse (Maxwell et al 2010a, Maxwell et al 2011b, Vlaisavljevich et al 2014b, Bader et al 2019). In boiling histotripsy, much longer pulses (>5000 cycles) at moderate intensity (p− of <20 MPa ) are used to generate bubble clouds through shock-induced boiling with highly shocked p+ pressure, >70 MPa (Khokhlova et al 2011, 2017). In intrinsic threshold histotripsy, a single pulse (≤2 cycles) with a single dominant negative pressure phase is used to form a bubble cloud directly from the negative pressure of the incident wave (Maxwell et al 2013, Vlaisavljevich et al 2015b). Cavitation initiation depends on the amplitude and duration of the applied negative pressure and the material properties of the media, with the p− intrinsic threshold measured to be ∼25–30 MPa for water-based soft tissues (Maxwell et al 2013, Vlaisavljevich et al 2013a, 2015b, 2016a). The effects of pulsing parameters on bubble-cloud geometry in intrinsic threshold histotripsy have been studied extensively, with results showing that the size and shape of the bubble cloud closely match the portion of the focal region above the intrinsic threshold, allowing for precise control over the size of the histotripsy ablation zone (Lin et al 2014b, Vlaisavljevich et al 2015a, 2017). Prior work has investigated the effects of frequency on individual bubbles generated near the intrinsic threshold, with results showing that lower frequency pulses create larger bubbles compared to higher frequencies, due to the longer duration of the applied p− (Vlaisavljevich et al 2015c, Bader and Holland 2016, Mancia et al 2017). These findings have led to the hypothesis that lower frequency treatments will be more efficient at ablating tissue due to the larger individual bubbles, which induce higher strain on the targeted tissue (Vlaisavljevich et al 2016c, Mancia et al 2017, Bader 2018). This hypothesis has been supported by theoretical studies exploring the effects of frequency on histotripsy bubble expansion in viscoelastic tissues using both single-bubble (Mancia et al 2017) and analytical models (Bader 2018).
Although these prior studies have experimentally and theoretically investigated the effects of frequency on individual bubble dynamics, there has been limited work studying the effects of frequency and other pulsing parameters on the bubble-cloud characteristics (i.e. the number, size, and density of bubbles within the cloud) and the resulting ablation efficiency. A study investigating the effects of transducer f-number on intrinsic threshold histotripsy showed a significant decrease in bubble density and a corresponding decrease in ablation efficiency for higher f-number transducers at a single frequency (500 kHz) (Vlaisavljevich et al 2017). This study demonstrated the importance of bubble density as a metric for predicting histotripsy treatment efficiency along with cloud size and individual bubble expansion. Additionally, this work highlighted the need for more thorough investigations into the effects of pulsing parameters, such as frequency, on histotripsy bubble-cloud characteristics and ablation efficiency.
This study aims to confirm prior research that has suggested that lower frequency results in both larger bubble clouds and larger individual bubbles within the clouds. In addition, this study will experimentally investigate the effects of frequency on bubble-cloud characteristics including the number of bubbles within the histotripsy bubble clouds and the density of bubbles within the clouds, and the resulting ablation efficiency. To study the effects of frequency independent of changes in transducer size and geometry, a custom-designed, modular histotripsy transducer with interchangeable elements was constructed. Using this system, histotripsy bubble-clouds were generated inside agarose tissue phantoms and the cavitation activity was captured using high-speed optical imaging to compare the bubble-cloud dimensions, number of bubbles, bubble density (number of bubbles/unit area), and the ablation efficiency for 500 kHz, 1 MHz, and 3 MHz conditions, with ablation efficiency defined as the number of pulses required to ablate the cross-sectional area of the focus (Maxwell et al 2010b, Wang et al 2012, Vlaisavljevich et al 2017).
Based on previous studies, we hypothesized that the bubble-cloud size and the size of individual bubbles within the cloud would both decrease with increasing frequency due to the smaller focal region and the shorter duration of the applied negative pressure at higher frequencies, respectively. We further hypothesized that bubble density within the bubble cloud would increase with higher frequency due to the high-frequency pulse generating a similar number of cavitation events in a smaller focal region, resulting in a larger proportion of bubbles per unit area when normalized to the size of the focal region. Finally, based on this hypothesis and prior work showing a decrease in the size of individual bubbles within the cloud at higher frequencies, we hypothesized that higher frequency could lead to competing trends of increasing ablation efficiency due to bubble density but decreased ablation efficiency due to the smaller individual bubbles.
Methods
Ultrasound pulse generation
A custom-designed, modular histotripsy transducer array with an aperture size of 120.5 mm, a geometric focus of 75 mm, and an f-number of 0.62 was used for all experiments in this study (figure 1). The transducer was comprised of three concentric rings of six, twelve, and fourteen ports, which could be populated by thirty-two interchangeable 500 kHz, 1 MHz, or 3 MHz elements.

Figure 1. Experimental schematic. High-speed optical imaging captured cavitation behavior and red blood cell (RBC) ablation inside agarose tissue phantoms exposed to successive histotripsy pulses generated by the 32-element modular transducer at 500 kHz, 1 MHz, and 3 MHz.
Download figure:
Standard image High-resolution imageFor all experiments, the transducer was positioned horizontally in a tank of degassed tap water with a dissolved oxygen concentration <28% of saturation. The individual elements were driven by a custom high-voltage amplifier designed to generate short therapy pulses of <2 cycles. The amplifier was populated with interchangeable amplifier boards to match the frequency of the elements being driven. A field-programmable gate array (FPGA) board (Altera DE0-Nano Terasic Technology, Hsinchu, Taiwan) was programmed with a custom microcontroller to synchronize the pulse arrivals by controlling the phase-delay and amplitude of each individual element. A computerized positioning system was used to guide the motion of agarose tissue phantoms or hydrophones used in the respective experiments. Microcontroller instructions and the positioner locations were serialized and communicated via a MATLAB (The MathWorks, Natick, MA, USA) script for each experiment (figure 1).
Hydrophone focal pressure calibration
A fiber optic probe hydrophone (FOPH) measured pressure waveforms for 500 kHz, 1 MHz, and 3 MHz pulsing conditions (figure 2). The FOPH was cross-calibrated with a high-sensitivity reference rod hydrophone (HNR-0500, Onda Corporation, Sunnyvale, CA, USA) at nine points between 0 and 5 MPa peak-to-peak to ensure the FOPH accurately measured the pressures. The FOPH directly measured the waveforms in degassed water up to p− = 18.5 MPa. At higher pressures up to p− = 42 MPa, the focal pressures were estimated by summing the outputs of transducer sub-apertures of sixteen elements or eight elements to avoid cavitation damaging the hydrophone (Vlaisavljevich et al 2017). An oscilloscope (TBS2000 series, Tektronix, Beaverton, OR, USA) was used to process all waveforms at a sample rate of 500 MS s−1. The waveforms were averaged over 512 pulses to minimize noise from the FOPH, and the final waveform was recorded to MATLAB. Finally, in addition to the focal waveforms, 1D beam profiles in the axial, transverse, and elevational directions were measured using the high-sensitivity rod hydrophone for all frequency conditions.
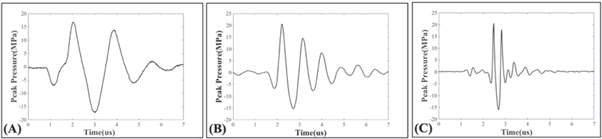
Figure 2. Frequency condition waveforms. Example acoustic waveforms for the (A) 500 kHz, (B) 1 MHz, and (C) 3 MHz pulsing conditions used in this study.
Download figure:
Standard image High-resolution imageAgarose gel phantom preparation
The viscoelastic properties of soft tissue were replicated in this study by 1% (w/v) agarose tissue phantoms using methods similar to those in prior cavitation studies (Maxwell et al 2010b, Vlaisavljevich et al 2017, Edsall et al 2021). A prior study showed 1% w/v agarose to have a Young's modulus of 21.7 kPa (Vlaisavljevich et al 2015c), which is within the range of ∼6–25 kPa characteristic of relevant target tissues for histotripsy treatments (Yamada 1973, Duck 1990). The agarose gel tissue phantom was made by mixing 0.5% agarose powder (Type VII-A, Sigma Aldrich Corporation, St. Louis, MO, USA) with 99.5% deionized water at room temperature until evenly dispersed. The mixture was heated until boiling in a microwave and then stirred until the agarose powder was fully dissolved. The mixture was repeatedly heated to boiling and immediately stirred to induce flash boiling to release dissolved gas from the mixture. This process was repeated until 50% of the volume remained to obtain a degassed 1% (w/v) liquid agarose gel mixture. The mixture was placed in a vacuum desiccator and kept under a partial vacuum (∼33.62 kPa, absolute) for twenty-five minutes to remove remaining gas and minimize re-gassing as the agarose cooled. Any remaining gas was forced from solution by decreasing the pressure to 16.75 kPa for the final five minutes. Once the temperature of the agarose mixture dropped to 40 °C, 100 ml of the gel was slowly added by serological pipette down the wall of a rectangular silicone mold into a custom-designed poly-lactic-acid (PLA) phantom holder frame. The agarose-filled mold was stored in a refrigerator for one hour to solidify. Experiments were performed within two hours of each gel's creation to ensure a consistent agarose concentration and maintain the gel's degassed state during testing.
Cavitation detection using optical imaging
Optical imaging was used to characterize the bubble clouds generated by the 500 kHz, 1 MHz, and 3 MHz pulsing. A machine-vision camera (FLIR Blackfly S monochrome, BFS-U3-32S4M-C 3.2 MP, 118 FPS, Sony IMX252, Mono, FLIR Integrated Imaging Solutions, Richmond, BC, Canada) with a global shutter and a 100 mm F2.8 Macro lens (Tokina AT-X Pro, Kenko Tokina Co., LTD, Tokyo, Japan) captured images with a resolution of 3.25 μm per pixel and a depth of field of ∼0.7 mm. The samples were backlit using a custom high-speed LED strobe light. Both the camera and strobe light were individually controlled by triggers from the amplifier box with the camera shutter opening synchronized with the histotripsy pulse generation and the strobe acting as the shutter. Strobe duration was kept as short as possible (3 μs) to minimize the motion blur of the expanding bubbles while maintaining sufficient lighting. All exposures were centered to a delay at 7 μs after pulse convergence. This time point occurred prior to the time between 8 and 50 μs at which the bubbles have previously been reported to reach their maximum radius, Rmax, at these tested frequencies (Vlaisavljevich et al 2015c, Mancia et al 2017) and was determined to be the optimum time delay to detect clearly visible bubbles while minimizing the overlap of adjacent bubbles within the cloud as became more prevalent with larger bubbles at later time points. The timing accuracy of the amplifier, camera trigger, and strobe trigger was accurate to the 10 ns clock speed of the FPGA board. A 0.5 Hz pulse repetition frequency (PRF) was used for bubble-cloud characterization experiments to minimize memory effect on subsequent pulses (Maxwell et al 2013). Since each image was taken very early in the life of the bubble cloud at a low PRF, it was possible to accurately identify individual bubbles within each image for most samples. The optical images for each sample were analyzed using a custom MATLAB script that identified bubble clouds for dimensional measurement by converting the captured grayscale image (figure 3(B)) into a negative binary image based on an intensity threshold determined by the difference from the background intensity as described in a previous study (figure 3(C)) (Maxwell et al 2013). For counting the number of bubbles in the cloud, individual bubbles were identified using this same thresholding technique with the additional use of distance transform watershed lines to identify curvature to separate overlapping bubbles. Only regions with >5 pixels were counted as bubbles and the output of each image was visually confirmed by at least two independent readers before analysis. Using these criteria, the minimum resolvable bubble diameter was ∼16 μm.
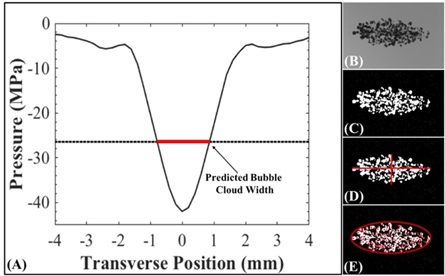
Figure 3. Bubble-cloud size: predicted versus measured methods. (A) Scaled 1D beam profiles were used to predict the bubble-cloud dimensions (plot shows an example 500 kHz transverse beam profile scaled to p − = 42 MPa). Bubble-cloud dimensions were measured by processing optical images. Images on the right show the original cloud image (B), converted binary image (C), dimensional measurements (D), and bubble numbers with area calculated from axial and transverse measurements (E). Measured dimension results were compared to the predicted dimension results.
Download figure:
Standard image High-resolution imageCavitation threshold calculation
Cavitation thresholds were obtained for each frequency condition by applying one-hundred histotripsy pulses to a single point in the tissue phantoms at p− levels ranging from 0 to 40 MPa in increments of 2 MPa. The possibility of an earlier pulse altering the probability of cavitation on the subsequent pulse was minimized by applying the pulses at a PRF of 0.5 Hz to allow sufficient time between pulses or the residual bubbles to dissolve before the subsequent pulse arrived (Maxwell et al 2013, Vlaisavljevich et al 2015a). All points were created at a uniform depth into the agarose phantom in the axial direction. A new point was used for every pressure separated by at least two times the predicted transverse/elevational dimensions of the cloud as determined by 1D beam profiles scaled to 40 MPa. The cavitation probability, pcav, was determined for each pressure level as the fraction of the total one-hundred pulses for which cavitation was detected by high-speed optical imaging. The cavitation threshold, pt , is defined as the p− corresponding to pcav = 0.5.
The cavitation threshold for each frequency, p− 500kHz , p− 1MHz , p− 3MHz , and p− Dual , was determined using a previously reported method (Maxwell et al 2013, Vlaisavljevich et al 2015b) whereby the probability of observing cavitation follow a sigmoid function given as

where erf is the error function, pt is the negative pressure at which the probability pcav = 0.5, and σ is a variable related to the width of the transition between pcav = 0 and pcav = 1, with ± σ giving the difference in pressure from about pcav = 0.15 to pcav = 0.85 for the fit (Maxwell et al 2013). MATLAB software was used for curve fitting all data sets.
Characterization of bubble-cloud dimensions: predicted
The predicted bubble-cloud dimensions generated by each frequency and pressure level were estimated by following a previously published method (Roberts et al 2014, Vlaisavljevich et al 2017). 1D beam profiles measured by the high-sensitivity rod hydrophone in the elevational, transverse, and axial directions of the transducer for all frequency conditions were normalized to the p− at the focus for each pressure level tested experimentally. The predicted bubble-cloud dimensions for each p− were then estimated by measuring the distance between the intersections of the experimentally measured cavitation thresholds and the normalized beam profile (figure 3(A)). These predicted bubble-cloud dimensions were compared to the cloud dimensions measured experimentally using optical imaging, as described in the next section (figure 3(D)).
Characterization of bubble-cloud dimensions: measured
The effect of frequency on the bubble-cloud size was observed by capturing bubble clouds for each frequency condition of 500 kHz, 1 MHz, and 3 MHz using optical imaging, as described above. For each frequency, 75 histotripsy pulses were applied to agarose phantoms for each frequency and pressure level combination. To minimize the effects of tissue phantom liquefaction on the results, 25 histotripsy pulses each were applied to three separate locations within the agarose tissue phantom, with the results pooled together to total 75 bubble-cloud images for each pressure level tested. The cloud length was measured as the distance from the closest edge of the nearest bubble to the transducer to the furthest edge of the furthest bubble from the transducer. Similarly, the cloud width was defined as the distance from the furthest edge of the bubble highest in the positive transverse direction to the furthest edge of the lowest bubble in the negative transverse direction (figure 3(D)).
Characterization of bubble number and bubble-cloud density
A custom MATLAB cloud analysis program counted the number of bubbles in each binary image by identifying the centroids to determine the number of bubbles in each cloud. The area of the cloud was determined by an elliptical area approximation using the axial and transverse 1D beam profile measurements scaled to the respective pressure levels and the equation:  The bubble density within the cloud was calculated by dividing the number of bubbles for each cloud by the corresponding predicted cross-sectional area of the cloud (figure 3(E)). Using the imaging techniques described in the cavitation detection using optical imaging section above, the maximum number of bubbles that could be theoretically counted at the minimum bubble diameter would be ∼3800 bubbles mm−2 assuming the bubbles were aligned diameter-to-diameter in a uniform matrix across the focus. This resolution decreases as bubbles expand larger than the minimum resolvable bubble diameter. It should be noted that due to these limitations, in bubble cloud regions of high bubble overlap and coalescence, this method may not completely identify the entirety of every individual bubble but will still identify the centroid of the majority of the bubbles in these regions. The differences in mean cloud density across all pressure levels at each frequency and across all frequency conditions were compared in PRISM (GraphPad Software, San Francisco, CA, USA) using a two-way ANOVA analysis and Student's t-test comparisons. For all comparisons, p-values less than 0.05 were considered significant.
Red blood cell (RBC) phantom creation
RBC phantoms comprised of three agarose layers, with the middle layer containing 5% (v/v) red blood cells were created for ablation experiments (Maxwell et al 2010b, Vlaisavljevich et al 2013a, Edsall et al 2021). A 1% agarose mixture was produced using the preparation described above but using degassed 0.9% saline in place of deionized water. Fresh porcine blood was obtained from subjects in an unrelated study and added to an anticoagulant solution of Citrate Phosphate Dextrose Anticoagulant (CPD, Sigma Aldrich Corporation, St. Louis, MO, USA) with a CPD-to-blood ratio of 1:9 ml. Whole blood was separated by centrifugation at 1250 RCF for 10 min. The plasma and white buffy coat were removed by transfer pipet, and the RBCs were saved for addition to the phantom. An initial layer of agarose was poured into the silicone mold at 45 °C to create the base of the RBC phantom. The mold was placed in a refrigerator at 4 °C to allow the base agarose layer to cool and solidify. The remaining agarose mixture was kept in the vacuum chamber until it had cooled to 38 °C. Once cooled, 9.5 ml of the agarose was combined with 0.5 ml of RBCs by gentle inversion. The liquid RBC-agarose solution was poured onto the set agarose layer and quickly tilted to coat the entire surface. The excess was then immediately discarded leaving behind a thin layer of the RBC-agarose solution. The phantom was replaced in the refrigerator for five minutes. Once the RBC-agarose layer was solidified, the remaining agarose without RBCs was poured on top of the first two layers to fill the silicone mold. The phantom was replaced in the refrigerator for one hour to fully solidify, producing a thin layer of RBCs, approximately a single cellular layer thick, suspended in the center of the agarose phantom.
Red blood cell ablation
Tissue ablation for histotripsy bubble clouds was characterized using RBC phantoms. Ablation of the RBCs is visualized through successive pulses lysing the cells turning a region of the RBC layer from opaque to translucent (Maxwell et al 2010b, Wang et al 2012, Roberts et al 2014, Vlaisavljevich et al 2017). The RBC phantom was oriented at the focus of the transducer such that sound propagated parallel to the RBC layer, and 2000 histotripsy pulses were applied to the RBC layer at a PRF of 1 Hz and p− = 38 MPa for all frequency conditions. The layer was aligned with the center of the cloud using 0.1 mm increments on the positioning system to ensure the center of the cloud aligned with the RBC layer. The bubble cloud from each pulse and the resulting ablation after each pulse were recorded by high-speed optical imaging. A custom MATLAB script was used to separate the cloud images and the ablation images, and measure the ablated area for each pulse using image thresholding. Finally, ablation efficiency was determined as the number of pulses needed to completely ablate the central cross-sectional plane of the focus, which was determined by the mean area of the bubble cloud at the applied p−. The ablated area of each image was normalized by dividing each frame's measured ablated area by the average area of the bubble cloud to allow for a comparison of the relative ablative efficiency of histotripsy across all frequency conditions.
Results
Cavitation threshold and individual bubble size
Cavitation threshold experiments showed cavitation bubbles were observed for all frequencies when the pressure was increased above ∼24–26 MPa, with the number of bubbles and the area covered by the cavitation clouds increasing as p− was increased (figure 4). For all conditions, well-defined and sharply demarcated bubble clouds were observed, with larger bubble clouds containing more bubbles seen at higher pressure levels, confirming the results suggested by previous intrinsic threshold histotripsy studies (Maxwell et al 2013, Roberts et al 2014, Vlaisavljevich et al 2015c, 2017). The intrinsic thresholds were measured to be p− 500kHz = 26.4 MPa, p− 1MHz = 28.7 MPa, and p− 3MHz = 24.8 MPa for 500 kHz, 1 MHz, and 3 MHz, respectively. A distinct threshold behavior was observed as expected for all experimental conditions with σ mean values of σ 500kHz = 0.71, σ 1MHz = 1.02, and σ 3MHz = 0.65. Results show all frequencies produced histotripsy cavitation with distinct thresholds at similar pressures.
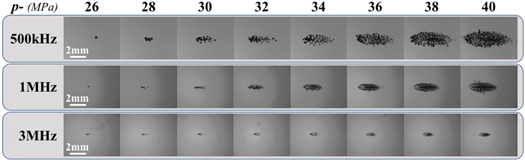
Figure 4. Bubble-cloud images. Optical images captured by high-speed imaging of cavitation bubble clouds generated inside 1% agarose phantoms by 500 kHz, 1 MHz, and 3 MHz shown at the same actual scale. Ultrasound propagating left to right.
Download figure:
Standard image High-resolution imageThe mean individual bubble size for each frequency condition was also quantified at pressures directly above the respective cavitation thresholds with values of R500kHz = 146.0 ± 16.7 μm, R1MHz = 70.2 ± 7.7 μm, and R3MHz = 29.9 ± 4.5 μm (n = 20). These measurements were obtained from images taken at the same time point (7 μs after the initial convergence of the separate pulses at the focus). Therefore, these measurements are predictably smaller than the values previously seen in modeling and in experimental studies where Rmax was the primary variable (Vlaisavljevich et al 2015c, Bader and Holland 2016). However, although these measurements are not the maximum bubble radius the measured bubble sizes at this time point during the growth phase of bubble expansion are consistent with those reported in prior experimental and theoretical studies of bubble expansion in intrinsic threshold histotripsy (Vlaisavljevich et al 2015c, Mancia et al 2017). Supplementary figure 1 (available online at stacks.iop.org/PMB/66/225009/mmedia) shows magnified images of the individual bubbles measured for each frequency condition.
Histotripsy bubble-cloud characterization: predicted versus measured
Images of histotripsy bubble clouds generated at p− ranging from 26 to 40 MPa (figure 4) showed larger bubble clouds were generated at higher p−. Close agreement between the measured and predicted cloud dimensions was observed for all frequency and pressure conditions (figure 5). The measured axial cloud dimensions shown in figure 5 ranged from 0.13 ± 0.32 mm to 5.78 ± 0.27 mm for 500 kHz, 0.23 ± 0.05 mm to 3.34 ± 0.22 mm for 1 MHz, and 0.14 ± 0.22 mm to 1.48 ± 0.06 mm for 3 MHz. The measured transverse cloud dimensions ranged from 0.10 ± 0.21 mm to 2.05 ± 0.10 mm for 500 kHz, 0.20 ± 0.33 mm to 1.50 ± 0.25 mm for 1 MHz, and 0.11 ± 0.16 mm to 0.53 ± 0.02 mm for 3 MHz (figure 5).
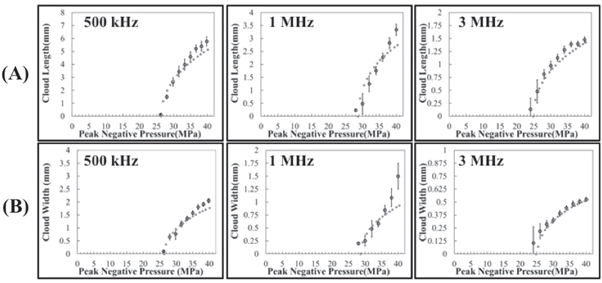
Figure 5. Bubble-cloud comparison: predicted versus measured. Plots show the measured bubble-cloud dimensions in the (A) axial and (B) transverse directions compared with the predicted bubble-cloud length and width obtained by measuring scaled 1D beam profiles for increasing pressures. Results show close agreement between the predicted (dotted line) and mean measured bubble-cloud size (open circles) for all frequency conditions.
Download figure:
Standard image High-resolution imageHistotripsy bubble-cloud characterization: number of bubbles and cloud density
Optical images (figures 4 and 6) of bubble clouds formed at all frequency and pressure conditions were further analyzed to quantify the number of bubbles in the cloud and to determine the density of the bubbles within the bubble cloud. Results show the number of bubbles significantly increased with increasing p− for all frequencies (figure 7). More specifically, the mean number of bubbles measured within the bubble clouds for between p− of 30–40 MPa ranged from 21.7 ± 5.8 to 191.8 ± 34.5 bubbles at 500 kHz, 4.4 ± 2.1 to 131.8 ± 23.2 bubbles at 1 MHz, and 37.3 ± 5.7 to 135.1 ± 12.7 bubbles at 3 MHz (figure 7(A)). It is worth noting that the thresholding, bubble curvature, and centroid analysis may not account for all of the bubbles in regions with significant overlap of several bubbles. This was especially limiting at higher p− when the density at the center of the bubble cloud became increasingly dense with expanding bubbles, likely resulting in an underestimate of bubbles (and density) at higher p− values. An example of this limitation is provided in supplementary figure 2.
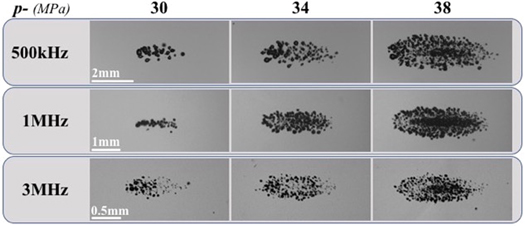
Figure 6. Selected scaled bubble-cloud images. Select images captured by high-speed optical imaging of cavitation bubble clouds generated inside 1% agarose phantoms by 500 kHz, 1 MHz, and 3 MHz. Frequency images were scaled (1.5× for 1 MHz and 3× for 3 MHz) maintaining the same aspect ratio of the image.
Download figure:
Standard image High-resolution image
Figure 7. Bubble-cloud comparison. Plots show the (A) bubble number as the mean number of bubbles counted within the clouds and (B) cloud density as the relative density of the clouds defined as the bubble number divided by the focal area predicted from 1D beam profiles (L/2)(W/2)π.
Download figure:
Standard image High-resolution imageThe bubble-cloud density at each of the frequency conditions was evaluated for p− levels ranging from 30 to 40 MPa by dividing the number of bubbles in each cloud by the area of the predicted focal region at that frequency and pressure condition (figure 7(B)). This p− range was chosen to compare the effects of frequency on bubble-cloud density for conditions at which fully-formed bubble clouds were generated for each frequency condition. Only pressures for which complete clouds were formed across all three frequency conditions were considered. At lower p− values closer to the intrinsic threshold (24–28 MPa), the cavitation clouds contained only a few bubbles inside smaller focal regions, resulting in less consistent cloud density measurements. Comparing the results between frequency groups showed increasing cloud densities with increasing frequency (figure 7(B)). Results showed significant differences in the cloud density between all frequency conditions at each examined pressure level (p < .05), with 3 MHz generating the highest densities and 500 kHz the lowest densities at each examined p−. 1 MHz was intermediate to 3 MHz and 500 kHz conditions (figure 7(B)).
Histotripsy ablation in RBC phantoms
Histotripsy ablation experiments showed that the extent of the damaged area in the RBC phantoms increased with increasing pulse number across all conditions (figure 8). Complete ablation of the entire focal region was seen within 2000 pulses for all frequency conditions (figure 8). For all frequencies, ablation created well-defined lesions with the ablated area of the RBC layer localized to the region of the focus in which cavitation was observed. Consistent with prior studies (Maxwell et al 2010b, Lin et al 2014b, Vlaisavljevich et al 2017), lesions formed with sharply delineated boundaries between the treated and untreated regions of the RBC layer. The total ablated area increased with each consecutive pulse for all conditions, with the total ablated area decreasing with increasing frequency (figure 9(A)). For all tested frequencies, the final ablated area of the RBC layer closely matched the bubble-cloud area for the respective frequency (figures 8 and 9(A)).
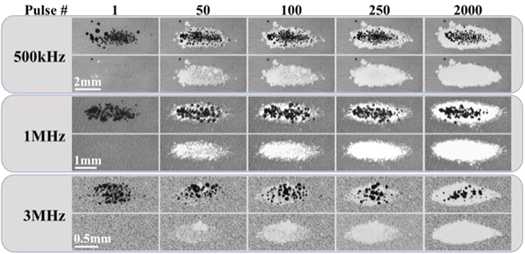
Figure 8. RBC ablation images. Images captured by high-speed optical imaging show the cavitation bubble cloud (dark) and histotripsy lesions (white) generated in RBC phantoms (gray) at 1 Hz PRF at 500 kHz, 1 MHz, and 3 MHz. The applied p − was 38 MPa for all frequency conditions. Ultrasound propagating left to right.
Download figure:
Standard image High-resolution image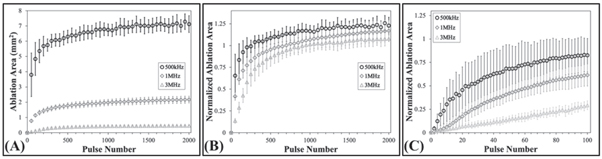
Figure 9. RBC ablation plots. Plots show (A) the mean and standard deviation of the measured ablation area formed after every 50th pulse in the RBC agarose gel phantoms at 0.5 Hz PRF histotripsy pulsing, (B) the measured ablation area for every 50th pulse normalized to the respective mean measured clouds areas formed in the RBCs, (C) and the normalized ablation areas following every second pulse of the first hundred pulses. The applied p − was 38 MPa for all frequency conditions.
Download figure:
Standard image High-resolution image
The ablation efficiencies for each condition were quantitatively compared by plotting the ablation area normalized to the mean measured histotripsy bubble cloud formed in the RBC phantom as a function of pulse number (figure 9(B)). The normalized lesion areas for all frequency conditions increased with pulse number, but showed a more rapid increase at the lower frequencies, corresponding to an increased ablation efficiency (figure 9(B) and table 1). More specifically, the 500 kHz treatments had the most rapid ablation of all conditions, achieving >75% ablation after a mean of 74.7 ± 61 pulses (table 1). The 1 MHz was the next most efficient, removing >75% of the focus in 200.7 ± 115.9 pulses (table 1). Finally, the 3 MHz treatments proved to be the least efficient at ablating the RBC phantoms, requiring 325 ± 72.7 pulses to remove >75% of the focal volume (table 1). Figure 9(C) shows a magnified view of the RBC ablation efficiency for the first 100 pulses of the respective treatments to better visualize the differences in ablation efficiency during the initial pulses.
Table 1. Ablation efficiency summary. The table shows the mean number of pulses plus or minus the standard deviation required to achieve the specified percent ablation of the respective normalized focal areas for all frequency conditions from histotripsy applied at p− = 38 MPa.
| Percent of measured bubble-cloud area | 25% | 50% | 75% | 100% |
|---|---|---|---|---|
| Frequency | Number of pulses | |||
| 500 kHz | 15 ± 13.9 | 34.3 ± 30.1 | 74.7 ± 61 | 295.3 ± 156.1 |
| 1 MHz | 29 ± 7.2 | 74 ± 26.9 | 200.7 ± 115.9 | 825.3 ± 555.9 |
| 3 MHz | 89.3 ± 12.9 | 174 ± 22.6 | 325 ± 72.7 | 1024.7 ± 353.6 |
Discussion
In this study, the bubble-cloud behavior and ablative efficiency of histotripsy bubble clouds generated using intrinsic threshold pulsing at 500 kHz, 1 MHz, and 3 MHz were evaluated. Results from initial experiments helped to confirm the predictions of previous studies showing that bubble-cloud dimensions predictably increase in size with increasing pressure (Maxwell et al 2013, Roberts et al 2014, Vlaisavljevich et al 2017) and that higher frequency pulsing results in a decrease in the size of the bubble clouds (Vlaisavljevich et al 2015a, 2015c). The results from all frequency conditions showed close correlations between the predicted and measured bubble clouds and matched the region of the focus that exceeded the intrinsic cavitation threshold. The appearance of the bubble clouds was similar between all conditions with sharp boundaries between the densely populated bubble clouds and the surrounding regions with no cavitation. Together, these results provide further support for the high predictability and reproducibility of generating bubble clouds using intrinsic threshold histotripsy, supporting its use as a high-precision method for non-invasive tissue ablation (Maxwell et al 2013, Lin et al 2014b).
In addition to the predictable bubble-cloud size and geometry, results also confirmed the findings of previous studies showing a significant decrease in the size of the individual bubbles within the respective bubble clouds as the frequency was increased (Lin et al 2014a, Vlaisavljevich et al 2015c, Bader and Holland 2016, Mancia et al 2017) due to the shorter duration of the applied p−. It is important to note that the bubble sizes measured in this study represent early time points during bubble growth rather than maximum bubble expansion (Vlaisavljevich et al 2015c, Mancia et al 2017). Although cavitation activity was only imaged at a single time point that occurred shortly after the passage of the pulse while the bubbles were still expanding, the trend showing the decrease in bubble radius with increasing frequency is consistent with similar trends shown in prior experimental and theoretical studies of intrinsic threshold histotripsy (Vlaisavljevich et al 2015c, Bader and Holland 2016, Mancia et al 2017). Although bubble radius measurements at all pressures levels were not measured in this study due to the inability to accurately measure individual bubble radii at the dense center of the clouds, which created a bias in bubble size measurements towards the size of individual bubbles on the cloud periphery, it is worth noting that the size of individual bubbles within the cloud at all pressure levels appeared to be consistent with prior research that showed no significant increase in bubble size with increasing pressure (Vlaisavljevich et al 2015c).
As predicted by prior studies (Lin et al 2014a, Vlaisavljevich et al 2015c, Mancia et al 2017, Bader 2018), larger bubbles generated at lower frequency induce significantly more strain to the tissue surrounding each bubble during histotripsy and expose a larger region of tissue to high strain and strain rates, resulting in more tissue being ablated around each bubble at lower frequency. Together, these findings supported our hypothesis that lower frequency will result in more efficient ablation of a focal volume in comparison to higher frequency pulsing. In addition, these findings suggest that lower frequency will be more effective at ablating stronger tissue types, due to the higher strain applied to the tissue and the larger region of tissue surrounding each bubble that is deformed beyond the ultimate strain of the specific tissue type (Bader 2018, Mancia et al 2019).
Based on prior studies investigating intrinsic threshold histotripsy, our working hypothesis is that histotripsy tissue ablation is dependent upon the dimensions of the bubble cloud, which determine what region of the tissue is ablated, as well as the density of the bubbles within the cloud and the size of the individual bubbles, both of which contribute to whether the tissue is ablated and how many pulses it takes to ablate the tissue (i.e. the ablation efficiency). The effects of pulsing frequency on the bubble density in intrinsic threshold histotripsy bubble clouds have not previously been compared. The need for this type of comparison was highlighted in a prior study that investigated the effects of transducer f-number on intrinsic threshold histotripsy, with results showing a decrease in ablation efficiency for higher f-number transducers due to a decreased bubble density (Vlaisavljevich et al 2017). The results of this study build upon this prior work by demonstrating the effects of frequency on bubble density, independent of other transducer parameters. Results showed that a similar number of bubbles were generated in bubble clouds formed at each frequency (at a given pressure level), resulting in a significant increase in the bubble density at higher frequencies. These results show that a greater number of cavitation nucleation events are initiated within a specified volume at the focus of the transducer for higher frequency histotripsy pulses.
Although the results of this study cannot conclusively elucidate the mechanism underlying the differences in bubble density at different frequencies, this effect may relate to the pressure gradient across the focal region (in the region that is above the intrinsic threshold), which is dependent upon both the acoustic wavelength and focusing of the transducer (Arora et al 2007, Vlaisavljevich et al 2017). This proposed effect is supported by the results of this study and prior research (Arora et al 2007, Vlaisavljevich et al 2017). First, although the number of possible cavitation nuclei present within the focal zone is an intrinsic property of the medium itself, cavitation bubbles only appear to be generated from a subset of these nuclei when the pressure at the focus exceeds the intrinsic threshold. As each bubble is formed, results suggest a subsequent reduction in the local pressure in the area surrounding the newly formed bubble. The pressure wave must then continue to propagate a short distance before the intrinsic threshold is once again exceeded and another bubble can be nucleated (Arora et al 2007, Vlaisavljevich et al 2017). We hypothesize that this process occurs throughout the focal zone of the transducer and results in a bubble cloud that has a specific density of bubbles dependent upon the pressure gradient across the focus, which is proportional to the distance the wave must travel before the intrinsic threshold is once again exceeded after each subsequent bubble is nucleated. Due to this process, we hypothesize that the higher bubble density at higher frequencies is due to the shorter wavelength as well as the potential for less energy loss during the formation of each bubble (due to smaller bubbles being generated), which results in a shorter distance being required before the pressure once again exceeds the intrinsic threshold and nucleates a new cavitation bubble.
The finding that higher frequency pulsing results in a denser bubble cloud indicates that the decrease in ablation efficiency expected at higher frequency (due to reduced bubble expansion) might be partially or completely offset by the increase in cloud density. This possibility was investigated in the final part of this study that compared histotripsy ablation in RBC tissue phantoms. Results from these experiments showed that lower frequencies were in fact more efficient at ablating the focal volume in comparison with the higher frequencies. However, it is important to note that although there was a decrease in ablation efficiency at higher frequency, complete ablation of the entire focal volume was observed following the 2000 pulse treatments for all testing conditions. This result demonstrates that intrinsic threshold histotripsy can generate precise, complete, and predictable ablations for the entire frequency range tested in this study if a sufficient number of pulses are applied. This finding is promising for future clinical applications of histotripsy that may require the use of different frequency transducers for various applications, such as using lower frequencies to target larger and deeper structures that are unreachable with higher frequencies (due to attenuation) or using higher frequencies to treat small and shallow targets that require high-precision ablation. It is worth noting that the differences in bubble size appeared to play a more significant role than the differences in bubble density in determining ablation efficiency in this study, as shown by the decreased efficiency at higher frequency. However, it remains possible that different trends could be observed in other situations, such as when using higher f-number transducers, where increasing bubble density may have a larger effect. In either case, the results of this study suggest that the histotripsy treatment dose should be characterized for specific clinical applications based on the bubble-cloud characteristics of each device and highlight the need for further studies developing more comprehensive models of histotripsy bubble-cloud nucleation and dynamics. For instance, results from this study showed higher bubble density within the center of the clouds compared to the peripheral regions, particularly at higher pressures. This finding, which requires further investigation, may help explain prior observations that the center region of focus is ablated faster than the peripheral regions (Lin et al 2014b, Vlaisavljevich et al 2017), which was again observed in this study at all frequencies.
Conclusions
This work investigated the effects of frequency on the bubble-cloud behavior and ablation efficiency in intrinsic threshold histotripsy. The results demonstrated the potential to control lesion size and ablation efficiency by modulating the frequency due to changes in the bubble-cloud dimensions, individual bubble size, and cloud density. Results confirmed the dimensions of the cloud and the individual bubble size scaled inversely to frequency while cloud density was shown to scale directly with frequency. RBC ablation testing showed all frequency conditions were capable of creating complete lesions that matched the area of the beam profile above the intrinsic threshold. However, results showed the ablation efficiency increased at lower frequency, likely due to enhanced bubble expansion exerting larger strain over a larger region surrounding each bubble. Overall, this study demonstrates the role of frequency in determining bubble-cloud characteristics and ablation efficiency for intrinsic threshold histotripsy pulsing methods.
Acknowledgments
The authors would like to thank the Virginia Tech Institute for Critical Technology and Applied Science (ICTAS) and the Department of Biomedical Engineering and Mechanics for their support of this work. Thanks to Kenneth Aycock of the Virginia Tech Department of Biomedical Engineering and Mechanics for assistance on the statistical analysis of bubble-cloud density. Drs. Tim Hall and Eli Vlaisavljevich have research and financial relationships with HistoSonics Inc.
All of the authors contributed significantly to the development and execution of this study. EV conceived the initial ideas for this work. TH, EH, CE, and HH contributed to the design and construction of the focused ultrasound transducers and other experimental set-ups developed for this study. CE and EH developed and performed the methodology for analyzing data from bubble-cloud dynamics and RBC phantom ablation experiments. CE, EH, HH, TH, and EV analyzed the data from bubble-cloud dynamics and RBC phantom ablation experiments. CE led the writing of the manuscript. All authors contributed critically to the drafts and gave final approval for this submission.