

Abstract
This paper presents a prospective study evaluating the impact on image quality and quantitative dynamic contrast-enhanced (DCE)-MRI perfusion parameters when varying the number of respiratory motion states when using an eXtra-Dimensional Golden-Angle Radial Sparse Parallel (XD-GRASP) MRI sequence. DCE acquisition was performed using a 3D stack-of-stars gradient-echo golden-angle radial acquisition in free-breathing with 100 spokes per motion state and temporal resolution of 6 s/volume, and using a non-rigid motion compensation to align different motion states. Parametric analysis was conducted using a dual-input single-compartment model. Nonparametric analysis was performed on the time-intensity curves. A total of 22 hepatocellular carcinomas (size: 11–52 mm) were evaluated. XD-GRASP reconstructed with increasing number of spokes for each motion state increased the signal-to-noise ratio (SNR) (p < 0.05) but decreased temporal resolution (0.04 volume/s vs 0.17 volume/s for one motion state) (p < 0.05). A visual scoring by an experienced radiologist show no change between increasing number of motion states with same number of spokes using the Likert score. The normalized maximum intensity time ratio, peak enhancement ratio and tumor arterial fraction increased with decreasing number of motion states (p < 0.05) while the transfer constant from the portal venous plasma to the surrounding tissue significantly decreased (p < 0.05). These same perfusion parameters show a significant difference in case of tumor displacement more than 1 cm (p < 0.05) whereas in the opposite case there was no significant variation. While a higher number of motion states and higher number of spokes improves SNR, the resulting lower temporal resolution can influence quantitative parameters that capture rapid signal changes. Finally, fewer displacement compensation is advantageous with lower number of motion state due to the higher temporal resolution. XD-GRASP can be used to perform quantitative perfusion measures in the liver, but the number of motion states may significantly alter some quantitative parameters.
Export citation and abstract BibTeX RIS
1. Introduction
Hepatocellular carcinoma (HCC) is the most common type of primary liver cancer, typically occurring in people affected with chronic liver disease. It is the sixth most frequent cancer and the second leading cause of cancer-related death in the world, with its incidence continuing to rise in North America (Tang et al 2018).
Due to neoangiogenesis, HCC is a highly vascular tumor with a typical enhancement pattern characterized by arterial phase hyperenhancement followed by washout on subsequent vascular phases on contrast-enhanced dynamic imaging (Jian et al 2018). Several tests and imaging techniques may be used to diagnose this disease, including serum alpha-fetoprotein, liver biopsy and imaging examinations such as computed tomography (CT), magnetic resonance imaging (MRI) and contrast-enhanced ultrasound. Imaging techniques play an important role in the diagnosis, monitoring and treatment planning of HCC (Chen et al 2013). Recent studies have shown the potential for quantifying perfusion of malignant liver lesions using perfusion CT (Sahani et al 2007, Ippolito et al 2010) and dynamic contrast-enhanced (DCE)-MRI (Wang et al 2004, Abdullah et al 2008, Thibodeau-Antonacci et al 2019). Because an early assessment of treatment effectiveness response is necessary for planning additional therapy (Bonekamp et al 2011), DCE-MRI may provide quantitative and objective measures to evaluate treatment response.
The key advantages of MRI reside in the exquisite soft tissue contrast, numerous tissue contrast mechanisms and relatively high resolution without the use of any ionizing radiation. However, MRI provides a lower temporal resolution than other contrast-enhanced modalities, such as fluoroscopy, contrast-enhanced ultrasound, CT or cone beam computed tomography (CBCT). DCE-MRI is an advanced imaging technique based on measuring the signal intensity changes due to local perfusion after gadolinium-based contrast agent injection. In comparison to traditional clinical imaging sequences, DCE-MRI generally provides higher temporal resolution with spatial resolution trade-off arising from the need to compensate for breathing motion (Materne et al 2002, Pahwa et al 2018).
One approach to address breathing-related artefacts is by using radial sampling of k-space (Chandarana et al 2013). Recently, the combination of parallel imaging with compressed sensing and a golden-angle radial sampling scheme has been presented as a new free-breathing imaging technique for dynamic imaging (Golden-angle RAdial Sparse Parallel imaging or GRASP) (Chandarana et al 2013, Feng et al 2014).
GRASP has been applied for dynamic image reconstruction of various organs including the liver, heart, prostate and breast. The foundation of this method lies in applying a regularization on the temporal dimension along with a golden angle radial sampling to achieve motion robustness even during free-breathing. This method shows a reduction of streaking artifacts. However, it does not account for motion directly, which can therefore result in motion-related blurring (Le 2017).
Previous studies have shown that compared to the conventional breath-held Cartesian acquisition, GRASP can produce images with improved spatial resolution which can be used for diagnostic purposes (Chandarana et al 2013). However, since GRASP still suffers from residual respiratory blurring, it may lead to reduced vessel-tissue and lesion-tissue contrast thus limiting the interpretation of the images clinically and impacting the quantification process in the case of a quantitative assessment of perfusion as provided by DCE-MRI. To address these limitations, a variant known as eXtra-Dimensional Golden-Angle RAdial Sparse Parallel (XD-GRASP) reconstruction technique was recently proposed (Feng et al 2016). It is based on reconstructing the extra respiratory motion dimension from the k-space data, by ordering each contrast-enhanced phase from end-inspiration to end-expiration into multiple respiratory motion states, where the grouped number of spokes in each motion state remains the same (Grimm 2015). However, to our knowledge there is limited previous work on XD-GRASP in abdominal imaging (Feng et al 2016, Chitiboi et al 2019) and no previous work evaluating the impact of XD-GRASP acquisition parameters on image quality and DCE-MRI parameters. The purpose of this study was therefore to evaluate the impact of the number of respiratory motion states using XD-GRASP reconstruction on image quality and quantitative DCE-MRI perfusion parameters.
2. Methods and materials
2.1. Imaging protocol
This study was based on free-breathing acquisitions from 11 patients which were reconstructed using the XD-GRASP technique with different number of motion states followed by several analyses (figure 1). This prospective study was approved by our institutional review board and consent was obtained from all patients. Eleven patients, 6 men and 5 women (70 years ±11 [standard deviation]) diagnosed with HCC, with tumors exceeding 10 mm, underwent DCE-MRI examinations between September 2018 and December 2018.
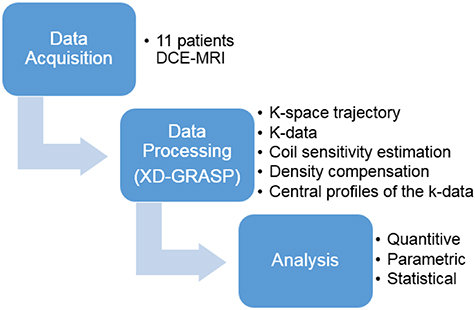
Figure 1. Overview of the study plan.
Download figure:
Standard image High-resolution imagePatients were scanned on a 3.0T clinical MRI system (Ingenia, Philips Healthcare, Best, The Netherlands) using the combination of a 16-channel anterior array and a 12-channel posterior array for signal reception.
To limit peristalsis, patients were asked to fast for four hours before the examination. T1 mapping was performed prior to contrast injection using the variable flip-angle method with fat-saturated Cartesian 3D gradient-echo acquisitions with flip angles of 4°, 8° and 12°. These acquisitions were performed in breath-hold using the same spatial resolution and field-of-view as the subsequent DCE acquisition.
The DCE acquisition was performed in free-breathing using a 3D stack-of-stars golden-angle gradient-echo radial acquisition with fat-saturation (Pahwa et al 2018). Thirty seconds after the beginning of the DCE acquisition, gadobenate dimeglumine (MultiHance®, Bracco Imaging SpA, Milan, Italy) was injected with an adjusted dose according to patient weight (0.1 mmol kg−1 with a maximum dose of 20 ml) at 1.5 ml s−1 followed by a 15 ml saline flush at 1.5 ml s−1. Data was acquired continuously for 6 min. In total 50 slices were acquired with 5 mm spacing and then the acquired data was reconstructed to obtain 100 slices with 2.5 mm. The FOV was 250 mm. Imaging parameters for the DCE sequence are listed in table 1.
Table 1. DCE-MRI sequence parameters used for XD-GRASP reconstruction and computation of perfusion parameters from HCC lesions.
| Sequence Parameter | |
|---|---|
| Sequence type | 3D stack-of-stars gradient-echo radial acquisition with fat saturation |
| Repetition time | 3.40 ms |
| Echo time | 1.40 ms |
| Field of view | 450 × 450 × 250 |
| Flip angle | 12° |
| Number of slices acquired | 50 |
| Slice thickness | 5.0 mm |
| Number of slices reconstructed | 100 |
| Slice thickness | 2.5 mm |
| Spatial resolution | 1.5 × 1.5 mm |
2.2. XD-GRASP reconstruction
XD-GRASP is a novel method for dynamic image reconstruction based on a continuous scan during free breathing developed by Feng et al (2016). It is based on reconstructing the extra respiratory motion dimension from the acquired k-space data (figure 2). In the context of 3D liver imaging, this reconstruction is performed by solving the following optimization equation using compressed sensing:

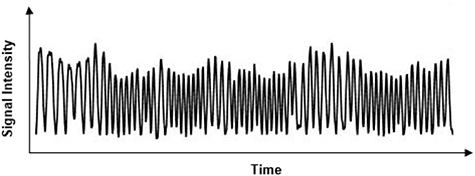
Figure 2. Respiratory signal extracted from k-space data center.
Download figure:
Standard image High-resolution imageF is the Non-Uniform Fast Fourier Transform (NUFFT) operator defined on the radial sampling pattern of each frame of x, where x is the 3D dynamic image-series and y is the corresponding multicoil radial k-space data sorted into several contrast phases. Furthermore, S represents the coil sensitivity maps estimated using Walsh method (Grimm 2015) from the multicoil reference image given by the coil-by-coil NUFFT (Fessler 2019) reconstruction of k-space data by averaging all the acquired spokes. Here, C1 and C2 are the sparsifying transforms with weighting parameters  and
and applied in the contrast-enhancement dimension and along the extra respiratory state dimension, respectively. The same sparsifying transform 'Total Variation' constraint was used for both the respiratory dimension and the contrast enhanced phase but with different weighting parameters. The sparsifying transform is based on removing unwanted details while preserving important details such as edges, while the duration of each contrast-enhancement phase was 6 s. This transform plays an important role in removing streaking artifacts or the interspokes k-space information in frequency domain (Block et al 2007). The total number of spokes acquired was 691.
The coil elements used for signal reception may have different noise levels. Therefore the k-space data is obtained after a noise whitening step which decorrelates and normalizes the channel and thus suppresses the influence of the defective coil elements.
The MR pulse sequence used in this work represents Cartesian encoding over kz and a stack of stars trajectory with radial sampling over kx–ky (Usman et al 2013) (figure 3). The radial sampling angle is the golden angle ∼111.25°. The sampling motion artifacts are averaged out by oversampling the center of k-space in the radial sampling. This oversampling may lead to an overweighting of low frequencies so a density compensation is applied where it serves the same aim as a ramp filter (Fessler 2019):

where r is the k-space data and Na the number of radial samplings.
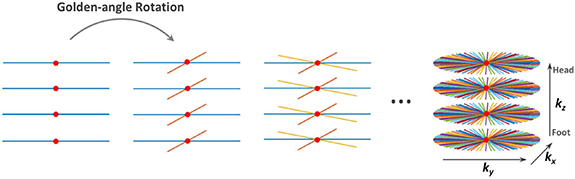
Figure 3. Continuous acquisition of spokes with 3D stack-of-stars. Radial encoding in the kx–ky planes and fully-sampled Cartesian on the kz dimension. Red dots represent the k-space center from which the respiratory motion signal was extracted (Feng et al 2014).
Download figure:
Standard image High-resolution imageFinally, the coil sensitivity is an important parameter to be estimated in the pre-processing steps. The Walsh approach (Lustig et al 2007), using an adaptive matched filter for the multi-coil data to reduce the noise in the background and dark areas of the images, was adapted for these purposes. It is based on calculating the covariance matrices of the noise and signal at each image pixel where the eigenvector of these matrices provides an almost optimal coil sensitivity estimation. The individual coil images used for the sensitivity estimation are extracted from the radial data itself using a NUFFT.
The XD-GRASP reconstructions for each contrast enhancement phase was performed by sorting the acquired data into 4, 3, 2 and 1 motion states. A total 100 consecutive spokes with footprint of 25 spokes were used for each motion state and for 1 motion state (GRASP) where, single dynamic dimension represents the contrast enhancement disrupted by motion. For comparison purposes, reconstructions using 100, 75, 50 and 25 spokes for 4, 3, 2 and 1 motion states, respectively, were also generated. An effective temporal resolution of 6 s/volume, 12 s/volume, 18 s/volume and 24 s/volume, was associated to 1, 2, 3 and 4 motion states, respectively while the nominal temporal resolution was 6 s/volume. These reconstruction were compared to a baseline which is based on an approach without applying the compressed sensing constraint using Non-Uniform Fast Fourrier transform (NUFFT) reconstructions. It was implemented by means of convolutions with a Kaiser Bessel kernel. All images were reconstructed in MATLAB R2018a (The MathWorks, Inc. Natick, MA, USA) using the framework implementation by Feng et al.1
2.3. Nonrigid motion compensation
For quantitative analysis, the contrast-enhanced liver MR perfusion image series was registered with MoCo (Corstem, Montreal, QC, Canada), a non-rigid motion compensation software using subpixel deformation maps. This software used non-rigid estimation of displacement based on an optical flow formulation adapted to dynamics of perfusion series (Brox and Malik 2011). This implementation allows to register MRI perfusion image series with varying breathing patterns (Jacobs et al 2016, Benovoy et al 2017). All the images were then registered to the first image used as the initial target.
In the T1 mapping, to handle the varying breath-hold, the same non rigid registration using the MoCO technique was performed between images with different flip angles.
The reconstructed 5D images obtained using XD-GRASP are composed of several respiratory motion states for each phase of contrast enhancement phase. To completely suppress these movements and their effect, even after their reconstruction, the motion compensation software was used to register all the motion states to an intermediate one for each phase of contrast enhancement. And finally, these motion states were averaged to obtain 4D (x-y-z-t) images.
The reference frame was chosen as one of the intermediate motion state to avoid registration to an extreme phase (end inhale or end exhale). In the case of four motion states, we chose the third one as reference and in case of three motions states, we chose the second one as the reference.
The optimal solution for registration is obtained by minimizing the following cost function:

where Eint indicates the pixel intensity energy term, Egrad is the gradient constraint, Esmooth is the regularization term, Ematch is histogram oriented gradient (HOG) based landmark correspondence energy term and Edesc is a continuous formulation for discrete descriptor matching.
This equation is controlled with three parameters: β the weight of the HOG descriptor matching term, α flow fields smoothness and γ the gradient consistency term weight.
We did not perform any registration over time so the contrast enhancement was not affected. The registration was just applied between motion states.
2.4. MR image quantitative DCE analysis
For each set of images, a manual selection of four regions of interest (ROI) was performed during the vascular phases providing the best visualization of the portal vein, the abdominal aorta, the liver tumors and the normal-appearing liver. The abdominal aorta was identified after contrast arrival when it had the highest signal intensity whereas the portal vein was most clearly visible during the portal venous phase.
For the aorta, portal vein and liver, only one slice was selected. For the liver, the slice including the complete liver was chosen and for the aorta and the vein, the slice which best showed these structures according to a fellowship-trained abdominal radiologist was selected.
There was at least one tumor (HCC) in each patient confirmed by an experienced abdominal radiologist (AT) using previous diagnostic imaging. If a patient had multiple tumors, the segmentation was performed for each one. Each tumor was segmented on multiples slices which includes all slices where the tumor appears, to minimize sampling errors. Segmentations were performed by a third-year radiology resident (LB, with two years of experience), using MATLAB R2018a (The MathWorks, Inc. Natick, MA, USA).
To measure the average signal intensity versus time curves, each selected ROI was then extended to all motion compensated DCE-MRI time points.
In order to assess the image quality, we first calculated the signal-to-noise ratio (SNR) as a measure of image quality (Welvaert and Rosseel 2013). It is defined as the ratio of the average normal liver signal and the background standard deviation:

Then, the contrast-to-noise ratio (CNR) was calculated. It is defined as the ratio of the absolute difference between average normal liver signal and average tumor signal to the background standard deviation:

The background region was selected just outside the subject at the closet position to the liver. This region was selected in same position for all reconstructions of each patient. From patient to another, slight differences depending on the liver position may have occurred.
A visual scoring of image quality based on five point Likert scoring (used as standard in the hepatic imaging field) which was performed by an abdominal fellowship radiologist with five years of experience. The scoring scale use quality index: 1 (Extremely poor), 2 (Poor), 3 (Fair), 4 (Good) and 5 (Excellent), where index 1 and 2 are considered clinically unacceptable and 3 to 5 clinically acceptable (Martinez et al 2020).
2.5. Tumor tracking
We quantified the motion of the tumors between extreme phases (full inspiration and full expiration) of the XD-GRASP reconstruction with four respiratory motion states, before the motion compensation, through deformable registration using NiftyReg software (Modat et al 2010). A cubic B-splines-based transformation model with a pyramidal multi-resolution strategy at three different levels was adopted. The level of alignment between source and target volumes was quantified by Normalized Mutual Information. A regularizer term based on the bending-energy as proposed in (Rueckert et al 1999) was used.
In addition, we applied the same deformable registration after the motion compensation step using the third phase as the reference to estimate residual tumor displacement.
To measure the lesion motion range we look only at the tumor motion where dense deformation vectors were multiplied by a segmentation mask in order to consider only voxels belonging to the tumor. Then we calculated the three-dimensional Euclidean distance as follows:

Finally, we reported the lesion mean motion value over all temporal points. For visualisation purposes, the resulted images of this registration were computed with an open-source ITK module.
2.6. Perfusion parameters
A linear interpolation to a 1 s time stamp was performed on the signal-time curves followed by a non-parametric analysis that directly calculated simple perfusion parameters correlating with the physiology of tissue. The parameters defined in table 2 were subsequently used to perform a direct comparison between reconstructed images with increasing number of motion states. These parameters are illustrated in figure 4 where TTP is the time that contrast agent need to reach its maximum value (TTP = TmaxC–T0) and T0 is the onset time representing the contrast agent arrival in tissue.
Table 2. Definition of perfusion measurements.
| Measurement | Definition |
|---|---|
| TTP | Time that contrast agent needs to reach its maximum value |
| T0 | Contrast agent arrival time in tissue |
| ΔS | Smax−S0, difference between maximum and baseline intensities |
| nMITR |  , normalized maximum intensity time ratio between TTP and peak enhancement , normalized maximum intensity time ratio between TTP and peak enhancement |
| PER |  , peak enhancement ratio , peak enhancement ratio |
| Wash-out slope |  , slope between , slope between  and and  points (final signal intensity) points (final signal intensity) |
| Wash-in slope |  , slope between , slope between  and and  points points |
TTP = time to peak, T0 = onset time
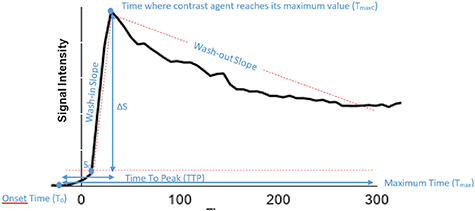
Figure 4. Example of signal intensity vs. time curve.
Download figure:
Standard image High-resolution imageT1 mapping linear conversion was used to convert the signal intensity for each previously selected ROI at different times into a contrast agent concentration. The linear relation between 1/T1 and the contrast agent concentration is considered in tissue and blood using the following equation:

where r1 is the relaxation of T1.
Patient-specific B1 shimming (two transmit channels, phase and amplitude) was performed, but no additional correction based on the acquisition of a B1 map was performed, primarily for acquisition time constraints. B1 inhomogeneities could add to inter-lesion variability in the DCE parameters, but would most likely not affect the direct comparison between the different reconstructions performed from the same raw data and thus under the same B1 conditions.
The dual-input single-compartment model, a direct approach normally used for parametric analysis, was adjusted to experimental tumor data and the liver tissue surrounding it. It needs an accurate assessment of the arterial input function (AIF) and the portal venous input function (PIF).
After linear interpolation, the ROI contrast agent concentration in the portal vein was used to estimate the portal venous input function (PIF). And the arterial supply extracted from the drawn ROI on the abdominal aorta (celiac trunk) and its contrast agent concentration were used for the estimation of the arterial input function (AIF) (Hormuth et al 2014).
From this model, we had the ability to extract the transfer constant from the liver tissue to the central vein K2 and the transfer constants from the arterial plasma to the surrounding extravascular space ka and the transfer constants from the portal venous plasma to the surrounding tissue kp (Breuer et al 2005). Using the relations developed by Materne et al (2002), we estimated the tumor arterial fraction (ART), where the arterial blood flow was calculated and expressed in ml · min−1 · 100 ml−1 and then as a fraction (%):

and the distribution volume (DV) (Materne et al 2002), using:

which estimates the ratio of arterial and portal plasma over the central vein blood flow.
2.7. Statistical analysis
For this study, statistical analysis were performed in Excel, using ANOVA test between XD-GRASP with different number of motion states (1, 2, 3 and 4), and using paired t-test between XD-GRASP with 1 and 4 motion states. In both tests, p < 0.05 was considered as statistically significant.
Patients and Tumors Characteristics: table 3 summarized demographic descriptive statistics (sex and age) and clinical data, including the tumor characteristics and the etiology of liver disease. Variables of categories were represented as percentages and numbers and the rest as minimum, maximum and mean ±standard deviation (SD).
Table 3. Patients and tumors characteristics.
| Characteristics | Data |
|---|---|
| Age | |
| Median (min–max)* | 70 (48–86) |
| Sex | |
| Male | 6/11 (54.5) |
| Female | 5/11 (45.5) |
| Known cirrhosis | 8/11 (72.70) |
| Etiology of liver disease | |
| Hepatitis A infection | 1/11 (9.10) |
| Hepatitis C infection | 3/11 (27.3) |
| Alcoholic liver disease | 5/11 (45.5) |
| Non-alcoholic steatohepatitis | 5/11 (45.5) |
| HCCs number per patient | |
| Mean (min–max)* | 2 (0–4) |
| Size of HCC (mm) | |
| Mean ± SD (min–max)* | 25.8 ± 13.2 (11–52) |
Note. —Unless stated otherwise*, data in parentheses are percentages.
Parametric and Nonparametric Analyses: comparisons of mean values for perfusion parameters states as well as the comparison of the p-value of contrast-to-noise ratio (CNR) and signal-to-noise ratio (SNR) was made for XD-GRASP with different numbers of respiratory motion. The tumors were then divided into two categories, the first representing the tumor displacement greater than 1 cm while the second representing a displacement less than 1 cm. Then, the mean values of perfusion data parameters for each category were calculated and a comparison was made between 1 motion state and 4 motion states.
3. Results
3.1. Patients and tumors characteristics
In this pilot study, eleven patients totaling 22 HCCs with tumor diameters between 11 and 52 mm were included. Figure 5 shows the patient selection flowchart and table 3 represents the patients and tumors characteristics. 169 patients diagnosed with HCC and awaiting their clinical MRI between September 2018 and December 2018 were eligible. 11 patients were selected for additional MRI acquisition using the proposed protocol. The most common reasons for excluding patients were related to MRI scheduling (timeline too short to schedule MRI, MRI already done, postponed MRI or impossible to book MRI), distance from the hospital and fasting too long. Thus, a total of 11 patients were included.
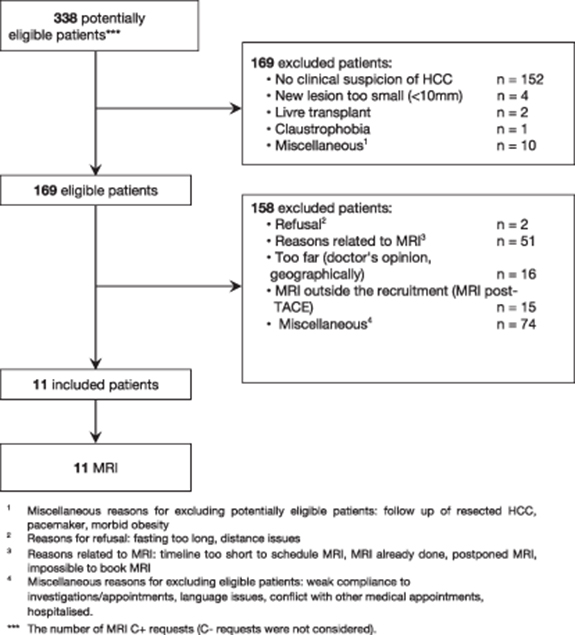
Figure 5. Patient selection flowchart.
Download figure:
Standard image High-resolution image3.2. Image quality
In order to analyse the performance of the technique and to assess the image quality from the reconstructed images, we calculated SNR and CNR.
XD-GRASP reconstructed with increased motion states with different number of spokes improves the contrast-to-noise ratio and the signal-to-noise ratio (p < 0.05) but reduces temporal resolution (0.04 volume/s vs 0.17 volume/s for one motion state) (p < 0.05) (figure 6). XD-GRASP with 3 and 4 motion states had higher overall image quality scores compared to XD-GRASP with 1 and 2 motion states as it showed reduced streak artefact (figure 8). Results for image reconstructed with different number of spokes show that on average, the reconstruction with 4 phases received the higher scores (4.6) while the reconstruction with one phase received the lower one (1).
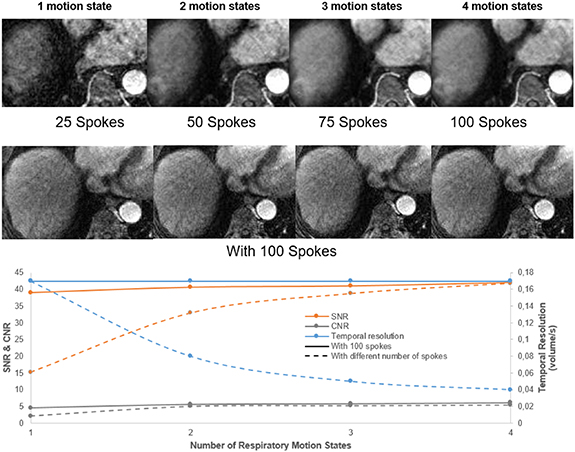
Figure 6. Example of XD-GRASP images with different number of spokes from a 70-year-old woman with HCC at 3.4 cm liver mass in segment VIII (white arrow). Its representative temporal resolution, contrast-to-noise ratio (CNR) and signal-to-noise ratio (SNR), are shown for increasing number of respiratory motion states.
Download figure:
Standard image High-resolution image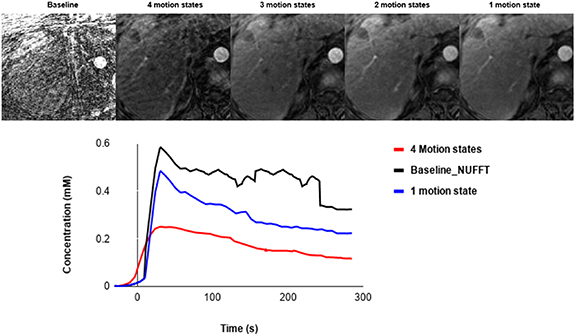
Figure 7. Example of XD-GRASP with different number of motion states and a baseline approach and the corresponding aorta concentration.
Download figure:
Standard image High-resolution imageIn the case of XD-GRASP reconstructed with 100 spokes, there was no significant difference in SNR and CNR and the visual scoring show an average score of 4 for all cases (4, 3, 2 and 1 motion state). Since the reconstruction had a footprint of 25 spokes, the nominal temporal resolution was the same 6 s/volume while the effective one was as discussed previously.
Compared to the baseline reconstruction, we can clearly see the importance of XD-GRASP with regards to quality image as shown in figure 7. This reference reconstruction was evaluated using the same ROI and same length of time points to generate the corresponding perfusion curves and compared it to GRASP and XD-GRASP. There is a significant difference between the baseline and the images reconstructed with XD-GRASP, particularly concerning image quality, and shows higher peak of aorta concentration, but is more noisy and unstable.
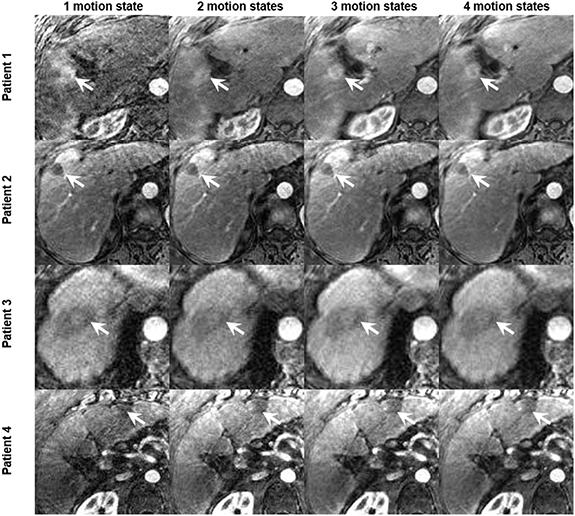
Figure 8. Example of reconstructed XD-GRASP images for four patients with increasing number of motion states with multiple number of spokes (tumors identified by white arrow).
Download figure:
Standard image High-resolution imageFigure 6 shows that increasing the number of respiratory motion states improves the SNR and CNR but reduce the temporal resolution thus influencing quantitative parameters that capture rapid signal changes. This is confirmed with figure 8, which clearly shows the improvements of the image quality by increasing the number of motion states for several patients.
3.3. Tumor tracking
Figure 9(a) compares the diaphragm boundary deformation between the 4 motion states of the XD-GRASP reconstructed image. The diaphragm boundaries are marked by the white line. The results show that there is a clear motion between different phases which was confirmed by the deformation vector field between the first and last motion state represented in figure 9(b).
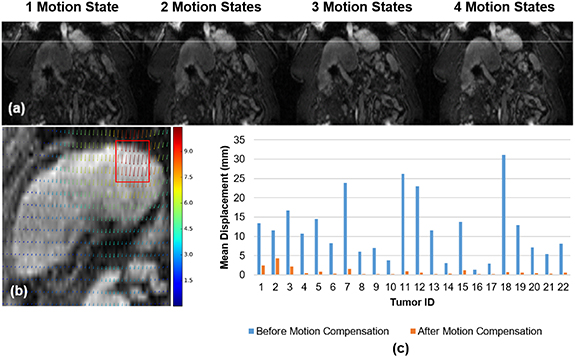
Figure 9. (a) Comparison of diaphragm position between motion states. (b) Deformation vector field (in pixel) for a sample case between the first and last phases (tumor identified by red box). (c) Tumors displacement (mm) before and after motion compensation.
Download figure:
Standard image High-resolution imageThe mean Euclidean distance calculated before registration for each tumor varies between 1.3 mm to 31 mm (mean 11.9 ± 8 mm) depending on the respiration of each patient as shown by the blue bars in figure 9(c). Following motion compensation, tumor target displacements varied between 0.2 and 4 mm (mean 0.9 ± 1 mm), as shown by the orange bars in figure 9(c).
3.4. Perfusion analysis
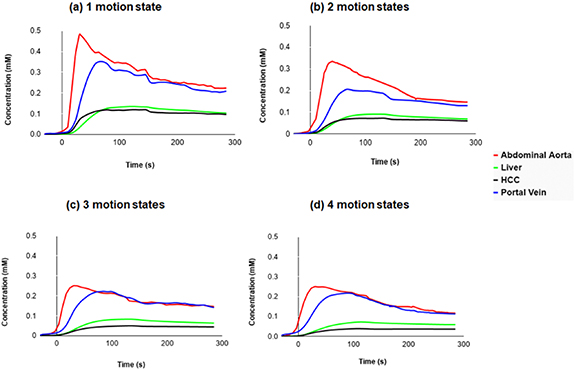
Figure 10 represents global enhancement curves for the portal vein, the liver, the abdominal aorta and the tumor from data reconstructed with increasing number of motion states (1–4) and same number of spokes. The HCC enhancement clearly occurs before the liver's one in the case of 1 and 2 motion states.
Figure 10. Global perfusion curves for the 22 tumors, demonstrating the increased difference between liver and HCC.
Download figure:
Standard image High-resolution image
Comparison of all perfusion parameters between different numbers of phases is summarized in table 4 as mean ± SD. Time to peak (TTP) did not significantly change with decreasing number of motion states. The normalized maximum intensity time ratio (nMITR), the peak enhancement ratio (PER) (p < 0.05), and the tumor arterial fraction increased with decreasing number of motion states (p < 0.05) while the transfer constant from the portal venous plasma to the surrounding tissue (Kp) significantly decreased (p < 0.05).
Table 4. Perfusion parameters changes between different XD-GRASP reconstructions.
| Parameters | 4 motion states | 3 motion states | 2 motion states | 1 motion state | p value |
|---|---|---|---|---|---|
| Parametric Analysis | |||||
| Kp (10–3) (s−1) | 2.1 ± 2.5 | 1.8 ± 2.1 | 1.1 ± 0.8 | 0.8 ± 1.1 | <0.05 |
| Ka (10–3) (s−1) | 0.9 ± 1.0 | 1.2 ± 1.3 | 1.3 ± 1.5 | 1.8 ± 2.8 | 0.27 |
| K2 (10–2) (s−1) | 5.4 ± 10.2 | 4.8 ± 4.0 | 4.9 ± 5.5 | 6.2 ± 10.2 | 0.78 |
| DV (%) | 25.3 ± 43.9 | 20.4 ± 23.2 | 17.1 ± 17.3 | 19.1 ± 20.1 | 0.31 |
| ART | 0.3 ± 0.2 | 0.5 ± 0.2 | 0.5 ± 0.2 | 0.6 ± 0.3 | <0.05 |
| Non Parametric Analysis | |||||
| PER | 0.25 ± 0.20 | 0.3 ± 0.3 | 0.4 ± 0.5 | 0.8 ± 1.5 | <0.05 |
| TTP (s) | 60.3 ± 37.5 | 67.9 ± 42.7 | 65.1 ± 37.4 | 67.6 ± 37.2 | 0.90 |
| nMITR (10–2) (s−1) | 0.2 ± 0.2 | 0.3 ± 0.6 | 0.8 ± 1.4 | 1.4 ± 1.9 | <0.05 |
| Wash-in slope (10–3) (s−1) | 6.1 ± 7.8 | 7.5 ± 10.6 | 8.3 ± 14.9 | 5.4 ± 10.4 | 0.80 |
| Wash-out slope (10–3) (s−1) | 0.9 ± 4.2 | 1.05 ± 4.02 | 1.07 ± 4.40 | 0.8 ± 2.1 | 0.90 |
Note—All values are expressed as mean ± SD except p values. ka: transfer constant from the arterial plasma to the surrounding tissue, TTP: time to peak, PER: peak enhancement ratio, ART: arterial fraction, nMITR: normalized maximum intensity time ratio, kp: transfer constant from the portal venous plasma to the surrounding tissue, DV: distribution volume and k2: transfer constant from the tissue to the central vein.
Table 5 as well summarized the perfusion parameters between 4 motion states and 1 motion state depending on the tumor displacement. For displacement greater than 1 cm, the normalized maximum intensity time ratio (nMITR), the peak enhancement ratio (PER), the tumor arterial fraction (ART) and the transfer constant from the portal venous plasma to the surrounding tissue (Kp) significantly change (p < 0.05). On the other hand, in case of tumors displacement less than 1 cm, it was clear that there was no significant changes in all parameters except for the tumor arterial fraction.
Table 5. Perfusion parameters changes between GRASP and XD-GRASP with four motion states depending on the tumor displacement (greater or lower than 1 cm).
| Tumor displacement > 1 cm (n = 12) | Tumor displacement < 1 cm (n = 10) | |||||
|---|---|---|---|---|---|---|
| Parameters | 4 motion states | 1 motion state | p value | 4 motion states | 1 motion state | p value |
| Parametric Analysis | ||||||
| Kp (10–3) (s−1) | 2.8 ± 3.5 | 0.9 ± 1.5 | <0.05 | 0.9 ± 1.2 | 0.4 ± 0.5 | 0.2 |
| Ka (10–3) (s−1) | 1.3 ± 1.4 | 2.8 ± 3.5 | 0.06 | 0.3 ± 0.5 | 0.9 ± 1.9 | 0.25 |
| K2 (10–2) (s−1) | 7.1 ± 14.2 | 7.2 ± 13.6 | 0.92 | 3.5 ± 4.5 | 4.4 ± 7.8 | 0.72 |
| DV (%) | 16.8 ± 22.7 | 10.9 ± 22.9 | 0.63 | 11.7 ± 15.9 | 14.4 ± 19.4 | 0.98 |
| ART | 0.35 ± 0.17 | 0.6 ± 0.4 | <0.05 | 0.3 ± 0.13 | 0.5 ± 0.3 | <0.05 |
| Non Parametric Analysis | ||||||
| PER | 0.3 ± 0.2 | 1.3 ± 1.9 | <0.05 | 0.09 ± 0.11 | 0.5 ± 0.9 | 0.15 |
| TTP (s) | 57.2 ± 41.5 | 73.4 ± 27.9 | 0.1 | 63.9 ± 34.0 | 60.5 ± 46.7 | 0.84 |
| nMITR (10–2) (s−1) | 0.3 ± 0.3 | 1.9 ± 3.0 | <0.05 | 0.1 ± 0.2 | 0.6 ± 1.0 | 0.13 |
| Wash-in slope (10–3) (s−1) | 7.4 ± 10.1 | 7.4 ± 14.9 | 0.99 | 2.08 ± 2.90 | 1.9 ± 2.3 | 0.67 |
| Wash-out slope (10–3) (s−1) | 1.5 ± 5.7 | 1.08 ± 3.40 | 0.51 | 0.2 ± 2.0 | 0.4 ± 1.1 | 0.39 |
Note—All values are expressed as mean ± SD except p values.
4. Discussion
This prospective study evaluated the impact on image quality and quantitative DCE-MRI perfusion parameters using an XD-GRASP sequence in patients with HCC, by evaluating the effect of the number of respiratory motion states during image reconstruction.
XD-GRASP reconstructed with higher number of motion states and higher number of spokes represents reduced temporal resolution and better image quality due to the regularization over motion states and to the better correspondence between different spokes and this was clear too comparing to the baseline. While XD-GRASP reconstructed with the same number of spokes does not show any significant variation in term of quality and the nominal temporal resolution was constant for 6 s/volume.
In comparison to the GRASP method representing one motion state with higher temporal resolution, liver motion is not as apparent with the XD-GRASP sequence. However, this observation does not necessarily mean that liver motion was removed or compensated for during the acquisition. This was clear with XD-GRASP with several motion states, where figure 9 shows the displacement of the liver and tumors with the representative deformation vector field. This displacement was solved by registering all the states using a non-rigid motion compensation technique. Therefore, the GRASP method suffers from residual respiratory blurring, leading to reduced vessel-tissue and lesion-tissue contrast. It limits the interpretation of the images clinically and impacts the quantitative assessment of perfusion.
As shown in figure 10, we can observe that a free breathing acquisition with radial k-space acquisition provides organ motion robustness and uniformity in temporal resolution, thus allowing time intensity curve continuous assessment including the arterial peak. Before the intersection of the tumor and liver curves, HCC enhancement clearly occurs before the liver enhancement due to high arterialization of the tumor.
For the arterial enhancement, the normalized maximum intensity time ratio and peak enhancement ratio and tumor arterial fraction increased with decreasing number of motion states while the transfer constant from the portal venous plasma to the extravascular space significantly decreased.
The concentration increases by reducing the number of motion states. Therefore, the images reconstructed with 1 and 2 motion states show the highest concentration for the enhancement arterial curve (≈0.5 mm and 0.3 mm respectively) with higher temporal resolution. While those reconstructed with 3 and 4 motion states were almost the same by representing a lower concentration (≈0.25 mm) of the unclear arterial enhancement peak due to the lower temporal resolution.
As shown previously in table 5, the displacement of the tumor clearly affects the perfusion parameters. Therefore, for a displacement of more than 1 cm, the movement compensation for XD-GRASP with 4 states of motion was significant. Otherwise, in the case of fewer displacement, it is preferable to use GRASP because no significant change has been detected in the perfusion parameter and thus the motion compensation was limited because there was a little movement and in addition the temporal resolution is more advantageous with GRASP.
Our study had some limitations. It included a small sample size (11 cases with 22 tumors) which limits the conclusion that could be reached. Another limitation is that we tested one configuration for the number of spokes per motion state and one configuration on the regularization level in XD-GRASP. The used configuration followed standard parameters, but different results could be obtained with other configurations.
Due to the limited sample size of this study, it becomes difficult to provide a clear recommendation of the optimal number of motion states. The recommendation could relate to the lesion displacement. Based on the presented results, we could state that using GRASP for lesions with low displacement is more advantageous, while XD-GRASP for larger displacements is more ideal and allows to generate reliable perfusion parameters. In general, choosing the best number of motion states is more closely related to the temporal resolution and image quality and is a compromise between these two factors. With regards to the peak concentration of the aorta based on a previous study from our group (Thibodeau-Antonacci et al 2019), it was found to be 0.7 at the maximum, where in our cohort, a maximum of 0.5 on average was found for all subjects, but in certain case it may reach a higher value. Compared to the baseline aorta concentration, we can observe that even with GRASP which is one motion state, this peak value may be affected.
These results overcome several limitations associated with contrast-enhanced liver MRI examinations. The XD-GRASP reconstruction technique provides an alternative approach to select the appropriate trade-off between image quality, temporal resolution and SNR.
5. Conclusion
In this paper, we used an XD-GRASP sequence for the evaluation of HCCs in liver cancer patients, evaluating the impact on image quality and quantitative DCE-MRI perfusion parameters when varying the number of respiratory motion states. This prospective study showed that the normalized maximum intensity time ratio, peak enhancement ratio and transfer constant from the portal venous plasma to the extravascular space were sensitive to the number of motion states and to the temporal resolution, yielding statistically significant differences compared to results using a single motion state. While a higher number of motion states improves CNR and SNR, the resulting lower temporal resolution can also influence quantitative parameters that capture rapid signal changes. Thus with lower displacement, GRASP is more advantageous with higher temporal resolution as there was no significant difference XD-GRASP.
Therefore, XD-GRASP can be used to perform quantitative perfusion measures in the liver, but some quantitative parameters may be significantly modified by the number of motion states. These promising results support the pursuit of larger cohort studies.
Funding
Funding for this study was provided by the Canadian Institutes of Health Research (MOP-142401). Fonds de recherche du Québec en Santé (FRQ-S) and Fondation de l'association des radiologistes du Québec (FARQ) Clinical Research Scholarship—Junior 2 Salary Award (FRQS-ARQ #34939) to An Tang.