

Abstract
In this paper we report the re-analysis of the data published in Piersanti et al (2014 Phys. Med. Biol. 59 1857) documenting the charged secondary particles production induced by the interaction of a 220 MeV/u 12C ion beam impinging on a polymethyl methacrylate (PMMA) target, measured in 2012 at the GSI facility in Darmstadt (Germany). This re-analysis takes into account the inhomogeneous light response of the LYSO crystal in the experimental setup measured in a subsequent experiment (2014) performed in the Heidelberg Ion-Beam Therapy Center. A better description of the detector and re-calculation of the geometrical efficiencies have been implemented as well, based on an improved approach that accounts also for the energy dependence of the emission spectrum.
The new analysis has little effect on the total secondary charged flux, but has an impact on the production yield and emission velocity distributions of the different particle species (protons, deuterons and tritons) at different angles with respect to the beam direction ( and
and  ). All these observables indeed depend on the particle identification algorithms and hence on the LYSO detector energy response.
The results of the data re-analysis presented here are intended to supersede and replace the results published in Piersanti et al (2014 Phys. Med. Biol. 59 1857).
Export citation and abstract BibTeX RIS
Introduction
The characterization of the secondary charged particles production induced by ion beams of interest for particle therapy (PT) was the subject of different experimental campaigns in the past (Agodi et al 2012, Henriquet et al 2012, Gwosch et al 2013), due to its fundamental importance in assessing the feasibility of beam range monitoring in PT exploiting the charged secondary emission.
The analysis of the secondary charged particles produced in the interaction of a 220 MeV/u fully stripped  ion beam impinging on a
  cm3 PMMA has been the subject of a dedicated publication in 2014 (Piersanti et al 2014). The published data were collected in 2012 at the GSI facility in Darmstadt (Germany).
During an experimental campaign performed in February 2014 at the Heidelberg Ion-Beam Therapy Center (HIT, Heidelberg, Germany), an heterogeneous light response of the LYSO crystals used as secondary charged particles detector was observed. This evidence triggered a re-analysis of the published data to evaluate the impact on the measurements of the proton (p), deuteron (d) and triton (t) populations in the reconstructed track sample.
In this paper, the inhomogeneity of the crystal light response is presented in section 2, as well as its impact on the Particle IDentification (PID) results. The new emission velocity ( ) spectra and particle yields obtained with the improved analysis are presented in sections 3 and 4, respectively. While re-analyzing the data collected at GSI, we have also refined the calculation of the detector and geometrical efficiencies applied to the reconstructed track sample, explicitly taking into account the energy dependence of the charged fragments. The new efficiencies calculation is discussed in section 4.1.
As the total flux of charged particles ( ) produced in the interaction of a PT ion beam with a PMMA target is of the same order of magnitude than the one published in Piersanti et al (2014), the implications for PT applications discussed in the previous paper still hold and are not discussed nor presented again hereafter.
1. Experimental setup
Figure 1 left shows a sketch of the experimental setup (not to scale) of the 2012 data taking (GSI data in the following). A 1.1 mm thick plastic scintillator (start counter, SC), placed before the PMMA target, was used to count the primary ions. A drift chamber (DC) and a LYSO detector were placed both at  or
or  with respect to the beam impinging direction, at a distance of
  and
and  , respectively, from the PMMA center. The DC, composed by 12 wire layers (alternated X and Y views) with 3 cells per layer and filled with a Ar/CO2 (80/20) gas mixture, was used to select and track secondary charged particles, exploiting the distribution of the number of fired cells (Nhits). The LYSO detector was a
  matrix of LYSO crystals,
  cm3 each. Each crystal was wrapped in Tyvek®16 by 5 sides and the four crystals (shown in figure 1(right)) were held together by black tape and read by a single photomultiplier tube (PMT). The response signal from the LYSO detector was used in time coincidence with the SC to form the experiment trigger and for the PID.
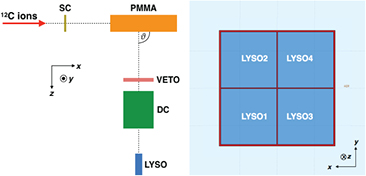
Figure 1. Left: sketch of the experimental setup (not to scale). Right: transversal section of the LYSO detector. The four LYSO crystals (blue) wrapped in Tyvek (red) are visible.
Download figure:
Standard image High-resolution imageA 
 plastic scintillator (VETO in figure 1(left)) was placed between the target and the DC to stop electrons with energies below 0.55 MeV. The 220 MeV
  fully stripped
  beam was Gaussian-shaped, with a standard deviation in the transverse plane of ∼1 cm, measured with ∼
 relative uncertainty by the GSI beam monitor chambers. The beam rate was ranging from hundreds of kHz to ∼1 MHz, with a temporal spectrum of the beam typical of a synchrotron machine. The beam was pulsed, with a triangular shape spill
  s long and a peak rate occurring
  s after the spill start. The beam spill was interleaved with a no beam time window of
  s. More details on the experimental setup and on the Data Acquisition (DAQ) can be found in Piersanti et al (2014).
2. LYSO detector response and particle identification procedure
In 2014 the LYSO crystals used for the GSI experiment were calibrated at the HIT center using protons of several energies (50 MeV  210 MeV, HIT data in the following). The calibration data allowed to measure the quenching effect in the LYSO crystals and the saturation of the LYSO PMT taking place at energies of interest for PT applications. The response of the different crystals appeared to be significantly different, as shown in figure 2 for protons of 70 MeV (a) and 91 MeV (b), and was characterized by the presence of three clearly distinguishable peaks (two crystals happened to have nearly the same light response).

Figure 2. LYSO detector response to direct proton irradiation at 70 MeV (a) and 91 MeV (b). The integrated signal (charge) distribution shows clearly three different peaks.
Download figure:
Standard image High-resolution imageTherefore, a re-analysis of the GSI data has been performed in order to include the effect of the crystal inhomogeneity when looking at the energy deposited in the LYSO detector (ELYSO) as a function of the Time of Flight (ToF) of charged secondary particles, as defined in Piersanti et al (2014). The charged particles signal selection exploiting the DC detector, asking for  , has not been changed.
Figure 3 left shows the ELYSO versus ToF distribution published in Piersanti et al (2014), while figure 3 right highlights the contribution of each crystal using different colors. The crystal regions (see figure 1) were identified for each detected fragment tracked using the DC.
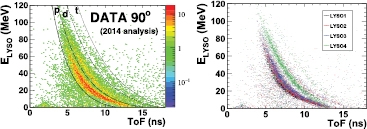
Figure 3. Left: ELYSO versus ToF distribution measured in the  angular configuration, published in Piersanti et al (2014) (figure 4, left). Right: ELYSO versus ToF distribution for fragments impinging on the different LYSO crystals. The contribution of each crystal is shown with a different color.
Download figure:
Standard image High-resolution imageThe limited knowledge about the actual crystal (and hence its energy response) hit by each fragment, due to the DC tracking resolution when extrapolating the DC reconstructed tracks forward to the LYSO detector entrance face, is taken into account when assigning the systematic uncertainty associated to the PID efficiency and the definition of the selection bands (see section 4.3).
In the GSI data taking, the observed LYSO4 energy response is significantly different with respect to the other ones, possibly due to the optical coupling with the PMT. Instead, the (ELYSO, ToF) regions of the other three crystals are approximately overlapping. The handling of the crystals, their transportation and re-assembly between the two different experiments can very well account for the different results (the three distinct peaks observed in the HIT data appear as two main populations in the GSI data).
Protons and deuterons impinging on the LYSO4 crystal where thus identified, using the PID selection bands defined in the published work, as deuterons and tritons.
A new PID procedure has been defined to evaluate the charged particle yield and velocity distribution for each particle species taking into account the specific response of each crystal.
Fragments collected by the LYSO4 crystal, the one that showed a significantly different response from the other ones, were excluded from the data sample as their contribution to the decrease of the total statistical uncertainty would have been balanced by the increased systematic uncertainty related to the Monte Carlo (MC) simulation description of the peculiar crystal response (see section 4).
Electrons, that can be easily identified as the cluster of points centered around ∼2.0 ns in the (ELYSO, ToF) plane, were rejected by requesting ToF  3.5 ns and ToF
  3.0 ns for the
  and
and  angular configuration data samples, respectively. The correct geometrical acceptance, computed excluding the LYSO4 data, and the systematic error coming from the electrons rejection cut were taken into account when evaluating the yield, as described in section 4.
Figure 4 shows that only few tritons are present. Therefore, we decided to neglect such contribution and to perform only the study of protons and deuterons fluxes and velocity spectra. To implement the PID selection, a full MC simulation of 220 MeV/u  ion pencil beam impinging on the PMMA target was generated using the FLUKA code (Ferrari et al 2005, Battistoni et al 2007, 2015), taking into account a detailed description of the primary beam characteristics, of the experimental geometry and the detector resolution, for both
  and
and  angular configurations, as it was done in the previous analysis.

Figure 4. ELYSO versus ToF distribution, measured at  (left) and
  (right), for all LYSOs, except LYSO4, with the energy response equalized to the one of LYSO1.
Download figure:
Standard image High-resolution imageThe MC LYSO energy response was tuned over the data distribution in order to achieve a good data-MC agreement. The simulation was used to identify the charged particle species and compute the selection efficiencies (see section 4.1). Figure 5 left shows the ELYSO versus ToF measured distribution (Data, black dots), superimposed to the MC distribution of Protons (red dots), Deuterons (blue dots) and Tritons (green dots) for the  angular configuration.

Figure 5. Left: ELYSO versus ToF distribution measured at  by LYSO1, LYSO2 and LYSO3 crystals (black dots). The same MC distribution for p (red), d (blue) and t (green) charged fragments is superimposed. Right: MC ELYSO versus ToF distribution (90°) for p, d and t species. The PID functions (solid lines) that separate the different fragments populations are visible, together with the dotted and dashed lines as, respectively, the hard and soft PID selections for the yield systematic error evaluation (see section 4.3).
Download figure:
Standard image High-resolution imageTo draw the PID selection functions, shown as solid lines in figure 5(right), the MC ELYSO versus ToF distribution has been divided in ToF slices of 0.5 ns width. Figure 6 shows the ELYSO distribution in a ToF bin ( ns) for the
  case, fitted with a double Gaussian function: the first peak (mean value
  ) is related to the proton fragments and the second peak (mean value
  ) to the deuteron fragments.
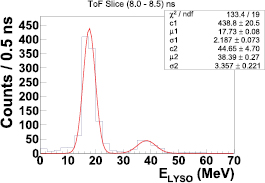
Figure 6. MC ELYSO distribution in the ToF slice (8.0–8.5) ns, for the  angular configuration. The two peaks, fitted with a double Gaussian function, are related to the p and d populations, respectively.
Download figure:
Standard image High-resolution imageThe functions used to separate the proton, deuteron and triton populations (shown in figure 5(right)) were obtained from the fitted central values of the proton and deuteron peaks as a function of ToF and by moving 5 and 4 standard deviations, respectively, from the central value ( ,
,  ). 'Hard' and 'soft' selections were defined in order to compute a systematic uncertainty on the PID selection, by setting the separation 4 (3) and 6 (5) σ from the p (d) central value respectively (see section 4.3).
3. Emission velocity (β) spectra
With the new PID selection, the β spectra have been re-obtained following the same procedure described in Piersanti et al (2014). Figure 7 shows the new β spectra (red triangles) superimposed to the old published ones (black circles) for p (left) and d (right) fragments detected at  (top) and
  (bottom), normalized to the number of primary carbon ions.
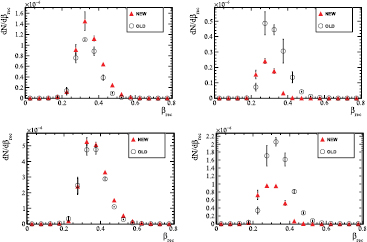
Figure 7. Emission velocity distributions of p (left) and d (right) fragments detected in the angular configuration at  (top) and
  (bottom), normalized to the number of primary ions. The comparison of the new spectra (red triangles) with the old spectra (black circles) published in Piersanti et al (2014) is shown.
Download figure:
Standard image High-resolution imageAs expected the measured spectra have the same shape, but different normalization with a depletion of the deuteron population and an increase of the proton one.
4. Yields
The measurement of the charged secondary particle yield depends on the fragment detected kinetic energy ( ) and reconstructed emission position (xPMMA) through the calculation of the detection efficiency.
  was evaluated from the fragment ToF and xPMMA was evaluated from the backward extrapolation of the secondary track reconstructed by the DC to the (x,y) plane containing the beam line inside the PMMA. While performing a reanalysis of the data, the explicit dependence of the efficiency on the detected kinetic energy
  and xPMMA was accounted for, unlike what was done in the previous publication where an efficiency averaged over the full energy production range was used. The current strategy implies a correction which significantly affects the determination of the production yields, especially at low energies where the probability that a fragment is absorbed in the PMMA is higher. The yield of charged secondary particles was computed using the following equation:

where NC is the number of primary carbon ions as defined in Piersanti et al (2014) and  is the DAQ dead time efficiency. NC was corrected by the factor corrGT that takes into account the underestimation of the incoming ion total number: multiple carbon ions interacting with the SC detector within the discrimination time of the SC signal (80 ns) cannot be detected. The corresponding value of the correction at 90 and 60 degrees are corr
 and corr
 . More details on the corrGT evaluation can be found in Mattei et al (2015). The symbol
  represents the number of charged secondary particles (identified as p or d) in each
  –xPMMA (i–j) bin. Figure 8 shows the measured
  versus xPMMA distribution of proton selected particles detected in the
  (left) and
  (right) angular configuration. The
  is accounting for the DC signal selection and the geometrical and detector efficiencies and
  is the PID selection efficiency. The following (section 4.1) describes the evaluation of each efficiency term.
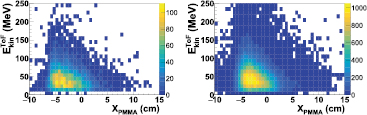
Figure 8. Measured kinetic energy  (bin width = 10 MeV) as a function of the reconstructed emission position
  (bin width = 0.5 cm) of secondary protons detected in the angular configuration at
  (left) and
  (right).
Download figure:
Standard image High-resolution image4.1. Efficiencies
To evaluate the DAQ dead time efficiency  , the DAQ dead time τ was computed as a function of the instantaneous event by event rate, taking into account the event size measured during the data acquisition, as detailed in Mattei et al (2015). In the data taking in the
  configuration,
  is ∼
is ∼ while at
  is ∼
is ∼ , depending on the DAQ event rate. The detection and geometrical efficiency
  was computed using a dedicated MC simulation. Since
  relies only on the capability of the MC software to simulate the secondary fragments transport (and not on the fragments production nuclear models), a flat simulation was used in which secondary protons and deuterons were generated inside the PMMA target with uniform energy and production position spectra. The spatial distribution of secondary fragments in the z–y plane was modeled with a Gaussian function centered along the PMMA central axis with a 1 cm RMS width equal to the primary ion beam width. The primary ion beam range is
  cm, determined from a MC simulation (GEANT) (see Piersanti et al (2014)) and therefore the BP is expected to be at ∼
 cm. The production along the PMMA axis (x axis) was continuous in the range
 ![$x_{\rm PMMA}= [-10, 15]$](https://content.cld.iop.org/journals/0031-9155/62/21/8483/revision2/pmbaa8b35ieqn076.gif) cm, larger than the PMMA dimensions (going from
cm, larger than the PMMA dimensions (going from  cm to
cm to  cm) in order to fully account for the whole spatial distribution of the reconstructed tracks, while the kinetic energy distribution was continuous in the 10–250 (20–250) MeV range for the p (d) samples.
The efficiency matrix  for protons detected in the
  (
( ) angular configuration is shown in figure 9left (right) and is computed as the MC detected
  versus xPMMA distribution of the simulated protons normalized to the number of secondary protons produced in each bin.

Figure 9. Protons efficiency matrix  for the
  (left) and
  (right) angular configurations.
Download figure:
Standard image High-resolution image
Given the energy loss of secondary fragments inside the PMMA, in order to take into account and correct for range boundary effects in the  evaluation, the efficiency values in the edge bins in energy (10–20 MeV and 220–230 MeV) were extrapolated to the lower and higher energy values. Few charged secondary tracks are reconstructed outside the PMMA region due to the multiple scattering effect and reconstruction algorithm errors. Therefore, to correct for xPMMA range boundary effects on
  , the efficiency values in the edge bins (
 cm and 13.5–14.0 cm) were extrapolated to the lower and higher xPMMA values.
The selection efficiency  was computed from a full MC simulation by measuring the probability that a fragment of type u could be measured in the region v (
 for protons and deuterons respectively) and taking the diagonal values of the resulting mixing matrix:
  .
.  is the number of fragments u measured in the region v normalized to the total number of fragments Nu in the (ELYSO–ToF) plane.

The u and v regions are defined as previously described in section 2. The mixing matrix defined in equation (2) is used to estimate the selection efficiency (diagonal elements) and to correct the yield estimate for the wrong PID assignment (cross feed of different PID hypothesis) whenever the off diagonal elements are statistically different from zero. The matrix has been computed both for the  and
and  angular configurations:
The only off diagonal element that give a significant contribution to the yield evaluation is  , that takes into account the d population that is mis-reconstructed as p as a consequence of the partial fragment containment inside the LYSO detector.
4.2. Proton and deuteron production yields
The measured yields, computed using equation (1), for the p and d fragments populations shown in figure 8 and detected in the  and
and  angular configurations are listed hereafter:
The calculation of the systematic uncertainties is detailed in the following (section 4.3).
4.3. Systematic uncertainties
Several sources of systematic uncertainty were considered, related to the different terms that enter equation (1), used to compute the particle yields.
In order to account for the limited precision on the measurement of the number of incoming carbon ions, the term  has been computed. Such contribution to the systematic uncertainty is related to the uncertainty on the correction factor corrGT. It was evaluated by means of a dedicated MC simulation of the beam rate and spill shape, varying the MC beam shape models and mean rate conditions. More details can be found in Mattei et al (2015).
The systematic uncertainty  is related to the
  evaluation. Such term takes into account the different conditions in which the DAQ was operated, during the data taking and during the laboratory sessions dedicated to the τ (DAQ dead time) measurement.
  was computed considering the maximal and minimal τ values compatible with the extrapolation of the τ laboratory measurements at the event by event rate and event size measured during the data taking.
  and
and  were calculated, respectively, and the corresponding yields (
 and
and  ) were obtained. The systematic uncertainty
  was defined as the semi-dispersion of the corresponding yield results (Mattei et al 2015).
The systematic error  accounts for the uncertainty on the PID efficiency and DC LYSO crystals mis-identification. It was evaluated by varying the particle identification functions used to identify protons and deuterons in the (ELYSO–ToF) plane. Figure 5 right shows the different PID functions determined for the hard and soft selections of the proton and deuteron fragments with respect to the default PID functions (see section 2). The semi-dispersion of
  was computed applying the hard and soft selections and it was taken as an estimate of the PID related systematic uncertainty.
As  was evaluated from the FLUKA MC simulation with a sample of limited statistics, the statistical uncertainty of the matrix elements was propagated as systematic uncertainty when performing the yield calculation. This contribution to the total systematic error is negligible (absolute value of the order of
  for both p and d yields measured at
  and
and  ).
).
The yield relative systematic error from each systematic source is given in table 1.
Table 1. Relative systematic error for each source of systematic uncertainty contributing to the evaluation of the proton (p) and deuteron (d) yields measured at  and
and  with respect to the beam incoming direction.
 |
 |
|||
|---|---|---|---|---|
 |
 |
 |
 |
|
 |
 |
 |
 |
 |
 |
 |
 |
||
 |
 |
 |
||
5. Conclusions
The discovery of an heterogeneous light response of the different scintillating LYSO crystals, used for the charge secondary particles identification procedure in the analysis reported in Piersanti et al (2014), required a full data sample re-analysis to correct the published fragment yields measurements.
The production yields and emission velocity distributions of the different particle species produced in the interaction of a 220 MeV/u  ion beam impinging on a polymethyl methacrylate (PMMA) target were recomputed. In the new analysis, the description of the detector and geometrical efficiencies for the yield evaluation was improved, taking into account the energy dependence of the emission spectrum of secondary fragments, as well as the DAQ dead time efficiency evaluation.
While the observed triton production yield is now compatible with zero, within the experimental uncertainties, the estimated total charged secondary yield ( ) is however close to the one published in Piersanti et al (2014), with an overall increase due to the improved efficiency calculation that takes into account the energy dependence of the fragments absorption probability inside the PMMA target.
The implications for beam range monitoring applications in Particle Therapy that exploit charged fragments, discussed in Piersanti et al (2014), are hence holding true and are supported by the updated results.
Footnotes
- 16
Dupont registered trademark. Tyvek is a non-woven synthetic material.