

Abstract
The surface-enhanced Raman scattering (SERS) is an effective spectral technology based on Raman scattering, but in practice, the commonly used SERS substrates suffer from low sensitivity and poor stability. In order to overcome these limitations, the SERS substrates were prepared from hydrophobic modification of dodecanethiol (C12) coupled with a flexible substrate, which was then used for pesticides detection in water. A flexible PA@Ag-C12 substrate with surface functionalization has been obtained. This work aims to investigate the self-assembly of Ag NPs modified with C12 onto polyamide (PA) membranes. Initially, transmission electron microscopy and scanning electron microscopy were used to analyze the substrate's morphology. Then with the help of an energy-dispersive spectrometer, sulfur content of C12-modified Ag NPs was analyzed. In order to determine the hydrophobicity of the modified Ag NPs, the contact angle was used. The results indicate that the gap between Ag NPs on PA membrane can be effectively controlled in order to prevent Ag NPs from aggregating. Furthermore, the finite-difference time-domain analysis indicated that the PA@Ag-C12 substrate exhibited a stronger electromagnetic enhancement effect than the PA@Ag substrate. By reducing NPs gaps on the PA membrane, the number of 'hot spots' increased, and the SERS performance of the substrate was improved as a result. According to the results of this study, this method can greatly reduce the manufacturing costs and time costs of the SERS substrate while maintaining the original uniformity. The SERS performance of PA@Ag-C12 was found to be three orders of magnitude better than that of PA@Ag direct self-assembled substrate, and the detection limit for Rhodamine 6G (R6G) was approximately 8.47 × 10⁻¹⁴ M. On the basis of the PA@Ag-C12 substrate, thiram is detectable at a detection limit of 5.88 × 10⁻¹¹ M with a high degree of sensitivity and repeatability.
Export citation and abstract BibTeX RIS
1. Introduction
Pesticides are widely employed in agriculture to assure and encourage the growth of plants and crops by preventing, controlling, or removing diseases, pests, weeds, and other harmful organisms that pose a threat to the industry [1–3]. As the use of pesticides increases, it inevitably seeps into environmental media including soil, water, the atmosphere, and food, endangering human health, the environment, and food safety [4, 5]. People who consume foods contaminated with pesticide residue or drink beverages containing pesticides run the risk of developing a number of illnesses, such as cancer, allergies, asthma, and hormone disruption [6]. Thiram is a dimethyl-dithiocarbamate chemical that is frequently used to fruits, vegetables, and field crops as a preventive fungicide [7]. Based on the chemical properties of the dithiocarbamate group, which can impede the action of HS-containing enzymes and coenzymes in fungal cells, thiram has biological activity [8–11]. Typically, thiram is used to treat fungal diseases associated with the development of fruits and their storage after harvest [12]. However, it is considered to be a carcinogen and teratogenic agent in humans. Additionally, thiram is hazardous to fish and poultry [13–15]. Therefore, thiram has been prohibited for foliar treatment in the European Union since 2019 and other applications since 2020 [16]. However, there are still many countries that still use thiram.
For the measurement of pesticide residue, mass spectroscopy in conjunction with gas/liquid chromatography has been the gold standard approach used extensively since the 1970s. These determination methods offer a high degree of sensitivity and precision, but their lengthy operating processes and intensive sample preparation have hindered their advancement [17–20]. Measurement of minuscule quantities of probe molecules without labeling can be achieved with great competitiveness using SERS [21–26]. SERS technology is also non-destructive and the analytes can be recovered from the substance being tested [17, 27, 28]. Due to its powerful molecular detection capabilities, SERS is often utilized in a wide range of fields including environmental analysis, food security, biomedicine, and many others [29–31].
However, the SERS signal enhancement is limited to the metal surface at most times, it is necessary to use chemical modifications to increase SERS's sensitivity. There are two effective methods for enhancing SERS sensitivity. Analyte enrichment strategy based on hydrophobic SERS from the top-down substrate fabrication is one approach. Zhou et al, for example, present a methodology to detect low concentrations using ultrasensitive SERS analyzes within water droplets on plasmonic micro/nanostructures that are hierarchical that assists partial Leidenfrost evaporation. With this method, nanomolar analytes (10−9 M) in an aqueous solution may be detected using SERS [32]. Another method is the template-assisted self-assembly process, which can be used to produce high-density SERS hot spots structures. For generating SERS substrates with high-density hot spots, Yang et al, for illustration, devised a method for manufacturing negatively charged gold nanoparticles utilizing large-area electrically charged polyaniline nanofibers as templates [33]. While researchers have made significant progress and developed reliable strategies, there is still a need to design and synthesize substrates that are easy to process, tough, and sensitive.
Because they can adapt to the underlying item, flexible substrates have an advantage over traditional rigid substrates. They are easily cut into a variety of shapes and sizes and may be wrapped around curved surfaces for applications needing non-planar, flexible, or conforming surfaces [11, 34]. In addition, by loading Ag onto flexible substrates, agglomerations were prevented and the homogeneity was enhanced compared to Ag nanoparticles alone [35]. In addition to the controlled development of colloidal plasmonic nanostructures, the assembly process required to fabricate two-dimensional (2D) arrays with small interparticle gaps is essential for the creation of efficient SERS structures [18, 36]. Therefore, for the application of SERS molecular detection technology, it is essential to design substrates with high efficiency, repeatability, and stability.
In this study, C12 was functionalized on the surface of Ag NPs to make them hydrophobic. SERS substrates are constructed by fabricating and loading hydrophobic Ag NPs onto flexible PA membranes. As a result of using C12 as a surface modification, part of the citrate on the surface of Ag NPs can be replaced, the surface potential energy can be reduced, and the Ag NPs can be modified to become hydrophobic. It is important to mention that the PA backbone contains a large number of amide groups, which are capable of interacting with Ag NPs and are capable of enabling quick self-assembly of Ag NPs. With the help of experimental optimization, a quasi-single layer of compact, homogeneous, and monodispersed hydrophobic Ag NPs can be generated on the surface of PA, resulting in an abundance of hot spots. Consequently, the PA@Ag-C12 membrane substrate exhibits significantly increased Raman intensities and favorable signal uniformity for the R6G probe molecules. Due to its convenience for subsequent processing, it can easily be cut into various sizes and shapes. The flexibility of the substrate provides it with a high level of mechanical resilience to withstand bending to a certain degree. As a result of hydrophobic modification methods, the substrates are suitable for drop-coating deposition Raman technology, suppressing the 'coffee exchange' effect and enhancing substrate capture of the target [37]. Several features of the fabricated SERS substrates were evaluated and compared, including sensibility (i.e. linear range, the limit of detection (LOD), enhancement factor, stability, reproducibility, and repeatability).
2. Materials and methods
2.1. Materials
Silver nitrate (AgNO3, ≥99.8%), polyamide 6 powder, methanol, sodium hydroxide (NaOH, ≥96%) sodium borohydride (NaBH4), formic acid, and trisodium citrate dihydrate were purchased from Chemical Reagent Co., Ltd Sinopharm. Thiram and 1-C12 were obtained from Macklin Biochemical Co. Ltd R6G, ~95% was ordered from Sigma Aldrich. All of the agent chemicals were employed immediately without the need for additional management, and solutions were created using experimental deionized water (18.2 MΩ cm−1).
2.2. Synthesis of 30 nm Ag NPs
The conventional seed growth technique was created by Li et al [38], who first created 4 nm Ag NPs and utilized them as the core seed: the concentration of sodium citrate solution and silver nitrate solution were both 1% (the concentration remained unchanged in subsequent experiments). In a flask with a round bottom, combine 20 ml of sodium citrate solution with 75 ml of ultra-pure water. The mixture was added to an oil bath maintained at 75 °C and swirled for ten minutes. Subsequently, the round-bottom flask was filled with 2 ml of 1% sodium borohydride solution and 1.6 ml of silver nitrate solution. It was then allowed to stir for 60 min, raised to a level that's pleasant, and switched out with a 100 ml flask that is volumetric with a fixed volume. Synthesis of 30 nm Ag NPs: Once a round-bottom flask was filled with 2 ml of sodium citrate solution, it was mixed in an oil bath at 131 ℃ for 20 min using 70 ml of ultra-pure water. After that, 10 ml of 4 nm Ag NPs solution and 1.6 ml of silver nitrate solution were added, and the mixture was stirred for another 60 min before being repeated and raised to a level that's pleasant. Place in a 100 ml volumetric bottle and set the volume. Refrigerate until ready to use [39].
2.3. Preparation of PA@Ag-C12 membrane
The overall fabrication scheme for the PA@Ag-C12 SERS substrate is illustrated in figure 1. Using formic acid as the solvent, a solution of PA with a of concentration of 1% was initially prepared. A sheet of glass is rinsed with ethanol, and ultrapure water, and then followed by drying. 300 μl of PA solutions should be pipetted onto a glass slide using a 100 μl pipette. Next, use a needle to uniformly distribute the PA solution to the slide's surface. The glass slide with PA solution was placed in an oven at 60 °C for 10 min and allowed to dry to a membrane. And then PA was removed from the glass slide and cut into 5 × 5 mm PA membranes. The PA membrane was immersed in 10 ml of 30 nm Ag NPs solution at pH = 6, shaken for 10 min, and then 30 μl of 1% C12 methanol solution was added and the reaction was allowed to proceed for 3 h, the drying process as above.
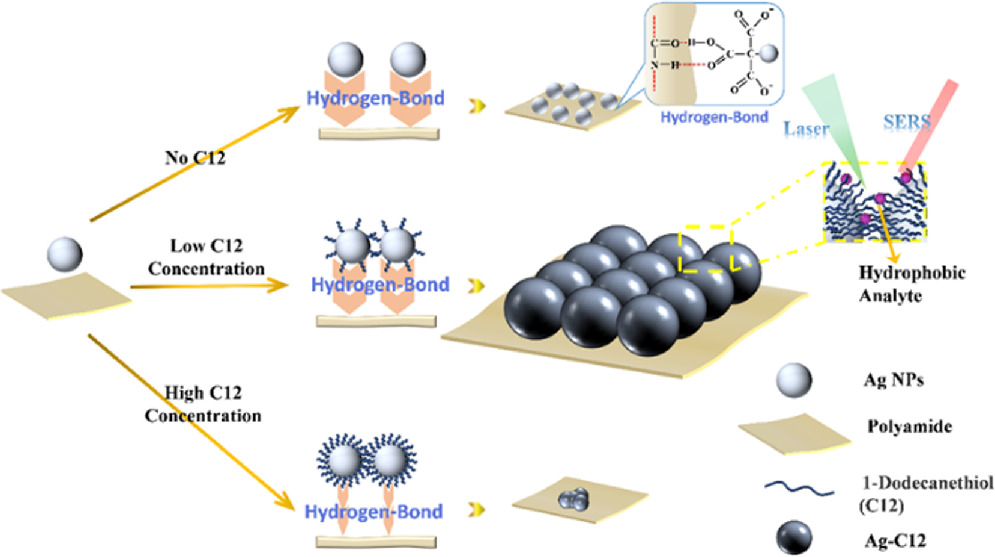
Figure 1. Schematic illustration of the construction of the self-assembled PA@Ag-C12 array substrate.
Download figure:
Standard image High-resolution image2.4. Instrumentation
Numerous techniques are used to characterize nanoparticles (NPs). The equipment includes energy dispersive X-ray analysis (EDS), scanning electron microscopy (SEM) (quant250 FEG, FEI), and transmission electron microscopy (TEM) FEI Tecnai 20 high-resolution transmission electron microscopy (Tecnai G2 20 LaB6). The Raman spectrometer (Aramis, Horiba, Japan) was used to obtain the SERS spectra, with a 532 nm laser wavelength.
2.5. SERS measurements
The choice of the probe molecule was R6G. Using a range of R6G solutions, the SERS performance of PA@Ag and PA@Ag-C12 substrates made with different C12 concentrations was assessed (10–7–10–13 M). The prepared membrane substrate was sprayed with 10 μl of the gradient concentration R6G solution and rapidly dried at 60 °C for 5 min. The substrate was allowed to dry completely to ensure that the target analyte was completely adsorbed onto the substrate, and then they were used for Raman measurements. Thiram solutions (10−4–10−10 M) were prepared using ultrapure water, and the same protocol was used for the thiram measurements. All Raman experiments were performed using the same setup: a 532 nm Ar-ion laser with 0.54 mW power, recording spectra with attenuation for 10 s, and a 50× objective used to quantify the laser's spot size, which was 1 μm in diameter. To achieve repeatable SERS measurements, each substrate was measured at least five times.
2.6. Finite-difference time-domain (FDTD) model
The FDTD approach simulates the strength of the electric field in the constructed three-dimensional PA@Ag and PA@Ag-C12 structures. The high-resolution TEM pictures of PA@Ag and PA@Ag-C12 match their corresponding model structures. The dielectric constant of Ag NPs is resulting from the experimental data of Liu [40]. The surrounding medium air's refractive index is set at 1.0. Accurately matched layer absorption boundaries are used to pick a non-uniform three-dimensional mesh with a mesh size of 1 nm. The electromagnetic field distribution was measured with a planar wave source operating at 532 nm.
3. Results and discussion
3.1. Characterization of the PA@Ag-C12 membrane
According to the Ag NPs synthesis method, there are a large number of citric acid ions on the surface of Ag NPs. PA is a polymer that contains an amide group (−CO-NH−) in its main chain. Under acidic conditions, citric acid ions will form hydrogen bonds with amino groups, resulting in Ag NPs self-assembling on PA [35, 41]. As illustrated by TEM in figure 2, Ag NPs are composed of spherical nanoparticles with a diameter of ~30 nm and excellent dispersion. The elemental distribution of PA@Ag by EDS in figure S1 consists of 59.3% C, 21.9% N, 18.0% O, and 0.9% Ag. And figure S2 illustrates the elemental distribution of PA@Ag- C12, which is 66.6% C, 18.5% N, 12.5% O, 2.4% Ag, and 0.1% S. In comparison to the two substrates, the modified SERS substrate has an increase in C content of 7.3%, an increase in Ag content of 1.5%, and a new appearance of S. Based on the results, it was determined that C12 was successfully loaded onto Ag NPs surface of the PA@Ag substrate.
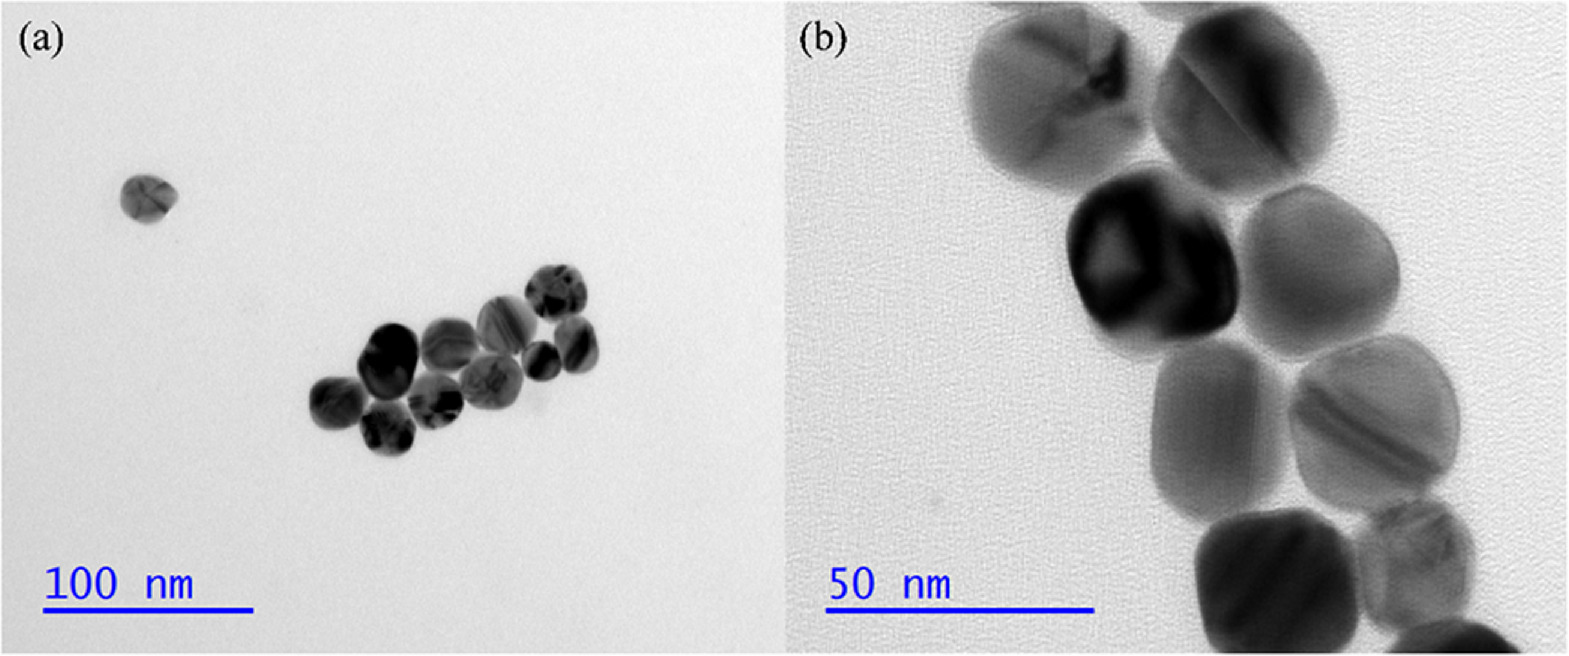
Figure 2. TEM images of 30 nm Ag NPs with scales of (a) 100 nm, and (b) 50 nm.
Download figure:
Standard image High-resolution imageAs illustrated in figure 3, the SEM images show PA@Ag-C12 substrates synthesized with 0–0.5 μM of C12 to determine how much Ag NPs were loaded on the PA surface. Figure 3(a) illustrates the PA@Ag produced by putting the PA membrane in a 30 nm Ag NPs solution for 24 h. It was used as a control group of all subsequent Raman measurements. Respectively, figures 3(b)–(d) displays the SEM images of PA membranes functionalized in Ag NPs solution containing 0.1–0.5 μM C12 for 3 h. As a result of C12 adhering to the surface of Ag NPs, the reaction times were all controlled to 3 h. It is anticipated that the surface of C12 functionalized Ag NPs will interact hydrophobically with one another, resulting in the nanoparticles being aggregated to maintain their stability [42]. Figures 3(a), (b) shows that the quantity of Ag NPs on the PA membrane reduced when C12 was introduced to the system. Due to the loading of C12 by Ag NPs, the stable solution became unstable and the time for Ag NPs to functionalize on the PA membrane was significantly reduced. The results of figures 3(b)–(d) demonstrate that the amount of Ag-C12 on the PA membrane gradually increases with the addition of 0.1–0.3 μM C12, the Ag NPs adhere uniformly on the PA membrane without agglomerating and that the high coverage of Ag-C12 significantly enhances the SERS effect. As shown in figures 3(e), (f), when 0.4–0.5 μM C12 is added to the system, the amount of functionalized Ag-C12 on PA membrane gradually decreases. As a consequence, stable hydrogen bonds cannot be formed between Ag NPs and PA membranes, thus resulting in agglomerations between Ag NPs and decreases in hydrophobic properties [43]. According to the results, Ag NPs loaded on the PA membrane show a trend of increasing and diminishing when 0.1–0.5 μM C12 is added. This suggests that the loading of C12 was able to increase the load of Ag NPs on the PA membrane in a controlled manner.
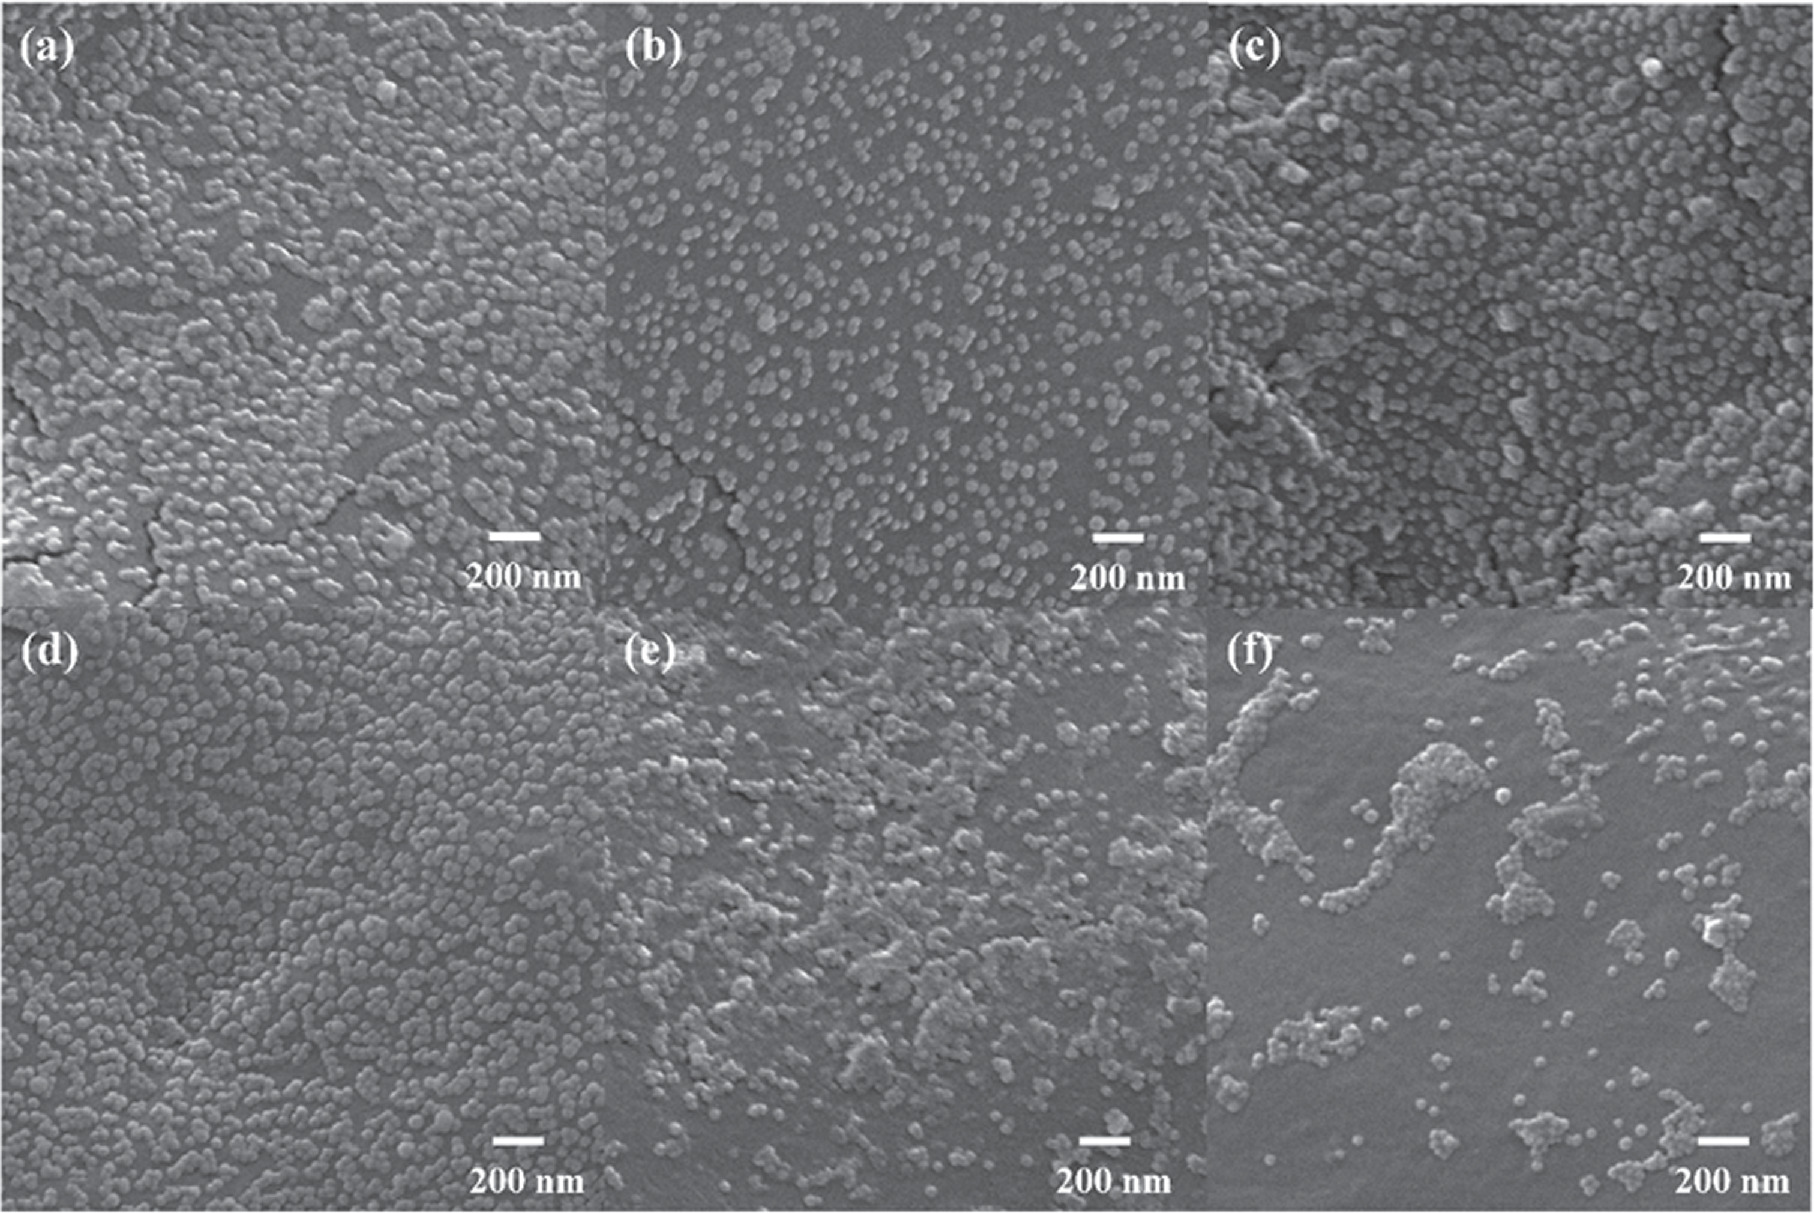
Figure 3. SEM images of PA@Ag with different dosages of C12 added: (a) 0 μM, (b) 0.1 μM, (c) 0.2 μM, (d) 0.3 μM, (e) 0.4 μM, and (f) 0.5 μM.
Download figure:
Standard image High-resolution imageAs illustrated in figure 4, when 0–0.3 μM C12 was added, the contact angle of the substrate gradually increased from 61.18° to 111.52°. The transformation from hydrophilicity to hydrophobicity is a result of the chemical functionalization of PA@Agsurfaces. This indicates that loading an appropriate amount of C12 on the surface of Ag NPs can improve its hydrophobicity and reduce its surface potential, thus reducing the particle gap. While the contact angle gradually decreased to 79.34° following the addition of 0.4–0.5 μM C12. When 0.3 μM C12 is added, the substrate exhibits the highest hydrophobic effect with a contact angle of 111.52°. Ag NPs and sulfhydryl groups form strong silver-sulfur bonds, which brings about the attachment of C12 to the Ag NPs surface (Ag-C12). When the quantity of C12 increases, more C12 adheres to the Ag NPs surface, leading to a stronger hydrophobic effect on the SERS substrates. However, the contact angle was not proportionate to the amount of added C12 as expected, this phenomenon may be due to the attachment of C12 altering the attachment of Ag NPs on the PA membrane.
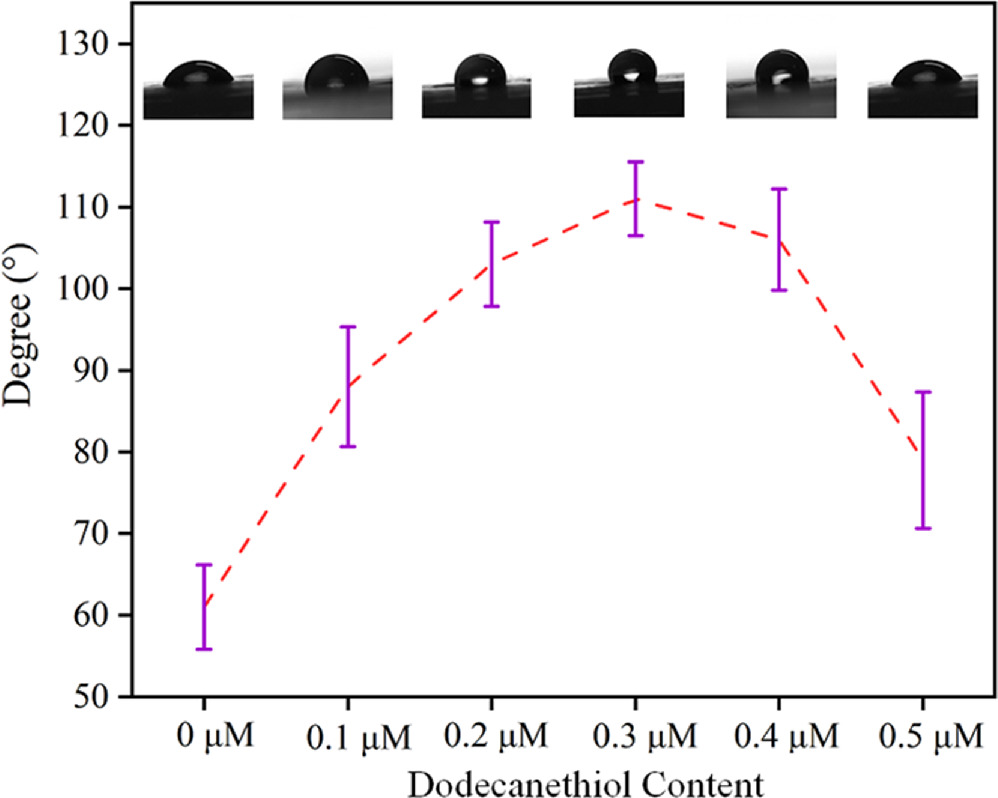
Figure 4. Contact angle diagrams of PA@Ag with different dosages of 0–0.5 μM C12 added.
Download figure:
Standard image High-resolution imageIt has been observed that the amount of Ag NPs on the PA membrane is affected by the levels of C12 content, in such a way that the number of Ag NPs initially increases and then decreases. Initially, the original citrate-modified Ag NPs lost their capacity to remain in solution and experienced changes in their surface electrical characteristics when a little quantity of C12 was added to them in order to generate stable silver-sulfur bonds. Moreover, the reaction time was shortened from 24 to 3 h, and the amount of Ag NPs on the 0.1 μM C12 functionalized PA membrane PA@Ag-C12 was slightly decreased compared with PA@Ag. Secondly, when C12 concentrations are increased to 0.2 and 0.3 μM, the C12 partially replaces citrate on the surface of Ag NPs [44], thus reducing the potential energy on the surface and altering the hydrophobic Ag-C12 surface, thereby reducing nanoparticles distance. There is an increase in the number of Ag NPs on the surface of the PA membrane. Moreover, the dense coating of C12 on the Ag NPs surface caused difficulties in forming hydrogen bonds between the citrate ions on the Ag NPs surface and the amino groups on the PA membrane, which prevented Ag NPs from loading and decreased the amount of Ag NPs on the PA membrane as the concentration of C12 increased to 0.4 and 0.5 mM.
3.2. PA@Ag-C12 SERS performance
Firstly, SERS substrate optimization experiments need to be performed. Using R6G as the probe molecule, Raman measurements were carried out on PA@Ag-C12 synthesized with 0–0.5 μM C12. As shown in figure 5, six substrates were measured using 10–9 M R6G solutions, and there is an upward trend in the SERS intensity, followed by a downward trend. This is consistent with the corresponding Ag NPs loading amount on the PA membrane as shown in figure 2. It was found that 0.3 μM C12 functionalized PA@Ag-C12 exhibited the best SERS effects. The R6G concentration being 10−9 M, the characteristic peak at 609 cm−1, which corresponds to the C–C–C in-plane ring vibration [45], has a signal intensity of about 3000. It is estimated that PA@Ag-C12 exhibits a SERS intensity of approximately 4 times greater than PA@Ag substrate.

Figure 5. (a) Raman plot of 10−9 M R6G detected by PA@Ag with 0–0.5 μM dosage of C12 added, and (b) corresponding SERS peak intensities of R6G at 609 cm−1.
Download figure:
Standard image High-resolution imageBased on the SEM (figure 3) and the contact angle (figure 4) characterization of the substrate, the content of C12 for Ag NPs surface functionalization affects the final loading of Ag NPs on the PA membrane. In the presence of too much C12 in the solution, the Ag NPs were covered with a layer of dense C12. It became really difficult for Ag NPs to be loaded onto the PA membrane through the formation of hydrogen bonds. Due to the amount of Ag NPs on the PA surface reduced, the SERS performance of the substrate decreased. In this case, the PA@Ag-C12 substrate functionalized with 30 μM C12 exhibits the optimal hydrophobic properties as well as the maximum amount of Ag NPs, thus, the best SERS performance.
To assess the substrate's SERS performance both before and after modification, Raman studies utilizing R6G are performed on PA@Ag and PA@Ag-C12, respectively. PA@Ag and PA@Ag-C12 are capable of detecting a minimum of 10−10 and 10−13 M R6G using Raman spectroscopy. As shown in figure S3, the characteristic peaks of 10−10 M R6G on the PA@Ag substrate are obscured. Figure 6 illustrates that the Raman signal at 609 cm−1 and the R6G concentration are linearly related in the range of 10−9–10−13 M R6G, with a correlation coefficient R2 of 0.949 and calculated LOD of 8.47 × 10⁻¹⁴ M (S/N = 3).
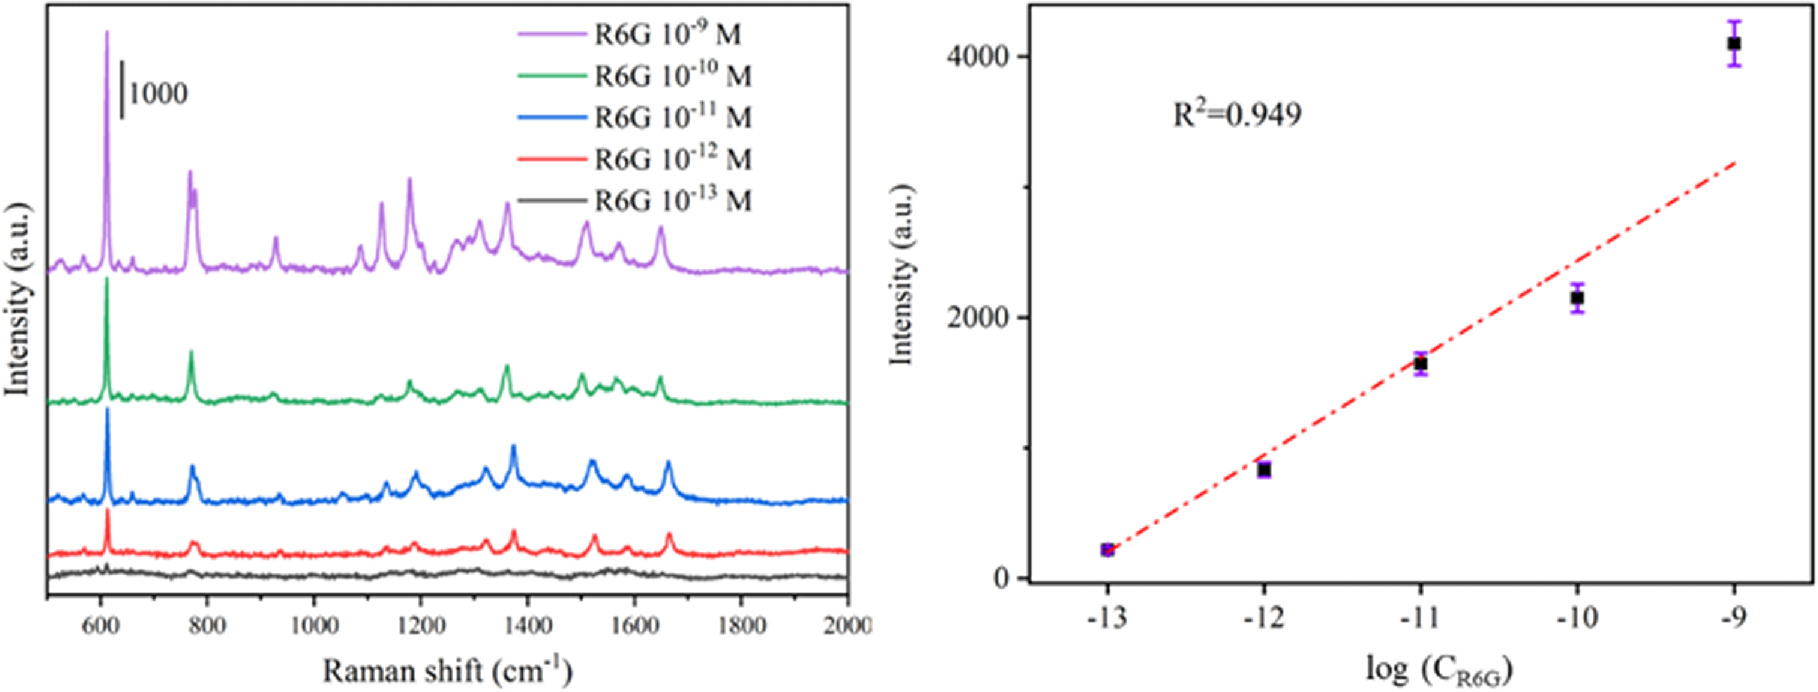
Figure 6. (a) Raman spectra of different R6G concentrations obtained from PA@Ag-C12 nanoarray substrate, and (b) corresponding Raman intensity of R6G at 609 cm−1.
Download figure:
Standard image High-resolution image3.3. Influence of different pH on SERS properties
Because Ag NPs loading on PA membrane can be influenced by pH, the Raman spectra of 10−8 M R6G with PA@Ag-C12 as SERS substrate assembled under various pH ranges from 3 to 8 were carried out, as shown in figure S4. The substrate exhibits the strongest SERS performance at pH = 6, and the Raman intensity of PA@Ag-C12 assembled under different increases at first and then decreases. This is consistent with previous research that the pH-dependent hydrogen bond exists between PA and Ag NPs [35].
3.4. FDTD Modeling and SERS performance theoretical calculation
It is possible to evaluated and calculated optical processes involving NPs or NPs complexes using FDTD method. Based on FDTD simulation, the electric field intensity generated by the Ag NPs distribution on the surface of PA@Ag and PA@Ag-C12 substrates was determined. The incident light source (plane wave) was perpendicular to the SERS substrate surface and facing in the direction of the z-axis. An excitation wavelength of 532 nm was selected, and the monitor direction was set perpendicular to the x-y plane of the light source. The size and distribution of the simulated NPs were obtained from the high-resolution TEM images. The permittivity of Ag NPs is Ag (Silver)—Palik (0–2 μm), which is obtained from Palik's experimental data. The surrounding medium is set to air, with a refractive index of 1.0 [46, 47].
The spacing between the NPs exhibits high SERS features in the 0–6 nm region, which is strongly correlated with the electromagnetic coupling between them. Ag NPs will produce a strong electromagnetic coupling effect when they are close together, and the effect will quickly diminish when the particles are far away. The size distributions of Ag NPs on PA@Ag-C12 and PA@Ag, respectively, are shown in figures S5(a)–(b). The distribution of Ag NPs is centered at around 30 nm, which is consistent with the size of Ag NPs in the lens chart. The bar chart shows that there are more Ag NPs on PA@Ag-C12 than on PA@Ag. Ag NPs may stack extrude and result in different size distributions. The gap distribution of Ag NPs on PA@Ag-C12 and PA@Ag is represented by figures S5(c)–(d). The bar chart indicates intuitively that PA@Ag-C12 is more compact than PA@Ag, with 32.8% of the gap distribution localized in a 5 nm region. However, only 9.3% of the gaps in PA@Ag are smaller than 5 nm.
Enhancement factor (EF) was usually used to quantitatively evaluate the enhancement performance of the SERS substrate. The SERS-enhanced factor for R6G adsorbed on PA@Ag-C12 was calculated based on the following equation [48]

where ISERS and IRS are the intensities of a specific peak of an analyte in the SERS and normal Raman (non-SERS) spectra, respectively, measured under identical conditions. Nsurf represents the average number of molecules adsorbing in the scattering volume during the SERS experiment, whereas Nvol indicates the average number of molecules adsorbing in the scattering volume during the non-SERS experiment. Based on equation (1), the calculated EF1 value of PA@Ag-C12 is 3.06 × 10⁷.
SERS performance is strongly affected by the spacing between nanoparticles, with spacing ranging from 0 to 8 nanometers exhibiting strong coupling between electric fields [49]. It is observed that a strong coupling effect takes place when Ag NPs are placed close together at a distance, while two nanoparticles are separated by a large distance, the coupling effect diminishes. The adhesion of Ag NPs to both PA@Ag and PA@Ag-C12 substrates is investigated to simulate the electromagnetic enhancement effect of both substrates. The FDTD method was applied to calculate the electromagnetic field intensity distribution of the aforementioned two substrates, and the EF enhancement effect was further demonstrated [50]. As shown in figure 7, the normalized electric field value can be approximated and calculated by the following equation

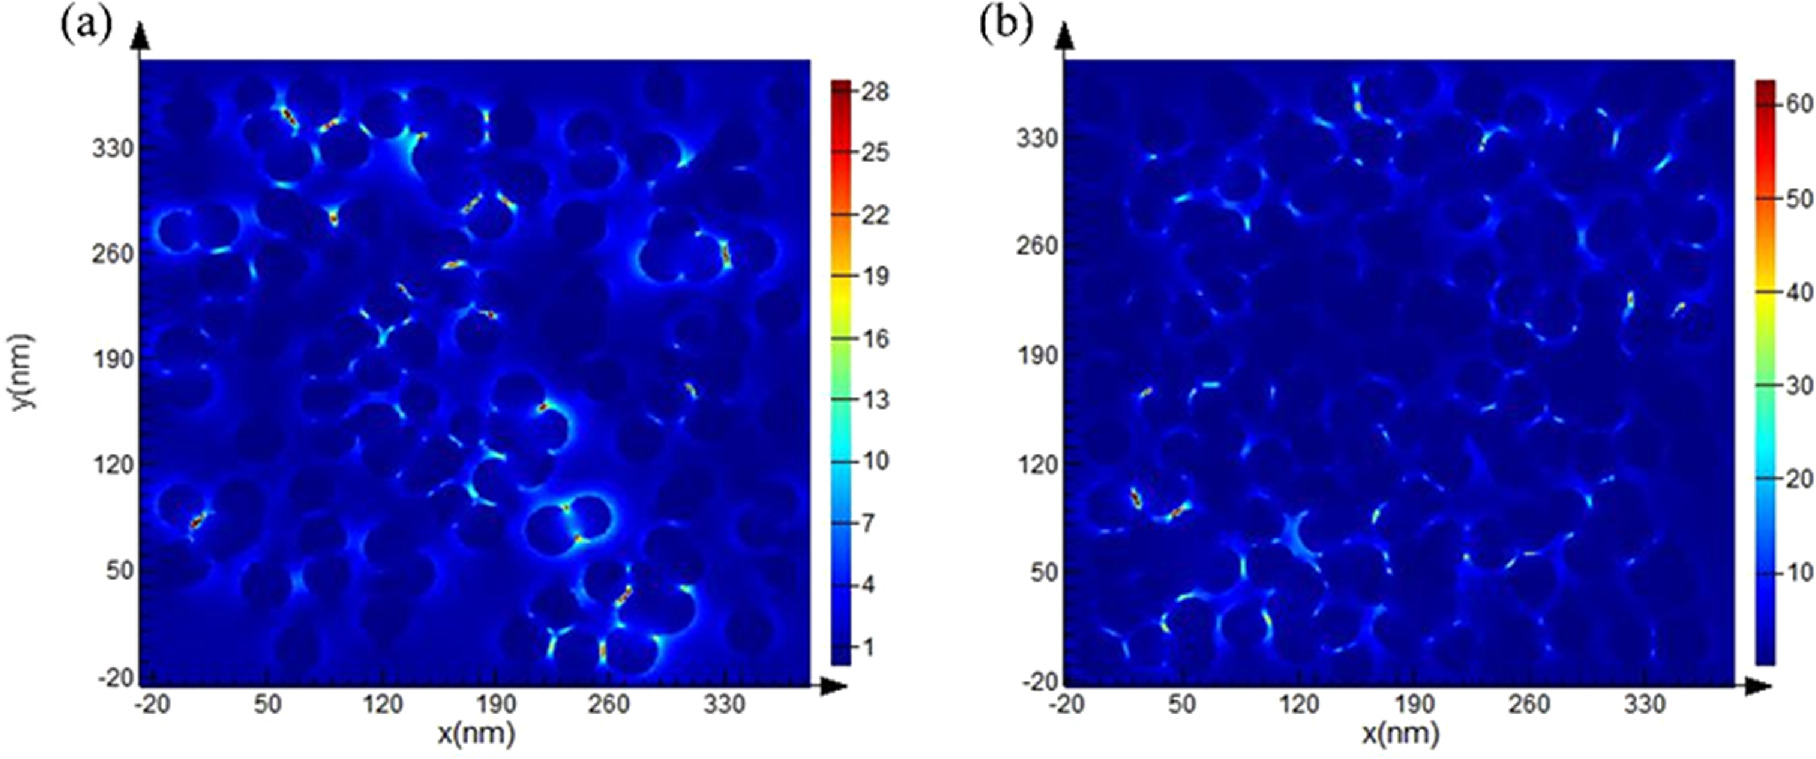
Figure 7. The spatial distributions of E-fields obtained by 3D FDTD simulation: (a) PA@Ag, and (b) 0.3 μM C12 functionalized PA@Ag-C12 substrate.
Download figure:
Standard image High-resolution imageThe results of the FDTD simulations indicate that the field strength ratio for the PA@Ag-C12 substrate is 62, which is substantially greater than that of PA@Ag. As a consequence, PA@Ag-C12 possesses more Ag NPs attached to the surface, thus generating smaller nano-gaps and a stronger electric field coupling. The calculation is described in the Supplementary Material. According to equation (2), the theoretical enhancement factor EF2 of PA@Ag-C12 is 1.54 × 10⁷.
Based on the comparison of the Practical enhancement factor (EF1) and theoretical enhancement factor (EF2), it can be inferred that the PA@Ag-C12 substrate exhibits excellent SERS performance, in part due to the electromagnetic enhancement. A possible explanation for the additional enhancement factor can be attributed to the fact that the long-chain C12 loading on the surface of Ag NPs has a certain enrichment effect on the targets in solution [51, 52].
There are three main factors to improve substrate SERS performance. (i) As a result of C12 surface functionalization on Ag NPs, part of the citrate is replaced, and the surface potential energy of Ag NPs is reduced. And modified Ag NPs turned out to be hydrophobic, thereby reducing the gap between the particles. The smaller particle gap also results in more effective electromagnetic 'hot spots', resulting in an enhanced SERS [53]. (ii) The experiments were conducted using the drop-coating deposition Raman technique. As part of this technique, tiny drops of analyte solution (usually several μl) are deposited on a special hydrophobic surface [37, 53]. This kind of surface allows the analyte to dry by means of the 'coffee ring effect', which is produced by the interplay of capillary flow, solvent evaporation, and contact line pinning [54]. The dispersed material is brought to the edge of the distillating droplet by the flow of a liquid, where it combines with the pre-concentrated analyte to create a ring [55, 56]. As a result, the detection sensitivity is significantly increased when the Raman spectrum is acquired from this ring as opposed to conventional Raman observations. Using this approach has the advantage of being able to detect analytes with small volumes and very low concentrations. (iii) C12 is self-assembled on the surface of Ag NPs and exhibits certain curved and highly ordered structures [57]. It has been found that the long-chain C12 can enhance the enrichment of specific molecules [58].
3.5. Reproducibility and stability analysis
When assessing SERS substrates, the repeatability and homogeneity of the SERS signal are essential metrics. SERS spectra of 10−8 M R6G were conducted on 30 randomly chosen locations of the same substrate in order to assess the reproducibility and homogeneity of the PA@Ag-C12 substrate. According to figure 8(a), the Raman intensity of each characteristic peak of R6G is quite consistent. Based on Raman signals from 30 random sites on the same substrate, the relative standard deviation (RSD) is 10.4% for the characteristic peak of 609 cm−1, thus indicating good reproducibility of the SERS substrate, as illustrated in figure 8(b). According to the preceding reference, the produced SERS substrate is repeatable if all signal intensity variances at different sites are contained within 20%.
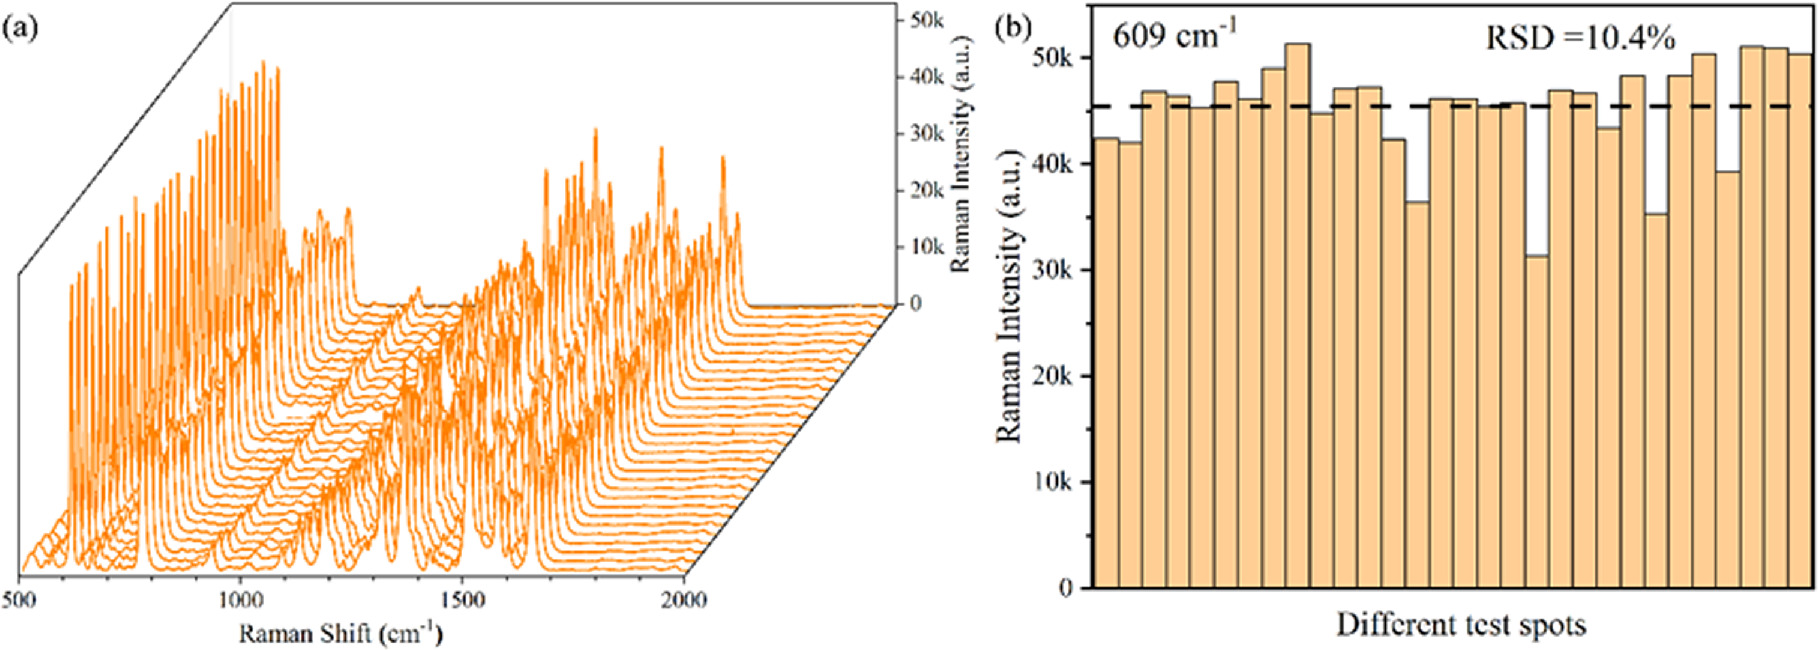
Figure 8. (a) SERS spectra of 10−8 M R6G obtained from the PA@Ag-C12 substrate, and (b) Raman intensity and calculated RSD at 30 random positions at 609 cm−1 (the dotted line represents the average intensity.
Download figure:
Standard image High-resolution imageIn addition, the test conditions remained the same and a random 200 × 200 μm2 region (400 sites) on the substrate was chosen for SRES measurement. Figure S6 displays the test findings. The computation indicates that the RSD of the PA@Ag-C12 substrate is less than 10%, which is in line with the findings of our earlier stability investigation.
The same batch of SERS substrate was manufactured for storage and subsequent detection in order to assess the stability of the PA@Ag-C12 substrate. The PA@Ag-C12 substrate's SESR performance was assessed over the course of four weeks of continuous room temperature storage. Several distinct spectrum generations of 10−8 M R6G are still readily visible after several weeks of storage, as illustrated in figure 9(a), and there have been very little alterations to the Raman signal. The Raman intensity at 609 cm−1 was measured in order to intuitively assess the variations of each distinctive peak, as seen in figure 9(b). The Raman intensity of the distinctive peak at 609 cm−1 dropped by 5.26% after three weeks of storage. The Raman signal remained comparatively steady after 4 weeks of storage, declining by just 6.18%, demonstrating that the substrate's stability is good.
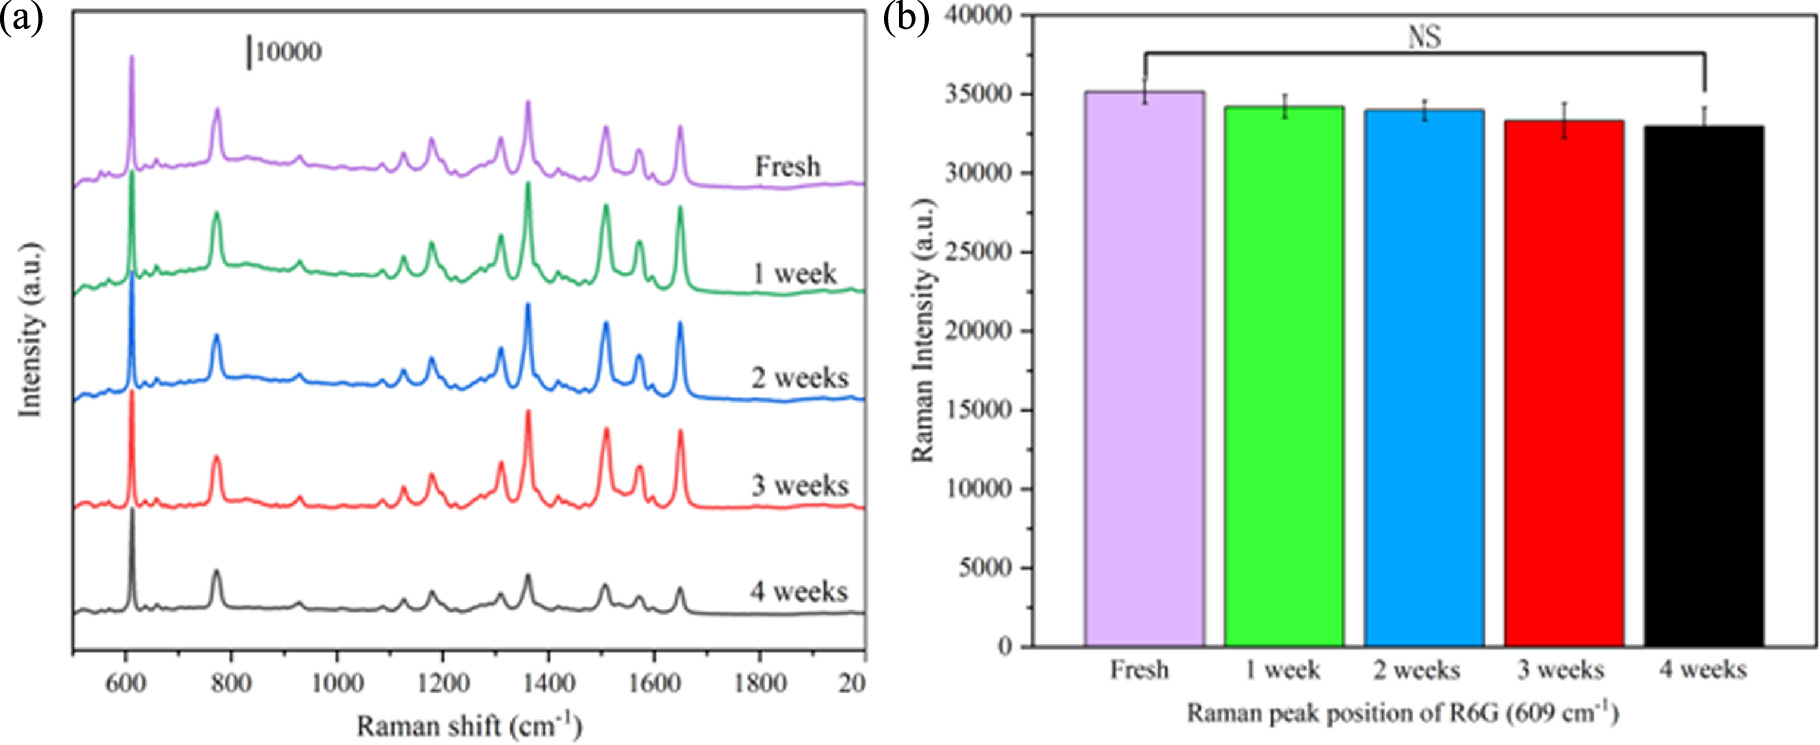
Figure 9. (a) SERS spectra of 10−8 M R6G obtained from PA@Ag-C12 substrate at different periods, and (b) corresponding Raman intensities of characteristic peaks at 609 cm−1, respectively. NS indicates no significant difference.
Download figure:
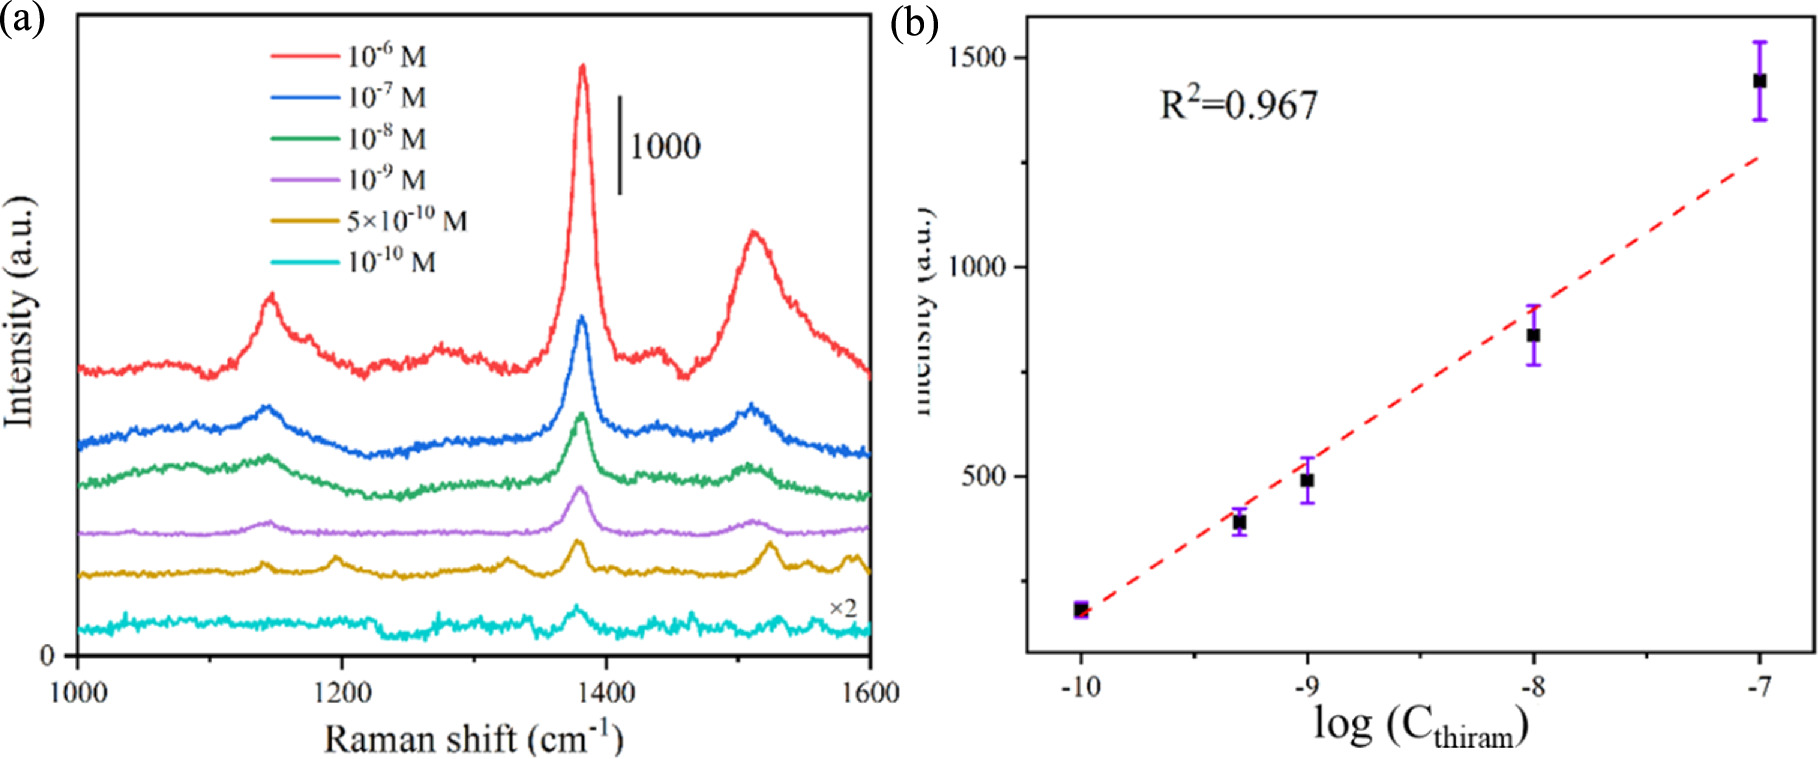
Standard image High-resolution imageEven though the PA@Ag-C12 substrate has demonstrated considerable high sensitivity, repeatability, and excellent reproducibility, it is still necessary to test the substrate against real contaminants to examine its suitability. The PA@Ag-C12 substrate surface was dripped with a 10 μl liquid sample and dried before Raman detection was conducted. After the substrate was completely dried, the Raman test was carried out. The typical peak of thiram is located at 1378 cm−1, as shown in figure 10(a) [59]. Figure 10(b) shows that the thiram concentration and the Raman signal at 1378 cm−1 have a linear relationship. The computed LOD is 5.88 × 10⁻¹¹ M (S/N = 3), and the correlation coefficient R2 is 0.967. The LOD of thiram with PA@Ag-C12 exhibits four times better than that with PA@Ag.
Figure 10. (a) Raman spectra of different thiram concentrations obtained from PA@Ag-C12 substrate, and (b) the calibration curve of the Raman signal intensity at 1378 cm−1 as a function of thiram concentration.
Download figure:
Standard image High-resolution image
Furthermore, as seen in figure S7, the PA@Ag-C12 substrate experiment examined the Raman spectra of a melamine solution at a concentration of 10−4–10−8 M to confirm the variety of substrate identification of several pesticides. Figure S7(a) shows that with the decrease in melamine concentration, the peak intensity of all characteristic peaks decreases. The Raman spectrum exhibits the distinctive signal of melamine even at concentrations of 10−8 M. The melamine content and the distinctive peak intensity at 676 cm−1 with the greatest Raman spectral intensity were fitted linearly, as figure S7(b) illustrates. The fitting findings show that there is a strong linear relationship between the distinctive peak intensity and the concentration of melamine solution (10−6–10−8 M), with a correlation coefficient of R2 = 0.977. With PA@Ag-C12 substrate, the estimated LOD for melamine is 6.56 × 10⁻⁹ M (S/N = 3).
As a result of the clear distinction between the distinctive peaks of melamine and thiram, which were found at 676 cm−1 and 1378 cm−1, respectively, it is anticipated that joint detection will be achieved in the future. The substrate was employed for Raman detection once it had completely dried. A mixed solution of 10−6 M was made by mixing thiram and melamine. The necessary amount of the mixed solution was then put onto the prepared PA@Ag-C12 membrane substrate. The typical peaks of melamine and thiram are shown in figure S8 at 676 cm−1 and 1378 cm−1, respectively. When compared to the Raman detection of a single pollutant, these two distinctive peaks are visible and their intensities barely fluctuate, suggesting that the PA@Ag-C12 substrate has promising application prospects. Pesticides have highly complicated Raman spectra, which means that there could be overlapping Raman peaks. This makes it challenging to detect numerous pesticides at once with accuracy. In order to surmount this obstacle and concurrently identify several pesticides, Furkan Sahin et al provide a machine learning assisted pesticide detection methodology for further analysis [60].
4. Conclusions
In this study, a series of hydrophobic PA@Ag-C12 substrates were fabricated by self-assembly. As a result of the surface functionalization of Ag NPs with C12, the surface electrical properties of Ag NPs were altered, thereby increasing the loading quantity of Ag NPs on the PA membrane. The modification of the PA@Ag two-dimensional substrate was optimized for C12 content and reaction time. PA@Ag-C12 substrate synthesized with 0.3 μM C12 exhibits the best SERS performance. The SERS performance of the PA@Ag-C12 substrate was investigated using probe dye R6G and pesticide contaminant thiram. The LOD for R6G has improved to 8.47 × 10⁻¹⁴ M with the optimal PA@Ag-C12 substrate as a SERS substrate, which represents a three-order of magnitude increase in sensitivity compared to unmodified PA@Ag substrate. The LOD of PA@Ag-C12 substrate on thiram was 5.88 × 10⁻¹¹ M. Thus, surface functionalized PA@Ag-C12 substrate has shown a substantial improvement in SERS performance. RSD of approximately 10.4% was observed when R6G was used as a probe molecule, demonstrating excellent uniformity of the substrate. According to the findings of FDTD simulations, the PA@Ag-C12 substrate had smaller gaps of Ag NPs and simultaneously obtained a stronger electromagnetic field strength. Ag NPs with hydrophobic properties could be loaded onto the PA membrane at a higher density, resulting in enhanced SERS performance of the PA@Ag-C12 substrate. The C12 causes particular molecules to concentrate on the substrate surface's hot spots, allowing for the very sensitive detection of the target analytes. In conclusion, there are a wide range of possible uses for hydrophobically modified PA@Ag-C12 substrates in biochemical analysis and environmental monitoring.
Data availability statement
All data that support the findings of this study are included within the article (and any supplementary files).
Data availability
The datasets generated and analyzed during the current study are available from the corresponding author upon reasonable request.
Funding statement
The authors wish to thank the Fundamental Research Funds for the Central Universities (No. 30922010603), the National Natural Science Foundation of China (21976038), the open fund of Information Materials and Intelligent Sensing Laboratory of Anhui Province (IMIS202109), State Key Laboratory of Applied Microbiology Southern China (SKLAM012-2021), and Anhui Provincial Key Laboratory of Environmental Pollution Control and Resource Reuse (2022EPC04) for the partial support of this work.
Conflict of interest
All authors confirm that there are no conflicts of interest with this article.
Ethics approval
Not applicable.
Supplementary data (3.3 MB DOCX)