

Abstract
Two-dimensional (2D) 1H molybdenum disulfide (1H-MoS2) is hard to be directly used in energy storage devices due to its inert basal plane and unfavorable 2D stacking. This work demonstrated how the basal plane of 1H MoS2 nanocrystals (NCs) can be activated to offer doubled specific capacitance by simple surface S depletions. Building on the expanded graphene with three-dimensional (3D) structures, as-prepared NCs were chemically grafted on the graphene surface to deliver stable energy storage and high capacitance, which overcame above challenges of 1H-MoS2. Aside from the mostly focused metastable phase, this work confirmed that the stable 1H Mo–S material is also promising in energy storage applications.
Export citation and abstract BibTeX RIS
1. Introduction
The supercapacitors (SC) is a crucial energy storage technique, which attracted significant interests because of their high power density, long cycle life, and fast charge/discharge features [1, 2]. It is known that the electrode material of SC should possess high electrical conductivity and high accessible active surface area. In this regard, two-dimensional (2D) molybdenum disulfide (MoS2) showed great potentials owing to its high carrier mobility, high thermal/chemical stability, high surface to volume ratio and fast 2D capacitive behaviors [3–8]. The short mass transport distance and fast electron transport of the 2D surface make it comparable to carbon nanotubes and metal oxides in delivering either the fast energy storage or the high capacitance. However, practical applications of the most stable 1H MoS2 are still limited by their inert basal planar. In the stacked 2D 1H MoS2, the poor electron hopping efficiency further reduces their energy storage performance [9].
To improve the surface activity of the 2D 1H MoS2, several strategies have been proposed, including the formation of crystal boundary and heterostructure and the chemical doping on the surface [7, 10]. The former strategy still cannot meet practical demands because of the limited number of active sites, while the later one required complex and expensive techniques to finely control the inert 2D surface. Recent investigations suggested that the inert basal plane of 2D MoS2 can be activated by forming the metastable 1T and 1T' phase [10–13]. Although stable and excellent electrochemical applications of these metastable phases were demonstrated on electrochemical hydrogen evolution reactions, the unstable nature of the metastable phase should be well resolved, in particular when it is used in anode electrochemical reactions and for long-term storages [10].
Tackling these challenges may need significant efforts. Nevertheless, recent developments on 1H MoS2 nanocrystals (NCs) may provide an alternative solution to improving their surface activity, and sustaining the chemical stability in the meantime [14, 15]. Unlike traditional 2D MoS2 sheets, monolayered 1H MoS2 NCs have much enhanced metallicity and edge ratios [14, 15]. By incorporating S vacancies, the density of state (DOS) of NCs at near the Fermi level can be further enhanced, providing the increased binding energy to electrolyte ions [7, 10, 14, 15]. Besides, the S vacancy is usually accompanied with the structural re-arrangement, which could improve the thermodynamic stability of the material [16]. All these clues implied that S-depleted 1H Mo–S NCs may have much better energy storage performance compared to traditional 2D 1H monolayers. Nevertheless, demonstrations of such S-depleted Mo–S NCs in SCs are rarely reported due to likely technical challenges in electrode fabrications. Specially, Mo–S NCs are typically stably dispersed in solvents such as ethanol and water. The layer stacking and agglomeration of NCs are inevitable when they are collected as the powder form for electrochemical applications. These NCs also cannot be well deposited on the 3D metal frameworks like those demonstrated elsewhere [17, 18]. Direct combination of the NCs and other materials with techniques such as microwave-assisted synthesis may also destroy the 2D surface to reduce the activity [19–24]. Therefore, it is challenge but meaningful to investigate the activation of these NCs and explore a simplified approach for preparing the electrode materials to overcome above challenges.
In this study, we examined the electrochemical properties of monolayered MoS2 NCs. By introducing S vacancies, we were able to activate the inert basal plane, which effectively doubled the specific capacitance. To solve the stacking problem of 2D phases, a relatively stable hybrid structure of 2D NCs and 3D expanded graphene (EG) was designed and fabricated by electrostatic incorporation (Scheme
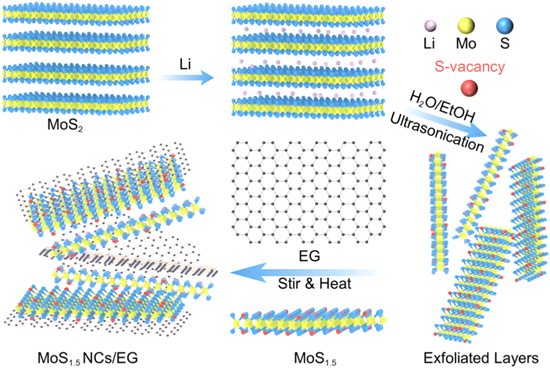
Scheme 1. Hybrid structure of MoS1.5 NCs and graphene.
Download figure:
Standard image High-resolution image2. Experimental section
2.1. Fabrication of the EG
The EG was prepared following our previously reported 'fast thermal expansion' method [25]. Briefly, graphene oxide (GO) suspension was prepared by a modified Hummers method [26–28]. 12 ml of the suspension was dropped into a glass dish covered with a microporous nitrocellulose filtration membrane, and dried to form the GO film about 100 μm thick, which was then cut into small pieces. GO fragments were thrown into a hot quartz beaker, where they instantly burned and expanded. The unexpanded graphene was removed by simple ultrasonic treatment with ethanol solvent. The activated graphene was collected from the suspension and dried in oven.
2.2. Fabrication of MoS2 and MoS1.5 NCs
Monolayered MoS2 and MoS1.5 NCs were fabricated with our previously developed 'K-intercalated unzipping' technique [29–32]. Briefly, ∼0.6 g K and ∼1 g MoS2 powders were mixed in a sealed Pyrex tube with a vacuum connection. It was then heated to 190 °C and kept under vacuum condition for 4 h. Once the tube was cooled to room temperature, the vacuum pump was turned off and N2 was introduced into the tube. In the meantime, 100 ml ethanol and deionized water with volume ratio of 1:1 were slowly added to the tube under ultrasonic stimulation (480 W, 100% power). The exfoliated monolayered MoS2 NCs were centrifuged from the residual MoS2 flakes. Fresh NCs suspension (faint yellow) was poured through the strong acid exchange resin column at least three times to create S vacancies until the pH value of the suspension <7 (K+ was removed), while the suspension changed to be dark brown. Preparation of MoS2 NCs was slightly different. The aged NCs suspension (aged for >3 months at room temperature) was poured and quickly passed through the weakly acid cation exchange resin column for several times (pH value of the final suspension <7). In this case, no evident color change was observed in the suspension. The above treatment effectively removed the K+ from the suspension and the S-depletion was significantly alleviated, which was also confirmed by XPS characterizations (figure S1). During the electrode fabrication, direct weighing the NCs was highly difficult. To determine the quantity of NCs in the working electrodes, we dried half NCs suspension for weighing and calculating. The concentration of NCs in the other half suspension was then determined, which was used for the fabrication of working electrodes and composites.
2.3. Fabrication of the MoS1.5 NCs/EG
5, 10 and 15 ml of MoS1.5 NCs solution and 80 mg of EG powder were respectively mixed in a glass bottle and stirred for 12 h, while 5 mg of thiourea was added to promote the adsorption of MoS1.5 NCs on the graphene surface. The solvent was removed by centrifugation to obtain a mixture which was completely dried in a vacuum drying oven, then annealed at 300 °C for 2 h in an Ar-filled tube furnace. The obtained materials were denoted as MoS1.5 NCs/EG-1, MoS1.5 NCs/EG-2 and MoS1.5 NCs/EG-3, respectively.
2.4. Characterizations
X-ray diffraction was performed with a X-PertPro x-ray diffractometer (Cu Kα, voltage 40 kV, current 40 mA). Scanning electron microscopy (SEM) was performed using a Nova 600 Nano SEM scanning electron microscope. Elemental composition information was obtained by x-ray energy spectrometer (INCA IE 350 PentaFET X-3EDS) attached to the SEM. Transmission electron microscopy (TEM) images were characterized with JEOL-2010F. Atomic force microscopy (AFM) was performed on a VEECO Dimension 3100 system. Raman spectra were recorded at 532 nm using a Horiba LabRAM HR Evolution. During Raman characterizations, the appropriate laser irradiation intensity was applied to avoid the overheating of the material. X-ray photoelectron spectroscopy (XPS) was performed on an AXISSUPRA+ using a single Al-Ka source. The C 1s binding energy was calibrated to 284.6 eV.
2.5. Electrochemical measurements
Electrochemical measurements of NCs were carried out with the CHI 660E electrochemical workstation using a three-electrode technique (counter electrode: graphite rod, reference electrode: Ag/AgCl, saturated KCl salt bridge). NCs suspension (1–30 μl) was drop-casted on the carbon paper (CP) and then air-dried as the working electrode. The CP was clamped by a holder that enabled contact with an underlying glassy carbon (GC) electrode. Cyclic voltammetry (CV) curves of the working electrode and bare CP were measured at a scanning rate of 5 mV s−1 in the neutral electrolyte (1.0 M LiCl, 1.0 M KCl and 1.0 M NaCl). For EG and MoS1.5 NCs/EG materials, the working electrode consisted of active material powder (∼1.5 mg) was embedded between nickel foam on both sides to allow the electrochemical measurement. Electrochemical impedance spectroscopy (EIS) was performed at the open circuit potential in the frequency range from 10 mHz to 1 MHz. CV curves were recorded at scan rates of 0.5, 1, 2, 5, 10 and 20 mV s−1. The cell device was assembled from MoS1.5 NCs/EG-2 with 1.0 M Na2SO4 electrolyte. CV curves were recorded at scan rates of 5, 10, 20, 40 and 60 mV s−1. Galvanostatic charge/discharge (GCD) measurements were performed at 0.1, 0.5, 1, 2 and 5 A g−1, respectively. The cyclic stabilities were measured using GCD curve at 0.5 A g−1 for over 5000 cycles. The calculation of the capacitance of the electrode and device was followed on the literatures [25].
3. Results and discussion
Upon the S-depletion, Mo–S NCs changed to be dark brown from faint yellow (figure 1(a) inset). According to the XPS survey (figure S1), the S/Mo ratios of NCs with and without S-depletion were confirmed as 1:2 and 1:1.5 respectively. Shown as figures 1(a), (b) are the AFM and TEM images of MoS1.5 NCs. The majority of (>99%) MoS1.5 NCs are monolayered with the AFM thickness of around 1 nm and lateral size of ∼12 nm (figure 1(a)). MoS2 NCs should have similar lateral size and thickness to MoS1.5 NCs. High-resolution TEM (HRTEM) suggested the highly defected lattice of the MoS1.5 NCs (figure 1(c)) which was fully different to the MoS2 NCs with ordered lattices (figure 1(d)). Given the electrical positivity of S-depleted Mo–S NCs and the electronegativity of EG, the electrostatic adsorption composite of these two components is highly likely to be achievable (will be further confirmed with Raman and XPS characterizations). On the basis of the above fabrications, different amounts of MoS1.5 NCs were loaded onto the EG via a simple stirring adsorption reaction to fabricate MoS1.5 NCs/EG-1, MoS1.5 NCs/EG-2 and MoS1.5 NCs/EG-3. Fabrications and basic characterizations of this EG were fully described in our previous report and will not be further extended here [25]. In principle, single-layer NCs should have no any x-ray diffraction peaks unless they are stacked to each other. XRD patterns of different samples suggested that the stacking of NCs (diffraction peak at ∼14.7°) happened in the case of MoS1.5 NCs/EG-2 and MoS1.5 NCs/EG-3, while the NCs in MoS1.5 NCs/EG-1 should be highly dispersed (figure 2(a)). The MoS1.5 NCs/EG-2 was then examined with the SEM as an example. In this sample, the highly curved and folded graphene structure was evident, where the Mo and S elements were uniformly dispersed on the graphene sheet (figure 2(b)). MoS1.5 NCs/EG-2 exhibited a substantial Brunauer–Emmett–Teller (BET) surface area of 282 m2 g−1, along with an abundant porous structure ranging from 2.5 to 8 nm, thereby providing abundant anchoring sites for MoS1.5 NCs (figure S3).
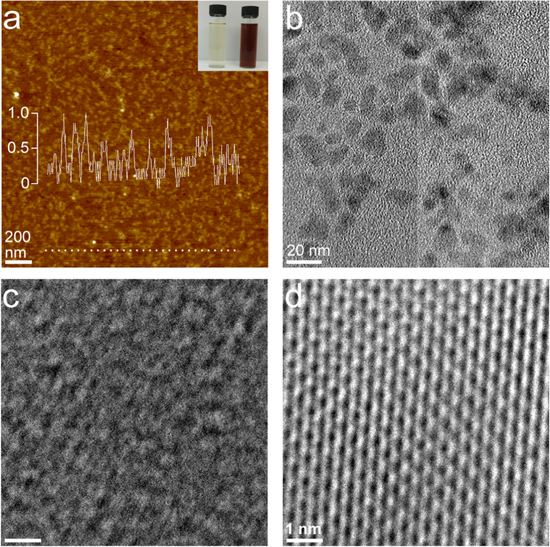
Figure 1. (a) AFM image of MoS1.5 NCs. Insets show the photograph of the MoS2 (left) and MoS1.5 suspensions (right), and the line profile of the selected particles (dash dot). (b)–(c) TEM images of MoS1.5 NCs. (d) The HRTEM image of MoS2 NCs.
Download figure:
Standard image High-resolution image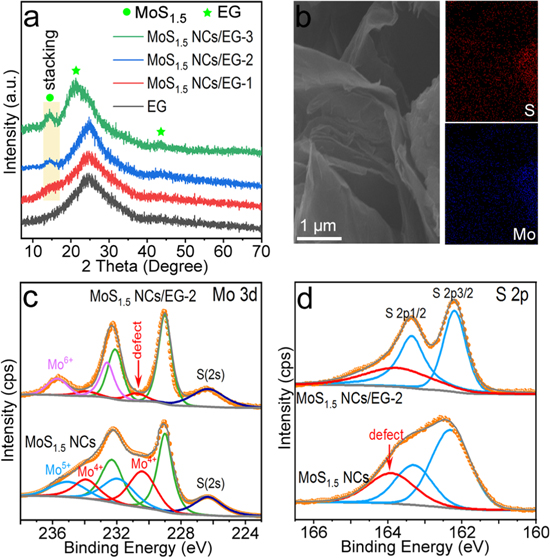
Figure 2. (a) XRD patterns of MoS1.5 NCs/EG-1, MoS1.5 NCs/EG-2, MoS1.5 NCs/EG-3 and EG. (b) SEM image and EDS mapping of MoS1.5 NCs/EG-2. (c), (d) Mo3d and S(2p) XPS of MoS1.5 NCs and MoS1.5 NCs/EG-2.
Download figure:
Standard image High-resolution imageRaman and XPS analyses further confirmed the successful hybrid combination of NCs and graphene. In the Raman spectrum, D and G modes of graphene in MoS1.5 NCs/EG-2 were recognized at ∼1350 and 1593 cm−1, respectively (figure S2). This G band position was blue-shifted from 1589 cm−1 of EG under identical measurement conditions (figure S2) because of the chemical interaction between Mo–S NCs and graphene sheets. Besides, Raman responses of the oxidized Mo phases were also found in MoS1.5 NCs/EG-2 at 658 (Mo–O–Mo), 818 (Mo=O) and 991 cm−1 (Mo–O–Mo) [33], which again demonstrated that the Mo–S NCs were chemical interacted with the graphene through the oxygen atom. The Mo 3d and S 2p XPS of MoS1.5 NCs and MoS1.5 NCs/EG-2 were compared in figures 2(c), (d). The MoS1.5 NCs showed Mo 3d3/2 (232.1 eV), Mo3d5/2 (229.0 eV) and S2s (226.3 eV) peaks corresponding to the 1H structure [10, 22, 23]. The defect associated Mo 3d3/2 and Mo 3d5/2 were found at 233.9 and 230.8 eV, respectively [34, 35]. Such defect peaks were weakened upon the combination of NCs with graphene, while the Mo5+ states in MoS1.5 NCs were transformed into a new strong Mo6+ oxidation state in MoS1.5 NCs/EG-2 [36, 37]. The S2p spectra of MoS1.5 NCs and MoS1.5 NCs/EG-2 both contained S 2p3/2(162.3 eV), S 2p1/2(163.5 eV) and S defect peaks (164.7 eV) at the same position, indicating that the S state was almost the same after the loading of NCs onto the EG. All above characterizations suggested that NCs have been successfully loaded on the graphene layer of EG through chemical interactions, which is crucial in sustaining a stable electrochemical process.
In electrochemical processes, the stacking of 1H MoS2 severely affected the current response duo to the low hopping efficiency between layers, and the capacitance measurement of 1H Mo–S NCs was highly difficult [38, 39]. To tackle this challenge, the pure NCs were loaded on the CP to alleviate the layer stacking. The capacitance of the working electrode against the loading ratio of NCs was then plotted. In principle, the capacitance and loading ratio of NCs should present a linear function if NCs are highly dispersed on the CP. Otherwise, the measured capacitance should be degenerated upon the NCs stacking. To eliminate the error introduced by the CP capacitance, the capacitance background of pure CP was measured in 1.0 M KCl, 1.0 M NaCl and 1.0 M LiCl electrolytes (figures S4 and S5) initially. Different amounts of Mo–S NCs were drop casted onto the same CP for CV tests (figures S4 and S5) to obtain the capacitance of Mo–S NCs. According to the concentration of the suspension (MoS2 and MoS1.5 NCs were 0.76 mg ml−1 and 0.69 mg ml−1, respectively, see experimental section for the determination of the concentration), the mass of NCs loaded on the CP was calculated, and thus the relationship between the mass and capacitance of NCs can be exploited. When a small amount of Mo–S NCs (<7 μg) was loaded on the CP, the capacitance value of MoS1.5 and MoS2 NCs in all three electrolytes (1.0 M KCl, 1.0 M NaCl and 1.0 M LiCl) were both increased linearly with the loading ratio, while the mass specific capacitance remained unchanged (figures 3(a)–(c)). Since NCs gradually fell on the CP surface and became saturated, re-stacking of NCs was tended to form, thereby reduced electrical conductivity and hindered ion transport. Although the electrode capacitance was increased by adding more NCs on the CP, the value of the electrode capacitance against the mass of NCs was actually decreased (the labeled yellow zone in figures 3(a)–(c)). A further increase in NCs loading significantly reduced the electrode capacitance (labeled as blue zone in figures 3(a)–(c)). In this case, NCs should have been severely stacked to each other and the electrical resistance changed to be dominant to decide the capacitance. Therefore, the real specific capacitance of the NCs can only be measured with a low mass loading on the CP (e.g. 5 μg). On the basis of above measurements, the real specific capacitance of both MoS1.5 and MoS2 NCs were summarized in figure 3(d). MoS2 NCs have the specific capacitance of 88, 84 and 85 F g−1 at 5 mV s−1 in 1.0 M LiCl, 1.0 M NaCl and 1.0 M KCl, respectively. By contrast, the specific capacitance of MoS1.5 NCs were more than doubled compared to MoS2 NCs, which were 178, 206 and 215 F g−1 at 5 mV s−1 in above three electrolytes, respectively. Evidently, the S vacancy improved the capacitance of the 1H Mo–S NCs significantly.
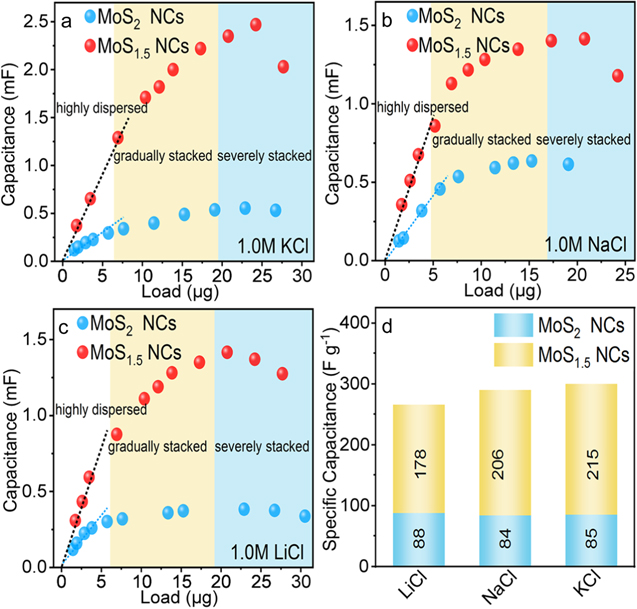
Figure 3. The load-capacitance curves of MoS2 and MoS1.5 NCs measured in (a) 1.0 M KCl, (b) 1.0 M NaCl and (c) 1.0 M LiCl electrolytes at the scan rate of 5 mV s−1. (d) The specific capacitance of MoS2 and MoS1.5 NCs in different neutral electrolytes at the scan rate of 5 mV s−1.
Download figure:
Standard image High-resolution imageThe serious degradation of capacitor performance and the mass limitation of NCs encouraged us to fabricate a 3D structure combined with 2D NCs to alleviate the stacking problem. Although XRD patterns showed that there was still a slight stacking of NCs in MoS1.5 NCs/EG composites (figure 2(a)), the loading capacity of NCs was increased by an order of magnitude through simple stirring adsorption reaction. The difference caused by mass loading in electrochemical impedance and reaction kinetics of EG, MoS1.5 NCs, and MoS1.5 NCs/EG-2 electrodes were investigated by EIS. As shown in figure 4(a), MoS1.5 NCs exhibited the highest Rct and Rs values due to the high charge transfer resistance. By contrast, EIS curves of EG and MoS1.5 NCs/EG-2 were more vertical at low frequencies, indicating near ideal supercapacitor behavior [40, 41]. The semicircle of MoS1.5 NCs/EG-2 at middle-high frequency region was also not obvious, and suggested the low Rct. Therefore, the hybrid structure of NCs and EG should have enhanced the conductivity and diffusion kinetics of electrolyte ions, giving promising energy storage applications.
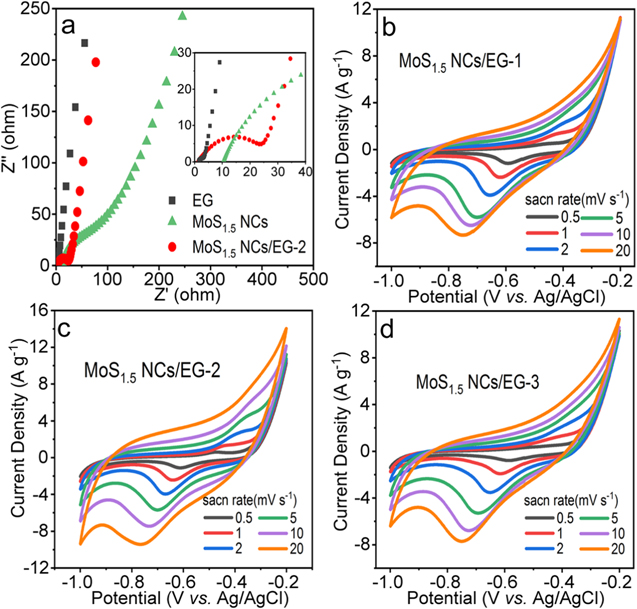
Figure 4. (a) Nyquist plots of EG, MoS1.5 NCs and MoS1.5 NCs/EG-2. (b)–(d) CV curves of MoS1.5 NCs/EG-1, MoS1.5 NCs/EG-2 and MoS1.5 NCs/EG-3 in 1.0 M LiCl electrolyte with different scan rates.
Download figure:
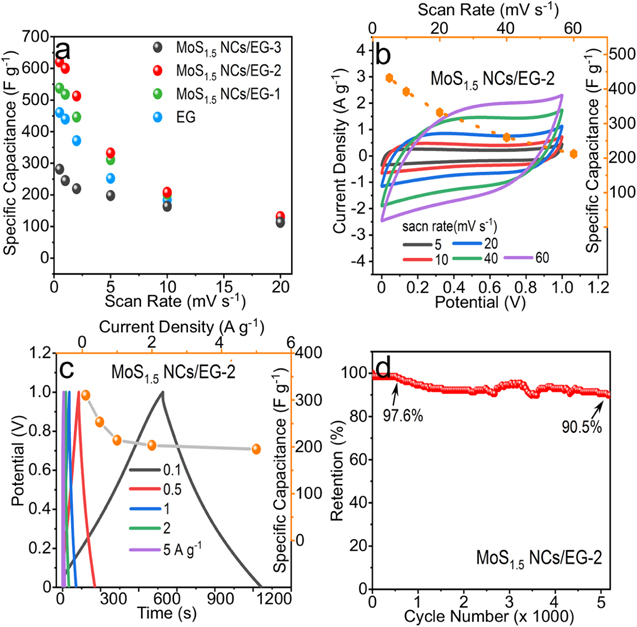
Standard image High-resolution imageThe energy storage performance of MoS1.5 NCs/EG-2 was further evaluated in 1.0 M LiCl electrolyte with three-electrode technique, and compared to other MoS1.5 NCs/EG samples and EG. As shown in figures 4(b)–(d), the CV curves of all MoS1.5 NCs/EG samples at different scanning rates have a pair of redox peaks at both ends of the potential, corresponding to the anodic peak at −0.4 V and the cathodic peak at −0.8 V. The formation of reduction and oxidation peaks may be associated to the formation of Liy MoSx and the oxidation of Mo atoms into MoSx , respectively. Both the reduction and oxidation peaks of MoS1.5 NCs/EG composites shifted toward both ends of the potential with the increase of scanning rates, while typical CV curves of electric double layer capacitors appeared on the EG (figures 4(b), S6), indicating that NCs had contributed to the electrode capacitance. Figure 5(a) compares specific capacitance graphene and MoS1.5 NCs/EG composites electrodes at different scanning rates. Among all composite samples, the MoS1.5 NCs/EG-2 showed the highest specific capacitance up to 620 F g−1 at the scan rate of 1 mV s−1, which can be attributed to the relative large loading of dispersed NCs on EG. Further increasing the loading of MoS1.5 NCs led to the re-stacking and agglomeration of NCs, which reduced the capacitance of electrode materials. All above information suggested that the proper combination of MoS1.5 and EG can readily solve the unfavorable stacking issue of NCs.
Figure 5. (a) Comparison of specific capacitance of EG, MoS1.5 NCs/EG-1, MoS1.5 NCs/EG-2 and MoS1.5 NCs/EG-3 with different scan rates. (b) CV curves and associated specific capacity plot of the cell. (c) GCD curves and specific capacity plots. (d) Cyclic test of the cell at the current density of 0.5 A g−1 with CP method. In (b)–(d), the cell device was assembled from MoS1.5 NCs/EG-2 with 1.0 M Na2SO4 electrolyte.
Download figure:
Standard image High-resolution image
With MoS1.5 NCs/EG-2, the symmetric coin cells (SCC) were further assembled to evaluate their potential applications in supercapacitor devices. In this case, the 1.0 M Na2SO4 electrolyte was instead used to avoid the polarization-like signal. Figure 5(b) shows the CV curve of the SCC at scan rates from 5 to 60 mV s−1 in 1.0 M Na2SO4 electrolyte. CV curves were quasi-rectangular without obvious redox peaks, and showed little change with increasing scan rate, indicating that the electric double layer energy storage was the main contributions of SCC [42, 43]. Figure 5(c) shows GCD curves of the charge and discharge voltages of the SCC in the range of 0–1 V. As the current density increased, the curve was also remained as a symmetrical triangle. The battery capacity peaked at 0.1 A g−1 as 314 F g−1 and remained at 62.9% even after increasing the current density to 5 A g−1, indicating good rate performance of the device. The energy density of the device reaches 8.8 Wh kg−1 at the power density of 250 W kg−1. It can still reach 6.7 Wh kg−1 even at the high power density of 2500 W kg−1. The energy density of MoS1.5 NCs/EG SSC (6.7 Wh kg−1) is higher compared to the MoS2 based SSC device in aqueous electrolytes such as MoS2/RGO/MoS2@Mo (6.22 Wh kg−1) [44], 1T-MoS2 (6 Wh kg−1) [45], MoS2/CB-C (5.2 Wh kg−1) [46] and 2H-MoS2 (4.5 Wh kg−1) [47]. Besides, the SCC device also has good stability under 0.5 A g−1, by showing ∼90.5% capacitance retention after 5000 charge/discharge cycles (figure 5(d)), which demonstrated well the robust structure of the hybrid MoS1.5 NCs and EG composite. However, the capacity degeneration was still not good enough compared to the pure carbon materials, which may induced by the decomposition of O-functionalized groups on the EG, the destroy of the chemical interaction between NCs and graphene, and the degeneration of the Mo–S NCs as we demonstrated elsewhere [8]. To improve the stability of the device, more techniques may need to be investigated and introduced in future (e.g. the use of solvothermal reaction to improve the chemical binding between materials).
In 2D materials, current research is focusing on the metastable phase structures and amorphous structures [10–13, 48–51]. Dangling states of these materials are highly improved from the most stable 2D phases, giving high surface chemical activity. The challenge here is how to stabilize these metastable structures when it is used for electrochemical processes [7, 10]. In this regard, the chemical doping on the surface of metastable materials may be considered, which was proved by recent reports, where the single metal atoms were introduced onto the 2D surface [52]. However, compared to the 1H phase, fabrication of the metastable counterparts are not well—developed [7, 10]. In industry, the 1H phase is more suited to be fabricated in large scale and stored for a long period. The little problem on the most stable 1H phase here is the accurate measurement on the electrochemical capacity, which was solved by using our method demonstrated above (e.g. drop-casted NCs onto the CP and plot the linear function of the capacitance against mass loading). As for the surface activity, the investigation here demonstrated that it can be feasibly activated via the formation of S vacancy. According to our previous investigations, the 2D size reduction of the 1H Mo–S gives the improved DOS at near the Fermi level, resulting multi-layer chemical adsorptions and fast 2D capacitive feature [8]. Investigations also suggested that the structure of 1H Mo–S with high ratio of S vacancies be stabilized with the structural re-organization [53]. All these features imply that the stable 1H MoS materials can be well used in energy storage devices, although more works are need to be introduced towards industrial implementations.
4. Conclusion
Monolayered MoS1.5 NCs were fabricated by 'K-intercalated unzipping' technique, followed by the surface S depletion with cation exchange resin. The surface S vacancy activated the chemical activity on the basal plane, which doubled the specific capacitance (∼200 F g−1 in 1.0 M LiCl, 1.0 M NaCl and 1.0 M KCl electrolytes) compared to the pure monolayered MoS2 NCs. For the real electrode application, MoS1.5 NCs was chemically bound on the surface of EG. This hybrid structure overcame challenges of the 2D stacking of NCs and offered high exposure of active sites, and therefore efficiently improved the capacitance (620 F g−1 in 1.0 M LiCl, measured at 1 mV s−1) performance compared to pure MoS1.5 NCs (178 F g−1) and EG (225 F g−1). With this hybrid electrode, a 310 F g−1 of the two-electrode device was also demonstrated at 0.1 A g−1 in 1.0 M Na2SO4, giving the maximum energy density of 6.7 Wh kg−1 at the power density of 2500 W kg−1 and high capacitance retention (∼90.2%) after 5000 charge/discharge cycles. Results discovered above are exciting, which confirmed that 1H MoS2 materials can be highly promising electrode materials for the application in SCs. Further improvement on the materials can be expected by combining other protocols such as chemical doping and construction of heterojunction structure of MoS2, improving the chemical interactions between materials and further prevention of the re-stacking issue of 2D layers.
Acknowledgments
This work was supported by 'Independent Innovation Projects of the Hubei Longzhong Laboratory' (2022ZZ-03). Liangxu Lin is also supported by the National Natural Science Foundation of China (52172228).
Data availability statement
All data that support the findings of this study are included within the article (and any supplementary files).
Author contributions
This work was supervised by L Lin and D Liu. L Zhong, Y Pi, Y Gao, Y He and L Wang performed experiments, collected data and drafted the manuscript under supervisions. All authors discussed the results and commented on the manuscript.
Declarations
There is no competing interest involved in this work.
Supplementary data (2 MB DOCX)