

Abstract
At present, there is a general contradiction between permeability and selectivity of reverse osmosis (RO) membranes for desalination; a membrane with higher water permeability will give a lower salt rejection or selectivity, and vice versa. In this work, single-layer nanoporous graphene is used as RO membrane to investigate the effects of pore shape to reduce this contradiction by molecular dynamics simulations. Two kinds of pores (round and rectangular pores) with different sizes are simulated. For round pore, although the water permeability increases with the increase of the pore size, the salt rejection rate drops rapidly. For rectangular pore, reasonable designed pore structure can achieve improved water permeability and high salt rejection of graphene membrane by keeping one-dimensional length (i.e. the width) of the pore less than the size of the hydrated ions and increasing the other dimensional length. The restriction of one dimension can prevent the passage of hydrated ions through the pore effectively. This 'one-dimensional restriction' provides a simple strategy for designing RO membrane with variable pore structures to obtain a better desalination performance.
Export citation and abstract BibTeX RIS
1. Introduction
The shortage of freshwater resources has become one of the most urgent challenge due to the population growth and industrial, agricultural needs [1, 2]. Most available water on the Earth cannot be used directly because of the salt content. Purifying seawater or other salt-water resources using reverse osmosis (RO) membranes is an important solution to address the water scarcity, and the RO membranes have entered commercial applications [3, 4]. For RO membranes, permeability and selectivity are two key properties to evaluate the performance of desalination. Currently, most commercial RO membranes are based on polymer materials, which needs large energy consumption and high capital investment [5]. At present, there is a general contradiction between permeability and selectivity of RO membranes for desalination; a membrane with higher water permeability will have a lower salt rejection or selectivity, and vice versa. Developing new membranes or technologies to improve the permeability while maintain excellent salt rejection is much desired [6].
In recent years, several ultrathin-film nanoporous membranes have drawn lots of attention for their potential as RO membranes, including nanoporous graphene and its derivatives [7–11], carbon nanotubes [12, 13], covalent-organic frameworks (COFs) [14, 15], metal-organic frameworks (MOFs) [16, 17], molybdenum disulphide [18], two-dimensional hydrocarbon polymers [19], etc It has been proven that these ultrathin-film membranes can provide high water permeability due to the ultra-thin thickness and the large slit between water molecules and the surface [20, 21], while maintain excellent salt rejection due to the nano pore structures on the membrane [7, 22]. Surwade et al created nanometer-size pores on single layer graphene using oxygen plasma etching process [9]. The salt rejection of the membranes was nearly 100% and the water flux reached 106 g m−2 s−1 at 40 °C. Gupta et al developed multiplayer nanoporous graphene oxide-based membranes using unique synthetic approaches and the permeance offered two orders of magnitude higher to the commercial ultrafiltration membranes with similar rejection [23]. Some physical mechanisms of salt rejection for the ultrathin-film nanoporous membranes have also been investigated, including size exclusion, dehydration barriers and electrostatic repulsion between salt ions and the pore [24]. Although the membranes of these materials have much better desalination performance than traditional RO membranes, these potential candidates still suffer the contradiction between permeability and salt rejection; a larger pore size offers an enhanced water permeability but a lower salt rejection.
Reasonable design of the membrane structure and the pore on it might reduce this contradiction between permeability and salt rejection, Lyu et al have attempted to design new materials, two-dimensional polyphenylene, as the RO membranes to break this contradiction based on the structure of the elliptical pores [19]. They also investigated regulating the permeability and selectivity of membranes by considering interior surface functionalization of aluminosilicate nanotubes [22]. Thomas et al found that carbon nanotube membrane with large permeation and high salt rejection could be obtained by reasonable adjustment of the pressure and pore size [25]. Liang et al investigated the desalination of triangle, square, pentagon, hexagon, and circle pores on graphene to provide guidance for the design of graphene membranes [26]. Yan et al focused on the effect of the layer number on desalination performance of the graphene membrane containing rectangular pores, and found that bilayer graphene membrane exhibited larger water flux and high salt rejection [10]. The graphene sheets containing two pores were also investigated to effect of the distance between two pores on the desalination performance [27–29]. In addition, the functional groups at the pore edge were investigated to improve the desalination performance [30, 31]. Despite some studies have focused on this aspect, how to reduce the contradiction by simple strategies, especially based on the existing membranes, is still a great challenge.
Single-layer nanoporous graphene has been predicted to have a high water permeability which is several orders of magnitude larger than conventional RO membranes [7, 9]. Its ability to prevent the salt passage depends critically on pore diameter. In this work, based on this membrane, we simulate a rectangular pore to investigate its effects and mechanism on the desalination performance, and attempt to seek a simply strategies to reduce the contradiction between water permeability and salt rejection. Specifically, the graphene membranes with rectangular pore are simulated to investigate their desalination performance by using classic molecular dynamics simulations. We simulate several rectangular pore sizes with increasing one-dimensional length but keeping the other dimensional length unchanged to investigate its desalination performance. The permeability and salt rejection are analyzed, and the permeation mechanisms of species are also explored. For comparison, the graphene membranes with the round pores are also simulated. The results of this study can provide a way toward the rational design of nanoporous membranes that are largely permeable and highly selective from the view of pore's geometry structure.
2. Calculation models and methods
2.1. Simulation models
The single layer graphene membrane with a rectangular pore is built as an ultrathin-film RO membrane (figure 1(a)). To create a pore in the prefect graphene, certain carbon atoms are removed from the perfect graphene surface, and the exposed atoms around the pore rim are hydrogenated. In order to simulate membrane models with different pore sizes, one dimension of the rectangular pore (Lx ) is kept constant, while the other dimension (Ly ) increase in different models (L1 ∼ L4). For comparison, model membranes (R1 ∼ R4) having round pores of different radii are also built (figure 1(b)). The specific parameters and the accessible areas of the pores in different models are shown in table 1. To analyze the desalination performance of the graphene membranes, seawater and pure water are placed on the feed side and the permeate side of the graphene membrane, respectively. Two additional rigid pistons (graphene sheets) are place on both sides of the system to modulate the transmembrane pressure. The system model is schematically shown in figure 1(c).

Figure 1. Structures of nanoporous graphene membranes with (a) a rectangular pore and (b) a round pore. (c) Schematic view of the simulation system.
Download figure:
Standard image High-resolution imageTable 1. Parameters of different pores on graphene membranes.
| Model | Rectangular pore (Lx = 3.5 Å) | Round pore | |||||||
|---|---|---|---|---|---|---|---|---|---|
| L1 | L2 | L3 | L4 | L5 | R1 | R2 | R3 | R4 | |
| Ly /Radius (Å) | 5.8 | 10.1 | 14.4 | 18.7 | 23.0 | 0.8 | 3.1 | 5.4 | 7.1 |
| Accessible pore area (Å2) | 20.5 | 35.6 | 50.7 | 65.9 | 81.0 | 1.8 | 30.2 | 91.2 | 156.7 |
For all the rectangular pore models, the Lx of pores is 3.5 Å. All the parameter values are calculated by subtracting the vdW radius (1.1 Å) of hydrogen atom from the length obtained by fitting the coordinate of hydrogen atoms around the pore rim during the simulations.
Periodic boundary conditions are applied in the three dimensions. The whole simulation model size is 34.4 × 34.1 × 120.0 Å3. The right and left piston are 50 Å and 25 Å away from the graphene membrane, respectively. The region between graphene membrane and the left piston is filled with water molecules. Water molecules and Na+/Cl− ions are placed in the region between graphene membrane and the right piston with the salinity of natural seawater, i.e. 0.559 M. The initial density of the liquid on both sides is set at 1.0 g cm−3. The thickness of vacuum layer is set to 45 Å in the z direction. The total number of atoms in the initial model is around 9250 (the atom number of each model is slightly different since the pore structure is different). Materials Studio software package is used to build the models mentioned above.
2.2. Dynamics simulations
All the molecular dynamics simulations are carried out using open-source LAMMPS package [32]. The rigid SPC/E model [33] is adopted to simulate water molecules using the SHAKE algorithm [34]. For hydrogen atoms around the pore rim and the attached carbon atoms, the AIRBO potential [35] is used. And the atomic partial charges are set at 0.115 (hydrogen atom) and −0.115 (carbon atom) [36], respectively. The charges of the other carbon atoms of graphene membrane and pistons are zero. 6–12 Lennard–Jones (L–J) potentials and Coulombic interactions using point charge models are used to describe the nonbonded interactions for the other type atoms. For the salt ions, the nonbonded interaction potentials developed by Joung et al [37] are adopted. A cutoff distance of 13 Å is used for the simulation. The Lorentz−Berthelot mixing rule is applied to estimate the cross pairwise L–J parameters between atoms. The particle–particle–particle–mesh algorithm with a precision of 10−4 is adopted to calculate the long-range Coulombic interactions. The simulation timestep is 0.5 fs. These parameters of force field has been used for similar simulations in previous works [7, 19, 22, 38]. The NVT ensemble and the Nose-Hoover thermostat [39, 40] are used for the MD simulations at 300 K. During the simulations, the carbon atoms of graphene membrane are fixed. The carbon atoms in both pistons are fixed in the x and y directions, and are set to move synchronously in the z direction. The nonbonded potential parameters are given in supplementary data (available online at stacks.iop.org/NANO/33/245705/mmedia).
For MD simulations of each model, first, a hydrostatic pressure of 1 atm is applied on both pistons, and an MD simulation is performed for 0.25 ns to relax the water molecules. Then, a higher transmembrane pressure [41–44] of 140 MPa is applied, and another MD simulation is run to simulate the liquid crossing the pores. It should be noted that a high transmembrane pressure (140 MPa) is adopted in this work to reduce thermal noise and obtain a steady flux in a finite simulation time, which is commonly used in similar simulations [7, 18, 45, 46]. In addition, many previous works have shown that desalination performance vary linearly with the transmembrane pressure [7, 18, 41]. Thus, the results for this work can be extrapolated to other differential pressure values. Four independent simulations are conducted for each model. OVITO software [47] is used to get the snapshots of models.
3. Results and discussion
3.1. Water permeability
Water molecules pass through the pore on the graphene membrane during the simulation. Numbers (#) of net water molecules filtered through the graphene membrane with round pore and rectangular pore are shown in figures 2(a) and (b). It shows that the number of waters filtered increases with the increase of the simulation time for all the models except the round pore in model R1. Theoretically, the diameter of a water molecule is 2.8 Å. It is difficult for water molecules to cross the pore with a smaller diameter. The round pore in model R1 is only 1.6 Å in diameter (table 1), leading to the water molecules staying in the feed side. For the other pores (both rectangular and round pores), the length of the minimum dimension is larger than 2.8 Å (the sizes of the pores are shown in table 1), thus water molecules can cross these membranes. In addition, the number of water molecules increases linearly with time for these models, which indicates that a steady water flow has been achieved. For the model L4, L5, R3 and R4, the number of water molecules reaches a plateau before the end of the simulation, due to the depletion of the water in the feed side. For a larger pore size, the time for the net water number reaching the plateau is shorter. And the time values to reach the plateau for rectangular and round pores are different as well. This suggests that the shape of pore has significant effects on the water flow rates.

Figure 2. Number of water molecules filtered by the graphene membranes with (a) rectangular pore and (b) round pore. (c) Water permeability and (d) water passing rate.
Download figure:
Standard image High-resolution imageTo analyze the performance of water passing through the pore, the water permeability of each membrane (#/nm2/ns/MPa) is calculated by dividing the slope of the water filtered by the membrane area (porosity is set to 10% [7]) and pressure (figure 2(c)). Obviously, the water permeability increases with the pore size for both rectangular and round pores. Comparing the water permeability of round and rectangular pores, the increasing speed of water permeability for the round pore is much larger than that for the rectangular pore.
Two factors are considered to contribute to the enhancement in the water permeability with larger pore area: (1) the available pore area for water permeation; (2) water passing rate through the pore (#/ns/Å2).
First, it is obvious that the available pore area affects the water permeability. Density maps of water molecules at the pore area (figure 3) are calculated to obtain the available area for water molecules. The aforementioned accessible pore area is determined geometrically, which indicates the area surrounded by hydrogen atoms around the pore rim. However, water molecules might not reach every part of this area during passing through pore, indicating that the accessible area is inaccurate to analyze the passage of the water. The available area represents the region where the water molecules can actually reach when they cross the pore. Figure 3 shows obviously that the available area increases with the pore size for both round and rectangular pores, and the shape of water density map is determined by the pore structure. It should be noted that the pores built in the models is not a perfect circle or rectangle, leading to the density map is not a perfect circular or rectangle area. Moreover, it can be seen the accessible area is larger than the available area in each model because there are no or few water molecules near the pore rim (nearby hydrogen atoms). This indicates that water molecules cannot reach the area near the pore edge due to the own volume of water molecule and its interaction with the edge of the pore. Table 2 shows the value of available pore area for each model and its percentage in accessible area. Compared with the accessible area (table 1), the available area is much smaller, which is consisted with the density maps. As the pore size increases, the percentage of available area becomes bigger for both round and rectangular pores. While the increase in the percentage of available area for the rectangular pore is small, and that for the round pore is much more obvious. For rectangular pore, the edge area (region near the hydrogen atoms of pore) always occupies a higher proportion since only one side length increases with the other side unchanged. For round pore, the pore area increases in two dimensions as the radius increases, leading to a decrease of the proportion of the edge region and an increase in the bulk region. This explains the difference of available areas between rectangular and round pores. Second, the water passing rate through the pore area (#/ns/Å2) also affects the water permeability, which is defined by dividing the water flow rate by the available pore area (NOT the membrane area) (figure 2(d)). The water passing rate through the rectangular pore almost keeps stable at different pore area (with a very slight increase), while that through round pore rises with the increase of the pore area.

Figure 3. Two-dimensional density map of water molecules in the pore area and the pore structure. The color in the color bar represents the density map of water molecules, and the colored area represents the available pore space; the blue dotted circle represents the accessible area surrounded by hydrogen atoms determined geometrically. The density map of water for R1 membrane is not calculated since no water passage events occurred in this membrane.
Download figure:
Standard image High-resolution imageTable 2. Available areas for all the models and their percentages in accessible areas.
| Model | L1 | L2 | L3 | L4 | L5 | R1 | R2 | R3 | R4 |
|---|---|---|---|---|---|---|---|---|---|
| Available area (Å2) | 9.05 | 17.35 | 25.74 | 34.06 | 42.04 | 0 | 17.98 | 66.79 | 123.84 |
| Percentage of available area (%) | 44.2 | 48.7 | 50.7 | 51.7 | 51.9 | 0 | 59.5 | 73.2 | 79.0 |
The percentage is calculated by dividing the available area by the accessible area.
Overall, with the increase of pore size, both available area and water passing rate through the pore increase for round pore. For rectangular pore, only the available area increases, while the water passing rate keeps nearly constant. Thus, the enhancement in water permeability for rectangular pore is smaller than that for round pore.
3.2. Salt rejection
As a RO membrane for seawater desalination, not only the water permeability, but also the performance of salt rejection should be considered. The salt rejection rate is shown in figure 4. The salt rejection rate is defined as R = (1 − N1/2/N0) × 100%, where N0 is the initial number of ions on the feed side and N1/2 represents the number of ions permeated through the membrane when a half of the feed water molecules are filtered. This method is commonly used in previous works [7, 17, 19, 22, 28, 48]. The salt rejection rate of the rectangular pore almost keeps constant with the increase of the pore area, staying above 90%. While the salt rejection rate of the round pore decreases rapidly with the pore area. The salt rejection of rectangular pore is slightly lower than that of the similar pore structure reported in the literature [19]. We think two reasons might contribute to the result: (1) The pressure we applied on the piston in this work, 140 MPa, is higher. Higher pressure also increases the probability of salt ions passing through the pore, leading a lower salt rejection rate [25]. (2) In this work, the hydrogen atoms at the edge of pore are not fixed during the molecular dynamics simulation, which make it easier for ions to pass through the pore. During the waters or hydrated ions passing through the pore under the pressure, the hydrogen atoms at the pore edge can move in both directions perpendicular and parallel to the graphene surface, although the distance that hydrogen atoms move is small due to the bond interaction of carbon atoms on membrane. For water molecules, the pore edge is not rigid, but 'soft' when water molecules collide with the edge. This helps water molecules or hydrated ions 'squeeze' through the pores area surrounded by hydrogen atoms under the external pressure. In addition, the movement of hydrogen atoms can increase the pore available area, which also contributes to the passage of water molecules. Figure 5 shows obviously that the hydrogen atoms at the edge of the pore deviate from the equilibrium positions when the Na+ ion are crossing the pore for R2 membrane
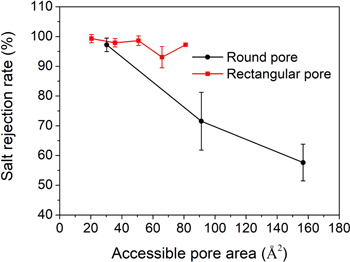
Figure 4. Salt rejection rate for graphene membranes with round and rectangular pores.
Download figure:
Standard image High-resolution image
Figure 5. (a) Top view and (b) front view of the pore for R2 membrane when the Na+ ion is crossing the pore. The other ion atoms, water molecules and two pistons in the model are hidden to make the figure clear.
Download figure:
Standard image High-resolution imageThe size of hydrated ions plays a critical role in the salt rejection; thus, the radial distribution function (RDF) is calculated to analyze the hydration layers of ions. Figure 6 gives RDF of oxygen and hydrogen atoms of water molecules centered on Na+ and Cl− ions, respectively. Obviously, some peaks occur in the RDF for both Na+ and Cl− ions, indicating that the hydration layers have formed near the salt ions. For Na+ ion (figure 6(a)), the distance of the first peak of oxygen atoms is smaller than the first peak of hydrogen atoms. This indicates that the oxygen atoms are closer than hydrogen atoms in the first hydration layers. This distribution results from the attraction between opposite charges of central ion (Na+) and the oxygen atom. For Cl− ion (figure 6(b)), the first peak of the hydrogen atoms is closer to the x-axis coordinate origin (i.e. distance away from the ion). This indicates that the hydrogen atoms are closer to center ion than oxygen atoms in the first hydration layer of Cl− ion, which results from the attraction of opposite charges of Cl− ions and hydrogen atoms of water molecules.
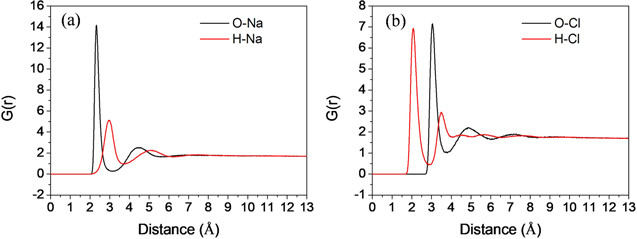
Figure 6. Radial distribution function (RDF) of oxygen and hydrogen atoms of water molecules centered on (a) Na+ and (b) Cl− ions, respectively. O–Na represents RDF of oxygen atoms centered at Na+ ion, and the others are in the same way.
Download figure:
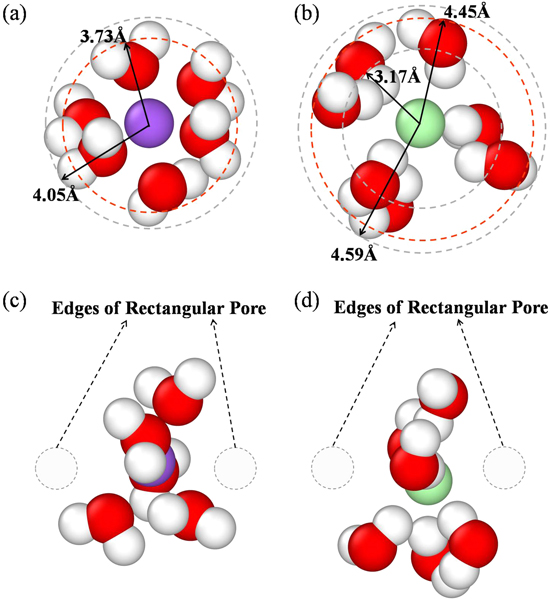
Standard image High-resolution imageTo be more intuitive, the snapshots of first hydration layers of salt ions are given in figures 7(a) and (b). The hydration layer is approximately spherical. For hydrated Na+ ion, the oxygen atom is close to the central ion, while the two hydrogen atoms are far away from the ion, which is consisted with the result of RDF for Na+ ion. Figure 6(a) shows that the first peak of hydrogen atoms is at 2.95 Å distance away from the Na+ ion. Considering the volume of hydrogen atom, the radius of the first hydration layer of Na+ should be 4.05 Å (the distance of the first peak of hydrogen atoms' RDF plus the vdW radius of hydrogen atom). As for the hydration layer of Cl− ion (figure 7(b)), one hydrogen atom of water molecule points to the Cl− ion forming hydrogen bonds with Cl− ions. The other hydrogen atom and the oxygen atom are far away from the center ion. Thus, the radius of the first hydration layer of Cl− should be equal to the distance of the second peak of hydrogen atoms' RDF (3.49 Å) plus hydrogen atom's vdW radius (1.1 Å), which is 4.59 Å. In figure 6, the other peaks of oxygen atom or hydrogen atom is much lower with the increase of distance away from the center ion, suggesting that the second hydration layer is much weaker, which is not considered in this work.
Figure 7. Snapshots of hydration layers of (a) Na+ and (b) Cl− ions in the bulk. Snapshots of hydration layer of (c) Na+ and (d) Cl− ions when ions are crossing the pore.
Download figure:
Standard image High-resolution image
Comparison between the pore structure parameters and the radius of the hydration layers of salt ions can explain the salt rejection of each model. For the round pore, in R1 or R2 models, the radius of the round pore is less than the radius of hydrated Na+ or Cl− ion. Therefore, the hydrated ions must overcome large barriers to cross these pores, leading to a high salt rejection rate for these two membranes. On the contrary, in R3 and R4 models, the size of the round pore gets larger than the size of hydrated ions. It is easier for ions passing across these pores, resulting in the decrease of the salt rejection. This is consisted with the experimental results. Surwade et al [9], Gupta et al [23] and O'Hern et al [49] have proved that the rejection rate of the graphene membrane drops significantly with the increase of the pore size.
For the rectangular pore, although the size of pore gets larger by increasing the length of one side (Ly ), the length of the other side (Lx ) keeps unchanged, remaining 3.5 Å. This value (Lx ) is much smaller than the diameter of the hydrated ions, limiting the passage of the hydrated ions through the rectangular pore. Although the hydrated ion is a three-dimensional structure, only one controllable dimension can restrict the passage of the salt ions. Figures 7(c) and (d) shows the snapshots of the hydrated Na+ and Cl− ions when they are crossing the rectangular pore. Compared with hydrated ion in the bulk (Figures 7(a) and (b)), the hydration layer is no longer a spherical and the molecule number in the hydration layer (i.e. the coordination number of the ion [13]) reduces during the passage of ions through the pore. In previous works, Corry et al [50], Lynden-Bell et al [51], and Murad et al [52] also showed similar change of hydration layer when the hydrated ions were crossing the pores, which is consistent with our results. It can be inferred that this deformation and dehydration of the hydration layer requires a large amount of energy penalty. This explains why a small one-dimensional length (Lx ) can restrict the passage of ions across the rectangular pore. This 'one-dimensional restriction' causes the salt rejection to keep stable as the pore area increases with increasing Ly length.
To verify 'one-dimensional restriction', we built an additional graphene membrane of rectangular pore with Lx length of 10.7 Å and Ly length of 12.3 Å. The salt rejection rate of this membrane is 66.7%, which is much lower than the rectangular pore with Lx of 3.5 Å. This is since that Lx of this pore (10.7 Å) is larger than the diameter of hydrated layer, and 'one-dimensional restriction' disappears. The ion is easier to pass through the graphene membrane.
Overall, it is achievable that the water permeability of a rectangular pore increases with a stable and high salt rejection rate by fixing one-dimensional length smaller than the size of the hydrated ions while increasing another dimension. It should be noted that many factors may improve the desalination performance and reduce the contradiction between permeability and selectivity, including physical sieving, electrostatic interaction, physio-adsorption, etc [23]. In this work, we focus on the geometry structure of the pore on graphene. The 'one-dimensional restriction' obtained in this work provides a simple idea of graphene membrane design that only one-dimensional size of the pore needs to be controlled reasonably to obtain high permeability and salt rejection at the same time. Based on the results of this work, it can be inferred the pores with the shape of long strip, curvilinear or spiral-line on the RO membrane should provide a better desalination performance.
4. Conclusions
In this work, nanoporous graphene membranes with round and rectangular pores are simulated to investigate the seawater desalination. The water permeability and salt rejection performance are analyzed in details. The results show that the water permeability of graphene membrane can increase effectively by increasing the accessible pore area for both round and rectangular pores, which results from the increase of the available pore area and water passing rate through the pore. For rectangular pore, a graphene membrane can have a high salt rejection rate and large pore area by keeping one-dimensional length of the pore less than the size of the hydrated ions and increasing the other dimensional length, since the length of one dimension is able to restrict the passage of hydrated ions through the pore. This 'one-dimensional restriction' provides ideas for designing RO membrane with variable pore structures to reduce the contradiction between permeability and selectivity.
Acknowledgments
We acknowledge Project ZR2019PA005 supported by Shandong Provincial Natural Science Foundation.
Data availability statement
All data that support the findings of this study are included within the article (and any supplementary files).