

Abstract
The MnO/C composites were obtained by co-precipitation method, which used Mn3O4 nanomaterials as precursors and dopamine solution after ultrasonic mixing and calcination under N2 atmosphere at different temperatures. By studying the difference of MnO/C nanomaterials formed at different temperatures, it was found that with the increase of calcination temperature, the materials appear obvious agglomeration. The optimal calcination temperature is 400 °C, and the resulting MnO/C is a uniformly dispersed slender nanowire structure. The specific capacitance of MnO/C nanowires can reach 356 F g−1 at 1 A g−1. In the meantime, the initial capacitance of MnO/C nanowires remains 106% after 5000 cycles. Moreover, the asymmetric supercapacitor was installed, which displays a tremendous energy density of 30.944 Wh kg−1 along with a high power density of 10 kW kg−1. The composite material reveals a promising prospect in the application of supercapacitors.
Export citation and abstract BibTeX RIS
1. Introduction
Energy storage has become a key technological challenge in the 21st century [1]. Nowadays, fossil fuels are becoming scarce due to their non-renewable characteristics and their large-scare use has been causing irreparable pollution to the environment [2]. With an intense increasing demand for new energy, and the development of wind, tidal and solar power is limited by its uncertainty. Supercapacitors (SCs), which have the advantages of rapid charging and discharging, quick reaching the peak power, long cycling life and less pollution to the environment, become indispensable candidate in the future energy storage [3–7]. Whereas, the low energy density is a major drawback of SCs that limits their practical applications. To develop SCs, it is necessary to study electrode materials in depth. Up to now, people have been devoting to the research of electrode materials with excellent electrochemical performance for supercapacitors, including carbon materials [8–11], transition metal oxides [12–17] and conducting polymers [18, 19].
Compared that to the other two, transition metal oxides which have great edge in many aspects such as affluent redox sites, high content in nature, low cost and the like [20]. Metal oxides (ZnO, Co3O4, RuO2, etc) have made great achievements in the research of supercapacitors because of their high specific capacity, low resistance and high power density. For example, ZnO is a promising new supercapacitor material with good electrochemical reversibility through experiments in recent years [21–24]. However, the limited potential window (less than 0.6V) becomes the main factor affecting the energy density, and manganese oxides (MnO [25, 26], MnO2 [25], Mn3O4 etc) become an attractive electrode material for SCs because their can provide a higher potential window [26, 27]. But the direct use of pure manganese oxide as an electrode material is strictly limited by its inherent high resistance, low conductivity [28] and serious agglomeration and drastic volume change during charging/discharging process cause a sharp attenuation of capacitance. These is similar to most transition metal oxides. To solve these problems, micron or nano-sized manganese oxides are compounded with highly conductive carbon, which not only buffer volume expansion caused by charge and discharge, but also improve ion mobility and conductivity [29–31]. So far, various manganese oxides and carbon composite materials have been developed to enhance the electrochemical performance of SCs. For example, Huang and his colleagues have developed MnO2 nanoparticles grown on carbon nanotubes by direct redox, which reveal 247.9 F g−1 and no significant decrease after cycles [32]. Sun et al made use of an in situ reduction method to synthesis MnO/C nanorods with core–shell structure show better electrochemical performance than MnO [33]. Likewise, F.L. Gong et al synthesized the hierarchical C@Mn2O3 microspheres display a enormous specific capacitance of 383.87 F g−1 at 0.5 A g−1 and outstanding cycling stability (90.47% after 5000 cycles) [34]. These particular nanostructures can act as buffers to delay volume changes and provide fast ion and electron diffusion paths, thus improving the electrochemical performance of SCs. Among many oxide composite structures, nanowires have attracted entensive attention due to their unique properties [35, 36].
From this point of view, we developed a MnO/C nanowires via a simple and effective synthetic method. Firstly, according to the previous report of our group, Mn3O4 was synthesized by two-step hydrothermal method. Then, dopamine-derived carbon with MnO nanowires composites (MnO/C) were designed by heat treatment in N2 atmosphere by co-precipitation method. Through a series of electrochemical teats (CV, GCD, EIS, etc), MnO/C nanowires electrode demonstrated a good performance. The capacitance of MnO/C nanowires at 1 A g−1 is about 356 F g−1, and the specific capacitance of MnO/C nanowires is 258.2 F g−1 at 20 A g−1, which remains 73% of that at 1 A g−1. The composite exhibits remarkable cycling stability. After cycling 5000 times the capacitance not only didn't drop but increased. Moreover, the asymmetric supercapacitor (ASC) in Na2SO4 electrolyte (1 M) was assembled with the activated carbon (AC) as cathode, which also displays a tremendous energy density of 30.944 Wh kg−1 at 500 W kg−1, and the highest power density of 10 kW kg−1 at 20.278 Wh kg−1. The MnO/C//AC-ASC also shows excellent cycling stability after cycling for 5000 time. Many preparation methods of Mny Ox nanowires are more intricate, which requires plentiful labor force and time. And the organic reagents used pollute the environment greatly. However, the method used in this paper has the advantages of low cost, easy operation, low environmental impact of the inorganic reagent used and excellent performance.
2. Experimental section
2.1. Materials
Tris-HCl buffer solution (10 mM; PH = 8.5) was purchased from Xiamen Haibiao Technology Co., Ltd; MnCl2·4H2O, Na2SiO3·9H2O, m-phthalic acid, NaOH, dopamine, Na2SO4, acetylene black and polyvinylidene fluoride were obtained from Sinopharm Chemical Reagent Co., Ltd,. and all chemical reagents were directly used after receiving.
2.2. Synthesis of Mn3O4
Mn3O4 was synthesized by a simple method published [37, 38]. The MnCl2·4H2O and Na2SiO3·9H2O were prepared with a molar ratio of 1:1. The prepared MnCl2·4H2O (20 ml, 1 M) aqueous solution was slowly added drop by drop into the Na2SiO3·9H2O (50 ml, 0.4 M) aqueous solution, and 0.5 g m phthalic acid was added. After stirring for 3 h, the mixed solution was puted to a Teflflon-lined (100 ml capacity) and heated at 120 °C for 3 h. After cooling, the precipitates were centrifuged several times and then dried.
Then, 1 g of the above products were accurately weighed and added into 16 M NaOH solution. After stirring, remove to a 100 ml Teflflon-lined, and maintain at 240 °C for 5 h. Mn3O4 nanomaterials were obtained by cooling, centrifugation and drying.
2.3. Synthesis of MnO/C nanowire
The preparation of MnO/C nanowires consists of two steps: co-precipitation and carbonization. Firstly, an aqueous solution of dopamine was prepared, in which dopamine (20 mg) was dissolved in 50 ml Tris-HCl solution. Then, 100 mg of the as-prepared Mn3O4 powder was added in the aqueous solution of dopamine while ultrasonic dispersion and stirring for 0.5 h. After centrifugation in deionized water, the black precipitate was dried at 80 °C.
Secondly, the obtained black powder was placed into a porcelain boat and carbonized at 400 °C, 500 °C, 600 °C and 700 °C, respectively for 6 h (heat rate 5 °C min−1) under N2 to get the MnO/C hybrid, then denoted as the MnO/C-400, -500, -600 and -700, respectively. The performance of the samples at diverse carbonization temperatures were investigated.
2.4. Materials characterization
The crystallinity of the samples were investigated using a x-ray powder diffraction (XRD, X-Pert PRO MPD) via Cu Kα ( = 1.5406 Å, 40 kV, 40 mA) radiation. X-ray photoelectron spectroscopy (XPS, ESCALAB 250Xi) with a monochromatic Al Kα x-ray source was conducted to analyze the element composition,valence state changes and relative content. The composition of the sample elements and surface topography were observed scanning electron microscope (SEM, Gemini 500, Germany) and transmission electron microscopy (TEM, JEM-1400flash, Japan). The distribution of elements in nanowires is studied by x-ray energy dispersive detector (EDX). The Brunauer–Emmett–Teller (BET) testing was measured with a Micromeritics ASAP 2020 instrument at −196 °C. Prior to the measurement, the sample was pretreated at 120 °C for 3 h under vacuum condition, and the BET model was used to calculate the specific surfaces area.
2.5. Electrochemical measurements
A three-electrode and a two-electrode system were setted up to measure the electrochemical performance of the sample with a CHI660E electrochemical workstation as test instrument, both of which were implemented in an electrolyte of Na2SO4 (1 M) solution. The reference electrode and the counter electrode are saturated calomel electrode and platinum plate, respectively. The working electrode is loaded with the platinum grid electrode of manganese oxide sample. An ASC composed of a platinum net containing MnO/C and AC. All the working electrode is made as follows: MnO/C, acetylene black and polyvinylidene fluoride were fully mixed according to the mass ratio of 8:1:1 in N-methyl-2-pyrrolidone to obtain a uniform slurry [39, 40]. Then, the mixture was smeared on the platinum net electrode and dried overnight. The mass of the platinum net load is about 2 mg. The cyclic voltammetry (CV), galvanostatic charge–discharge (GCD) and electrochemical impedance spectroscopy (EIS) measurements are performed to investigate the electrochemical properties of the manganese oxide sample. From GCD the specific capacitance of the material can be calculated according to the formula (1)

The energy density (E) and power density (P) of the two-electrode system can be obtained by formulas (2, 3) [41].


where C, m ΔV, I, Δt, E and P denote the specific capacitance (F g−1), the mass of manganese oxide sample loaded on the working electrode (g), the voltage window (V), the discharing current (A), the discharge time (s), the energy density (Wh kg−1) and power density (W kg−1), respectively.
3. Results and discussion
The XRD patterns of MnO/C at different temperatures and Mn3O4 in figure 1. The XRD peaks are consistent with previous report [42]. When the diffraction peaks of 2θ are 34.958°, 40.585° and 58.744° ascribed to the (111), (200) and (220) facets of MnO (JGCDDS standard card 78-0424). Moreover, the weak diffraction peaks between 2θ = 20° and 2θ = 30° are attributed to the carbonization of dopamine, which proves that amorphous carbon is produced. Compare to the XRD patterns at different temperatures, we found that with the increase of temperature, the peak became more and more sharp, the half-peak width gradually decreased, and the crystallinity gradually enhanced. When the temperature is only 400 °C, the crystallinity of the product is not very high, and the diffraction peak intensity of the whole MnO/C material is relatively weak. When the temperature increases to 700 °C, a sharp peak has been formed indicating that the crystallinity of the product is very high. The product has undergone a qualitative change after coating with dopamine and calcining at high temperature, not only amorphous carbon is generated, but also manganese oxide has changed from the original Mn3O4 to MnO. The composition and valence changes of the complex can be analyzed from the XPS. Figure 2(a) is the XPS spectrum of the sample, revealing the chemical composition of MnO/C complex, which clearly indicates that the existence of Mn, O, C and N elements in sample. As presented in figure 2(b), the C 1s spectrum shows two peaks, located at 284.8 eV and 288.3 eV, which correspond to SP2 C–C [43, 44] and C–O [45], respectively. Figure 2(c) depicts the O 1s spectrum, in which the three peaks (532, 530.6, and 529.9 eV) can be attributed to Mn–O, C–O, and H–O bonds, respectively [46]. From figure 2(d), the fitted Mn 2p peaks at 641.9 eV and 653.3 eV with Mn 2p3/2 and Mn 2p1/2 peaks, which indicated that Mn has a valence of +2 [47]. The oxidation state can be further determined by the peak width. In figure 2(e), the splitting width of Mn 3s can be obtained by the formula as 6.2 eV [48]. It can be calculated that Mn element is positive divalent. Therefore, the product is further determined as MnO by XPS. Because the precursor is calcined in N2 atmosphere. There is N doping in the product, which can enhance the active site of the sample, make it easier for the sample to gain and lose electrons to display pseudocapacitance characteristics, improve the capacitance, and also help to enhance the conductivity of the sample. The specific surface area and pore size distribution of the material were measured by BET nitrogen adsorption method. The adsorption/desorption curve of MnO/C-400 is shown in figure 2(f), and the body increases positively at low pressure, confirming the existence of mesoporous structure of the material. The specific surface area of MnO/C-400 is up to 48.9628 m2 g−1. Figure 2(g) shows the pore size distribution, which is calculated and drawn by the Barrett–Joyner–Halenda method, indicating that the pore size is 6.3429 nm and the pore volume is 0.250 767 cm3 g−1. The porous structure is an ideal electrochemical capacitor material for ion transport and enhanced charge storage.
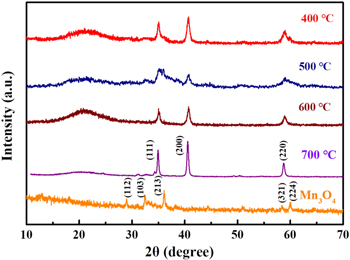
Figure 1. XRD patterns of MnO/C at the different calcination temperatures and Mn3O4.
Download figure:
Standard image High-resolution image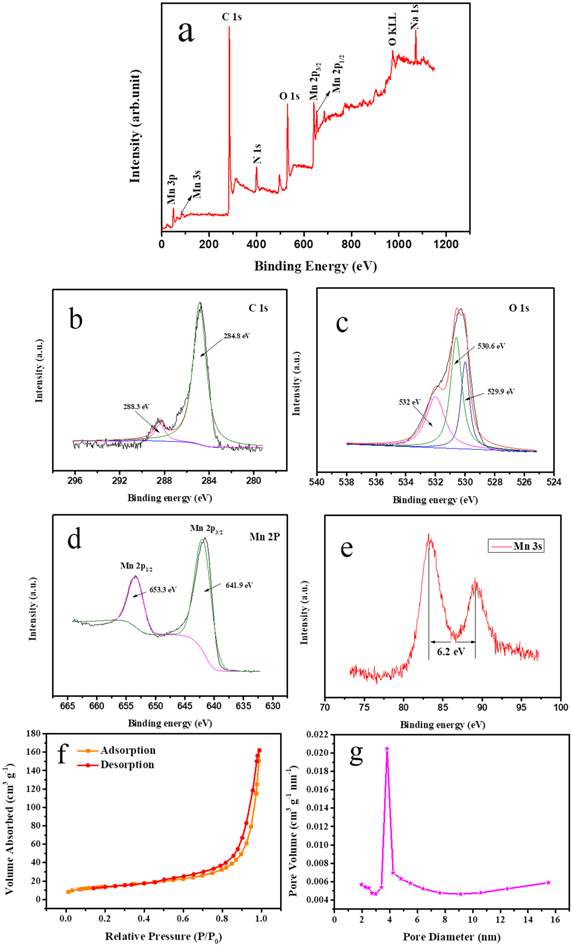
Figure 2. (a) XPS survey spectrum of MnO/C, high-resolution spectrum of (b) C 1s, (c) O 1s (d) Mn 2p and (e) Mn 3s, (f) N2 adsorption–desorption isotherms and (g) corresponding pore size distributions of MnO/C-400.
Download figure:
Standard image High-resolution imageFigures 3(a)–(d) show SEM images of MnO/C at the different calcination temperature. It is obvious that the structure of MnO/C at 400 °C is one-dimensional nanowires. It is very long, no obvious agglomeration, independent of each other, and shows good homogeneity. The reason for the nanowires may be that dopamine selectively attaches to specific crystal faces during co-precipitation. Thus, Mn3O4 nanomaterials with special morphology in figure 3(e) are guided to grow continuously along the one-dimensional direction, resulting in the disappearance of 20–30 nm Mn3O4 nanoparticles and and the formation of 500–600 nm slender Mn3O4 nanorods. The thin and long structure of MnO/C nanowires at 400 °C can be more clearly observed from TEM in figure 3(f), and then the morphology is further observed under HRTEM. As presented in figure 3(g) (size at 20 nm) and figure 3(h) (size at 50 nm), the diameter is 10–30 nm, and MnO is uniformly wrapped by carbon materials, which is further confirmed by figure 3(i). The lattice spacing of 0.255 and 0.222 nm can be observed, assigning to (111) and (200) planes in MnO. This is consistent with the XRD results, indicating that there is indeed MnO inside the material, and the carbon layer tightly wrapped on the surface of MnO can be clearly observed.
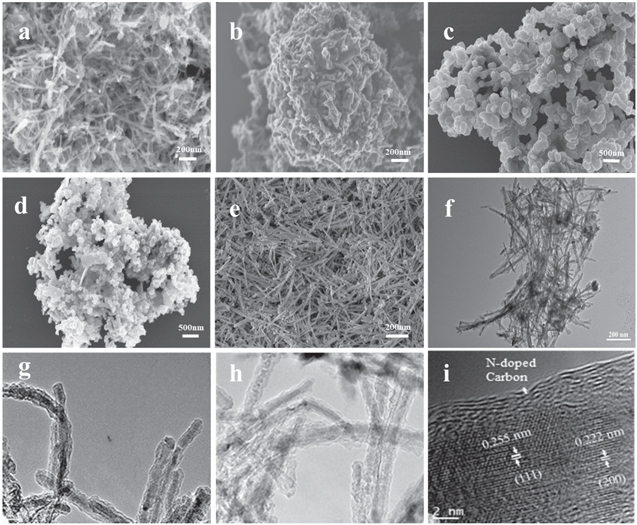
Figure 3. (a)–(d) SEM images of MnO/C-400, MnO/C-500, MnO/C-600, MnO/C-700, (e) SEM image of Mn3O4, (f) TEM image of MnO/C-400, (g)–(i) HRTEM image of MnO/C-400.
Download figure:
Standard image High-resolution imageFrom figures 3(a) and (b), we found that the morphology of one-dimensional nanowires did not change significantly, but there was an obvious agglomeration. With the increase of temperature, the agglomeration phenomenon of the samples becomes more and more serious, which leads the structural damage, forming the special morphology of the nanowire aggregation, and the increase of crystallinity and specific are. In addition, from EXD element mapping we can observe the distribution of elements. According to figures 4(b)–(e), these mappings illustrate that Mn, C and O elements are uniformly distributed. The weight percentage of Mn element is 37.69%, and the weight percentage of C element is 44.81% (Mn:C is close to 1:1), which makes them play a better synergistic effect. The atomic ratio of Mn is 17.45%, and that of O is 13.36%, further indicating the formation of MnO, and a small amount of N is evenly distributed in the nanowires.
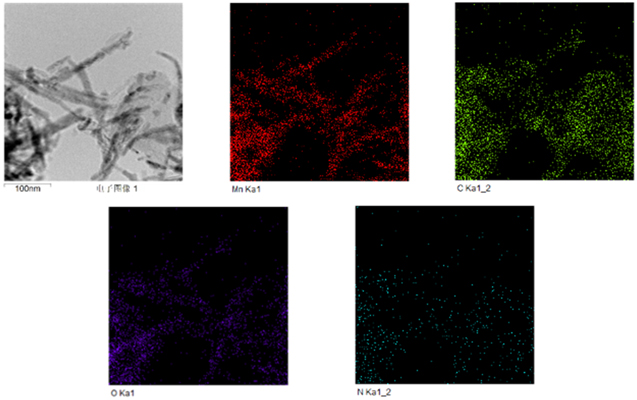
Figure 4. (a) EDX mapping images of (b) Mn, (c) C, (d) O and (e) N.
Download figure:
Standard image High-resolution imageFigure 5(a) represents CV curves of MnO/C nanomaterials at the different calcination temperature at a scan rate of 100 mV s−1. We observe that CV curves were equivale to rectangles at different temperatures, indicating good reversibility of materials. Manganese oxygen materials and amorphous carbon showed a good synergistic effect. By comparing the CV curves at different carbonization temperatures, it can be seen that the curve integral area of the sample calcined at 400 °C is greater than that at other temperatures. Figure 5(b) displays the GCD curves of the nanomaterials at different calcination temperatures at 1 A g−1. The curve has good symmetry and linear changes in charge and discharge, which indicates that MnO/C materials have high Coulomb efficiency and good electrochemical reversibility [45]. At the calcination temperature of 400 °C, the material reveals the highest specific capacitance, which is consistent with CV results. At 1 A g−1, the specific capacitance of the material obtained at different temperatures can be calculated as 356, 295.2, 251.9 and 219.1 F g−1, according to formula (1). Therefore, according to CV curve and GCD curve, it can be concluded that 400 °C is the best calcination temperature. By XRD and SEM images can be clearly seen, with the gradual increase of calcination temperature, the crystallinity increase gradually, gradually increased degree of aggregation, materials reunion phenomenon more obvious, the bigger the specific surface area. The material has gradually changed from the original thin and long nanowires with good dispersion to the special nano-morphology with agglomeration, which makes the specific capacitance decrease gradually.
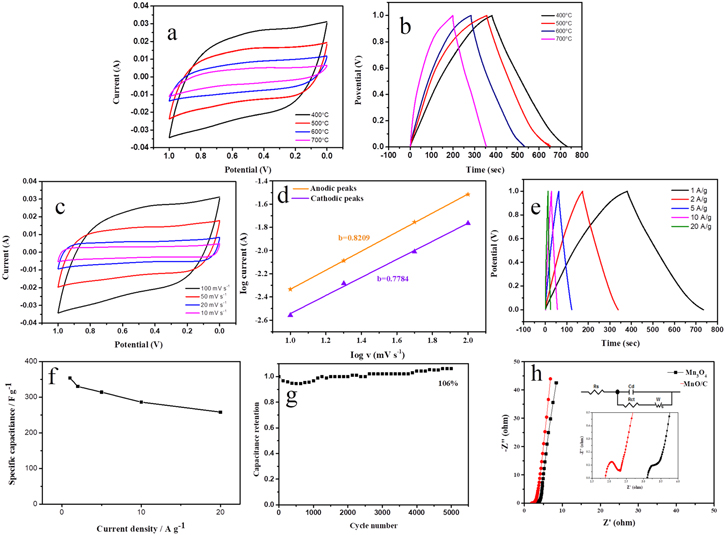
Figure 5. (a) CV and (b) GCD curves of MnO/C at different carbonization temperature at 100 mV s−1 and at 1 A g−1, respectively, (c) CV curves of MnO/C-400 at different scan rate, (d) Tafel's plot for the MnO/C-400 eletrode, (e) GCD curves of MnO/C-400 at different current density, (f) specific capacitance calculated from GCD curves, (g) the cyclic stability of MnO/C-400, (h) Nyquist plot of Mn3O4 and MnO/C-400.
Download figure:
Standard image High-resolution imageFigure 5(c) reveals the CV curves of MnO/C nanowires calcined at 400 °C at different scanning rates. With the increase of the scanning rate, the curves did not change noticeably, but showed a symmetrical rectangular shape, which indicates that MnO/C nanowires have excellent mass conversion rate, good reversibility and strong depolarization ability. The redox peak at 0.45 V is more obvious at 100 mV s−1, which is due to the pseudocapacitance behavior of MnO. In theory, the current density (I) and the scanning rate (ν) obey I(ν) = aνb . When the value of b is 0.5, the current is mainly controlled by diffusion control battery type behavior. When b is 1, the current is controlled by the surface, which is capacitive behavior. So b value defines two different electrochemical behaviors in the electrochemical storage process. The comparison of log (ν) and log (I) is shown in figure 5(d). The value of b can be obtained by fitting. The b value of the cathodic peaks and anodic peaks are 0.7784 and 0.8209 respectively, which are between 0.5 and 1, indicating the co-existence of diffusion control and surface control processes. Figure 5(e) depicts the GCD curve of MnO/C nanowires at various current densities from 1 to 20 A g−1 at the calcination temperature of 400 °C. As the current density increases, the shape of the graph does not change, and the graph shows excellent symmetry, which indicates the excellent reversibility and stability. According to equation (1), the specific capacitance of the electrode material are 356 F g−1 at 1 A g−1, 330.6 F g−1 at 2 A g−1, 314.3 F g−1 at 5 A g−1, 286 F g−1 at 10 A g−1, and 258.2 F g−1 at 20 A g−1. Evidently, at high current density, the material also maintains a high specific capacitance, and no significant resistance voltage drop is observed, reflecting the good capacitance behavior of the material [49]. In figure 5(f), the specific capacitance of MnO/C nanowires at 20 A g−1 remains 73% of that of 1 A g−1, which indicates good multiplicity. As shown in table 1, compared with most of the previously reported Mn based materials, the MnO/C-400 electrode exhibited a superior specific capacitance.
Table 1. The comparison of the electrochemical performance of MnO/C and other reported materials.
| No. | Materials | Specific capacitance | Cyclic stability | Reference |
|---|---|---|---|---|
| 1 | MnO2/HCSs | 227.5 F g−1 at 1 A g−1 | 96% after 5000 cycles | [50] |
| 2 | Graphene/Mn3O4 composites | 270.6 F g−1 at 0.2 A g−1 | 91% after 1500 cycles | [51] |
| 3 | Mn3O4-nanorods/graphene | 121 F g−1 at 0.5 A g−1 | 100% after 10 000 cycles | [52] |
| 4 | Mn3O4/graphene composites | 161.0 F g−1 at 1 A g−1 | 230 F g−1 after 1000 cycles | [53] |
| 5 | Mn3O4/graphene-nanosheets | 271.5 F g−1 at 0.1 A g−1 | 100% after 20 000 cycles | [54] |
| 6 | Ni-Mn3O4 nanocomposite | 230 F g−1 at 0.25 A g−1 | 94% after 1000 cycles | [55] |
| 7 | MnO/C | 226 F g−1 at 1 A g−1 | 96.66% after 1000 cycles | [45] |
| 8 | LaMnO3/MnO nano-arrays | 260 F g−1 at 0.5 A g−1 | 65% after 5000 cycles | [56] |
| 9 | The porous MnO/Mn3O4 nanocomposite 'urchins' | 207 F g−1 at 1 A g−1 | 83% after 3000 cycles | [57] |
| 10 | MnO/C-400 nanowires | 356 F g−1 at 1 A g−1 | 106% after 5000 cycles | This work |
The capacitance changes recorded by MnO/C nanowires at 10 A g−1 under a 5000 cycle GCD test, as shown in figure 5(g). Evidently, after 5000 times of cycle, the specific capacitance of material not only has no attenuation, but also increases compared with the beginning. In particular, the significant increase after 1500 cycles because free ions can diffuse fully at lower current densities, and the activation of the electrode material causing more active sites to be excited. Therefore, the MnO/C nanowires still retain 106% after 5000 cycles, which displays favorable stability. The electrochemical properties of the material tested by EIS were further explored. Figure 5(h) represents a Nyquist plots of MnO/C nanowires and Mn3O4 nanomaterials measured. The figure displays that the high frequency area and the low frequency region are the semicircle and the about straight line [58]. The equivalent series resistances (Rs) of the material is reflected by the point of intersection with the real axis phase, due to the Faraday reaction [59]. The MnO/C Rs value of 1.897 Ω is lower than that of Mn3O4 (3.109 Ω), indicating that MnO/C nanowire materials can provide faster charge transfer. Because Rs is affected by the characteristics of active substances, the carbon containing electrode undoubtedly has a smaller resistance, and carbon can improve the electrical conductivity. Moreover, the size of the semicircle radius is greatly related to the interfacial resistance of materials. The smaller the circle radius is, the smaller the interfacial resistance is. The schematic diagram in figure 5(h) shows the magnified portions of the Nyquist plots in the higher frequency region and the diagram of equivalent electrical circuit model fitting all the Nyquist plots. It can be clearly observed that the arc radius of MnO is smaller than Mn3O4. At low frequencies, the slope of the line segment reflects the Warburg impedance (Zw) that controls ion diffusion. The slope of MnO/C nanowires in the low frequency region is higher than that of Mn3O4 nanomaterials, declaring that MnO/C nanowires have a fast diffusion rate in the active material, and its slope is close to 90°, which indicates that the diffusion resistance between electrolyte solution and collector is relatively small, and the material has good electrical conductivity [60, 61]. Therefore, MnO/C composites exhibit ideal capacitor behavior.
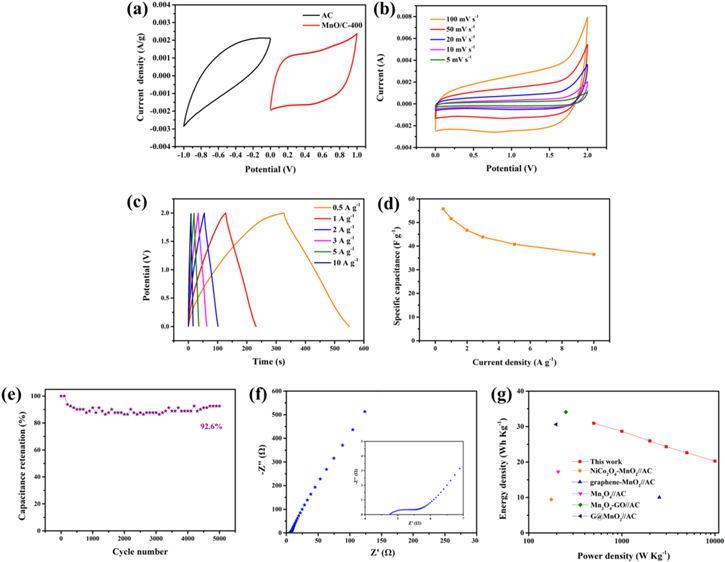
In order to study the stable functional potential window of ASC devices, CV measurement results of two poles at 50 mV s−1 in three-electrode batteries were firstly carried out, as shown in figure 6(a). The corresponding voltage range indicates that MnO/C//AC ASC devices can operate within the optimized voltage range of 2.0 V. In addition, MnO/C//AC asymmetric two-electrode supercapacitors were assembled using MnO/C-400. The CV curves of MnO/C//AC measured between 0 and 2 V at different scanning rates (figure 6(b)) showed good capacitance performance. The preeminent performance of the material is further demonstrated by the good symmetry curve of GCD curve in figure 6(c). According to the GCD curve, the ASC capacitance was calculated by equation (1). When the current densities are 0.5, 1, 2, 5 and 10 A g−1, the specific capacitance is 55.70, 51.55, 46.70, 43.80, 40.75 and 36.50 F g−1, respectively (figure 6(d)). Figure 6(e) demonstrates the stability of MnO/C//AC-ASC at 1 A g−1. The capacitance still remains about 92.6%, showing excellent cycle stability. In figure 6(f), the radius of the high frequency region is relatively small, indicating that the Rct in the mass transfer process is small.
Figure 6. (a) CV profiles of the MnO/C-400 and AC electrodes obtained at 50 mV s− 1 scan rate in a three-electrode arrangement, (b) CV of MnO/C-400//AC at different scan rates, (c) GCD curves of the MnO/C//AC at different current densities, (d) the plot of the relationship between the specifific capacitance and current density, (e) cycling performance of MnO/C//AC at 1 A g−1, (f) EIS spectrum of MnO/C//AC, and (g) Ragone plot of the MnO/C//AC.
Download figure:
Standard image High-resolution image
The E and P are the most straightforward data used to determine the performance of the supercapacitors [62]. According to equations (2) and (3), E and P can be calculated. The assembly of MnO/C and AC produces a tremendous energy density of 30.944 Wh kg−1 at 500 W kg−1. And the highest power density of 10 kW kg−1 at 20.278 Wh kg−1. The Ragone plot compares the MnO/C//AC-ASC with other literatures (figure 6(g)). As shown in the figure, some similar materials, such as NiCo2O4-MnO2//AC (9.4 Wh kg−1 at 175 W kg−1) [63], graphene-MnO2//AC (10.03 Wh kg−1 at 2530 W kg−1) [64], Mn3O4//AC (17.267 Wh kg−1 at 207.312 W kg−1) [65], Mn3O4-GO//AC (34.1 Wh kg−1 at 251 W kg−1) [66], G@MnO2//AC (30.6 Wh kg−1 at 197 W kg−1) [67]. In conclusion, MnO/C//AC devices have a very broad application prospect in the field of supercapacitors.
4. Conclusion
In summary, Mn3O4 was first fabricated through two-step hydrothermal method. And then the Mn3O4 and dopamine aqueous solution were mixed uniformly by ultrasonic method through co-precipitation. And the MnO/C composites were prepared by calcination in N2. The morphology of materials at different calcination temperatures was studied. It was found that the materials obtained at 400℃ were linear structures. The excellent performance of MnO/C was confirmed by various electrochemical tests. The specific capacitance of 356 F g−1 at 1 A g−1. Especially, the MnO/C nanowires retained 106% of their initial capacitance after cycles. The MnO/C//AC-ASC produces a tremendous energy density of 30.944 Wh kg−1, while the power density is 500 W kg−1. And the highest power density of 10 kW kg−1 at 20.278 Wh kg−1. The material demonstrates excellent cycling stability and good application prospect.
Acknowledgments
This work is supported by the Anhui Provincial NaturalScience Foundation (Grantno.1908085MB37).
Data availability statement
All data that support the findings of this study are included within the article (and any supplementary files).