
Abstract
This study focuses on the development of a new hybrid biological material to be applied in the production of electrical energy. These organo-metallic cells are constituted by cyanobacteria (Fischerella muscicola) and silver nanoparticles (AgNPs). AgNPs were obtained by green synthesis using the extract of the fruit of the Berberis hallii plant as reducing agent with two different concentrations of silver nitrate (AgNO3), 1 and 10 mM. The morphology, physicochemical and electrical properties of the cyanobacteria with and without AgNPs were evaluated. To verify the efficacy of this new material, and the effect of the medium used, Nitrofoska or BG-11, the growth kinetics was evaluated by UV–vis up to t = 63 d with and without renewal of the culture medium and O2/CO2 exchange. Through morphological characterizations of Fischerella muscicola it was possible to identify the presence of an associated bacterium identified using molecular techniques as Pseudomona guguanensi that could act as a supporting organism in the growth of this cyanobacteria. The studies carried out did not shown cell toxicity for the cultures that have AgNPs and on the other hand, it was observed that the hybrid cells (Cy-AgNPs) are electron carriers recording an increase of up to 57% and 18% in their electrical potential with BG-11 and Nitrofoska culture media, respectively and an increase in the anodic current peak of 6.5% of Cy-AgNPs respect to only F. musicola.
Export citation and abstract BibTeX RIS
1. Introduction
The development and monetary investment in new renewable and environmentally friendly energy sources has increased by 65.4% in 2018 compared to 2017 and are a priority in this new century [1–3] due to the problems of global warming caused by the excessive consumption of fossil fuels as the main source of energy, whose investment was reduced by 22.8% that year [1]. Among the renewable energy sources currently being investigated are microorganisms such as cyanobacteria and microalgae [4–7]. These microalgae, besides contributing between 70% and 80% of oxygen to the planet [8, 9], could generate up to 8% of the total bioenergy generated in the world, compared to photovoltaic (9%), wind (21%) and hydroelectric (60%) [1, 10, 11]. These organisms can also be applied as microbial power cells [12] or sources of lighting systems [10] that use the phenomenon of photosynthesis for the generation of electrical energy [10, 12]. There are many types of cyanobacteria or microalgae worldwide [13, 14]. There are no detailed studies of their morphological characteristics, chemical composition or electrical properties as they depend on the region in which they are located and then cultivated. In this work, a morphological, physicochemical and electrical study of the cyanobacterium Fischerella muscicola [15], a prokaryotic organism belonging to the order Stigonematales with chlorophyll A, was carried out (C55H72O5N4Mg) [15], present in Ecuador. These microalgae have a structure in the form of an intracellular membrane called thylakoids [10, 16], whose function is the absorption of sunlight due to the presence of a phycobiliprotein of proteic nature called phycocyanin with a bright blue color [17, 18]. These cyanobacteria are also known as blue–green algae and are capable of doing oxygenic photosynthesis similar to higher plants [12, 13] and withstanding sudden changes in temperature [14, 18]. The presence of microcystins in these cells can cause toxins, therefore, if consumed they can generate gastrointestinal alterations, so their application in the food industry is not recommended [19, 20], however, they can be used as a source of energy [21]. In this work, the growth kinetics of these cyanobacteria were evaluated in two different culture media in terms of their macro and micro nutrient constitution, as well as their acquisition cost (BG-11 and Nitrofoska). To enhance their properties as an energy source, silver nanoparticles (AgNPs) were added to their culture medium in order to generate a new hybrid material, which from now on we will call Cy-AgNPs (F. muscicola + AgNPs). These developed hybrid cells can use these nanostructures as antennas to enhance the transport of electric charge [22] since cyanobacteria, by the mechanism of photosynthesis, release electric charge but their transport is delimited by the interface between cyanobacteria and their culture medium [23–26]. AgNPs were synthesized by green chemistry using extract of the fruit of Berberis hallii (carrasquilla) species following the protocol described in [27–32]. The samples were characterized with and without AgNPs by transmission electron microscopy, confocal microscopy and UV–visible. The toxicity level of AgNPs in cyanobacteria was analyzed by cell growth kinetics. Finally, the electrical potential curves were measured using the intermittent contact mode (EFM) configuration with atomic force microscopy to verify the potential of these hybrid cells as a renewable energy source for the development of power cells or lighting systems.
2. Materials and methods
2.1. Materials
The fruit of the Berberis hallii species was obtained at the local market in the San Francisco de Jijón neighborhood, Rumiñahui canton, Sangolquí city, Pichincha province, Ecuador (0°21'31.7''S 78°24'39.6''W). A 90% solution of methanol acidified with hydrochloric acid (37.1%) was used to obtain the carrasquilla extract. This macerated mixture was then concentrated in a rotary evaporator (Buchi, R-210, Barcelona, Spain). Silver nanoparticles were synthesized using silver nitrate (AgNO3) purchased from Spectrum Chemical Mfg. (California, US.), type 1 water was used for dilutions, and the pH was adjusted with sodium hydroxide (98.9%) (Fischer Scientific, Bergen, US.) In a previous investigation [15], the cyanobacterium Fischerella muscicola was collected from the Papallacta geothermal spring in the Quijos canton located in Napo Province, Ecuador. (0°22'01.0''S 78°07'58.0''W), at 53 ± 2 °C, under permit # MAE-DNB-CM-2017-0071 granted by the Ministry of Environment of Ecuador. This was isolated and grown in the laboratory at 18 ± 3 °C in medium (BG-11) (Compo GmbH, Münster, Germany) under a 1:3 dilutions (10 ml of biomass in 30 ml of BG-11) and was identified by molecular techniques [15]. For cyanobacteria culture, BG-11 medium [33] and Nitrofoska complete foliar fertilizer 30-10-10-10-0.6 MgO (Compo GmbH, Münster, Germany), 3 grams in 1 liter of distilled water type 1 [15], were used due to its low commercial cost. Berberis hallii fruits underwent a maceration process as described in the literature [28]. The green synthesis process of silver nanoparticles was replicated using the concentrations of 1 mM and 10 mM silver nitrate (AgNO3), respectively [28].
2.2. Fischerella muscicola
The cyanobacterium Fischerella musicola was cultured at the Environmental Microbiology Laboratory, Center for Nanoscience and Nanotechnology, Universidad de las Fuerzas Armadas ESPE. To verify the purity of the cyanobacteria, 20 μl of the stock culture was added to a new solid BG-11 medium and grown by streaking and extension [15]. Fischerella muscicola cultures were grown at room temperature with photoperiod control (24 h light and 24 h dark) for 60 d to volumes between 500 and 1500 ml. Fischerella muscicola biomass was subsequently cultured at a 1:2 dilution (10 ml of biomass + 20 ml of culture medium) for both BG-11 and Nitrofoska medium. The growth phases of these two cultures were analyzed for 63 d with UV–vis absorption spectroscopy under the following conditions: (i) without renewal of the culture medium nor O2/CO2 exchange and (ii) with renewal of the culture medium every 7 d for BG-11 and every 14 d for Nitrofoska and O2/CO2 exchange. For the renewal of BG-11 and Nitrofoska media, the contents of the cultures were previously dispensed into 50 ml falcon tubes and centrifuged at 6000 rpm for 6 min. The supernatant was then removed, and 50 ml of fresh BG-11 or Nitrofoska medium was added to the pellets obtained. In the analysis of purity and morphology of the cyanobacteria by means of microbiological, optical and electronic microscopy techniques, the presence of a bacterium was observed. For its identification, a sample was taken with a bacteriological loop and streaked on nutrient agar plates for 24 h at 37 °C [33]. To ensure viability and purity, Gram staining was performed, and the microorganism was observed under an optical microscope (Olympus CX21) at 100× magnification. Their molecular identification was performed by DNA extraction [15, 34], followed by amplification of the 16 S rRNA gene fragment. The used primers were 27 F: AGA GTT TGA TCM TGG CTC AG and 1429R: CGG TTA CCT TGT TAC GAC TT [35, 36]. The polymerase chain reactions (PCR) were carried out with a final volume of 25 μl. For each reaction, 12.5 μl GoTaq® Green Master Mix (Promega, Madison, US), 1.25 μl of 27 F, 1.25 μl of 1429 R, 7 μl of nuclease-free water and 3 μl of DNA were used. The conditions for amplification were 95 °C for 3 min for initial denaturation, followed by 32 cycles of 30 s at 94 °C (denaturation), 30 s at 60 °C (hybridization), 1 min at 72 °C (extension), and a final extension at 72 °C for 10 min [15]. These were visualized on 1% agarose gels by horizontal electrophoresis, in which 5 μl of the PCR product, the negative control and the 250–3000 bp molecular marker were loaded. The amplifications were sequenced at Macrogen—Korea. The sequences obtained were analyzed using the bioinformatics program Geneious R9.1 with a high sensitivity and using an error probability limit of 0.02. The consensus sequences were subjected to a similarity analysis in the BLAST database (blastn) of NCBI, for their identification.
2.3. Physical and chemical characterization of AgNPs
Carrasquilla extract obtention, reproduction of the AgNPs formation process with different concentrations of AgNO3 (1 and 10 mM) and the colorimetry assay of the cyanobacteria with and without AgNPs were analyzed with a UV–vis spectrophotometer (Analytic Jena S600). A transmission electron microscope (TEM) (FEI Spirit twin) operated with a voltage of 80 kV was used to study the morphology of AgNPs. The size of the AgNPs in the micrographs was evaluated with FIJI software [37].
2.4. Physical and chemical characterization of cyanobacteria Fischerella muscicola
The study of the cell growth kinetics of the cyanobacterium Fischerella muscicola in the two different culture media (BG-11 and Nitrofoska) and of the hybrid cells (F. muscicola + AgNPs) was performed by in situ counting of 20 μl of each sample in a microscope with a trinocular head (Olympus, CX21) using the Neubauer chamber (Marienfeld). Equation (1) was used to determine the number of cells cm−3. The average of four replicates was used to calculate the growth curves as a function of time
Morphological analysis of the cyanobacterium Fischerella muscicola was performed using different microscopy techniques. For the observation of the blue–green algae in the scanning electron microscope (FEG-SEM, TESCAN MIRA 3) in high vacuum the sample was fixed in 3% glutaraldehyde for 3 min, post fixed with 1% osmium tetroxide for 20 min, then the sample was exposed to increasing concentrations of ethanol for dehydration (50, 70, 90 and 99. 9% v/v for 5 min and 99.9% v/v for 10 min); it was then freeze-dried (ILSHINE BIOBASE) at −62 °C for 24 h and finally the sample was metallized. The surface roughness of the associated bacteria and cyanobacteria was evaluated using an atomic force microscope (AFM-dimension icon, Bruker) in intermittent contact mode (ScanAsyst Air) a silicon nitride cantilever was used (SNL 100). Scan rate was 0.498 Hz using an integral gain of 5, proportional gain was 10 and set point amplitude was fixed at 22 nm. Analysis area was 25 um × 25 um with a samples/line of 512. Bruker's Microscope Image Registration and Overlay (MIRO) software was used for data analysis. For the identification of the elemental composition of Fischerella muscicola, it was washed with autoclaved distilled water three times for 15 min; allowed to dry for 72 h and crushed. Then the samples were analyzed with an x-ray energy dispersive detector (Bruker EDS X-flash 6130) with 123 eV resolution (Mn alpha) in 100 points per two replicates.
2.5. Cy-AgNPs
For the development of hybrid cells (F. muscicola + AgNPs = Cy-AgNPs), different volumes (0.2, 0.5, 0.8 and 1.2 ml) of AgNPs 1 mM and AgNPs 10 mM were diluted in 30 ml of Fischerella muscicola culture medium, obtaining a total of 16 treatments (8 with BG-11 medium and 8 with Nitrofoska medium) plus the respective blanks for each treatment. The working conditions were pH = 8, photoperiod (24 h light/24 h dark) with a light and dark power of 10.77 ± 0.31 cd m−2 and 0.78 ± 0.04 cd m−2, respectively. Culture media were renewed every seven days for 63 d and samples were maintained at room temperature.
2.6. Physical and chemical characterization of Cy-AgNPs
The toxicity level of AgNPs in cyanobacteria was analyzed using the cell growth kinetics described above for cyanobacteria without AgNPs. The study of the adhesion of AgNPs on cyanobacteria to form the hybrid material (Cy-AgNPs) was performed by electron microscopy. For this, 20 μl were placed in a 300 mesh F/C Cu TEM grid and transmission images were observed in a FEG- SEM, with an observation distance of 5.8 mm and a voltage of 30 kV. To verify whether AgNPs were internalized in cyanobacteria, photosynthetic activity was studied by chlorophyll fluorescence intensity (chlFI) measurements with an Olympus FluoView FV2000 confocal microscope in which fresh samples with and without nanoparticles were analyzed. Chlorophyll fluorescence excitation was induced using the 488 nm laser (WLL), while detection was recorded in the PMT 3 channel at a wavelength band of 620–670 nm. The nanoparticles were observed due to the lateral scattering phenomenon. Each sample was scanned on the 'xyz' axes at a depth of 40 μm (three-dimensional scanning). Analysis was performed on the 'z' axis reflecting the fluorescence (maximum pixel intensity) of the cells for chlFI measurements. Evaluation of the electrical properties of cyanobacteria with and without AgNPs was assessed in the AFM in intermittent contact mode (EFM). An antimony doped Si cantilever with a front and back side coating of CoCr (model: MESP) was used. Scan rate was 0.537 Hz including: integral gain of 1, proportional gain of 10 and a set point amplitude of 24 nm. The sample and tip vias were of 0 mV and 0 V, respectively. Electrical potential curves were obtained using ramp mode. Micrographs were acquired using a 25 μm × 25 μm field of view with a sample/line resolution of 512. Bruker's MIRO software were used for data analysis, and OriginLab software used in the specific analysis of the potential electrical curves. Cyclic voltammetry measurements were performed using a three-electrode system for load transfer analysis and determination of the HOMO energy level. The working electrode was a glassy carbon electrode with a silver and silver chloride (Ag/AgCl) electrode as reference. A platinum strand served as the auxiliary electrode. The analyses were realized in 0.1 M potassium chloride (KCl) solution. Prior to each run, the contents oxygen in KCl solutions were removed by bubbling of N2 for about 15 min. In a first study, sample volume of F. musicola with and without AgNPs was varied. A scan rate of 0.05 V s−1 at room temperature and a range of −1.2 to 1.2 V (SHE versus SCE) were applied. In a second study, a volume of 3.84 ml of Cys-AgNPs was used and scan rate at room temperature in a range of −1.2 to 1.2 V (SHE versus SCE) was varied.
3. Results and discussion
3.1. Silver nanoparticles
In the green synthesis process of AgNPs, using the extract of carrasquilla fruit as reducing agent, it was observed that there was a blue shift of the absorption peak measured with UV–vis (figures 1(a)–(c)) of the extract when it is raised to pH 12. This phenomenon is probably due to the breaking of the C-ring for the formation of a C=O bond and a hydroxyl and in the B-ring there is an O− in the 5' of the B-ring coming from the anthocyanins, a phenolic compound that constitutes a major proportion of the carrasquilla fruit [28, 38]. These changes are probably responsible for the formation of AgNPs [39]. In the deconvolution of the absorption spectra of AgNPs in Gaussian functions [40, 41] of the 1 mM (figure 1(d): χ2 = 0.20) and 10 mM (figure 1(e): χ2 = 0.19) concentration of AgNO3, it could be observed that the two spectra possess four Gaussian bands that are not observed in the deconvolution of the absorption spectrum of the carrasquilla extract at pH 12 (figure 1(c): χ2 = 0.18). These new bands suggest that they are the result of the formation of AgNPs by the different phenolic groups in the extract [28]. By modifying the AgNO3 concentration, wavelength shifts and decrease in its bandwidth are observed. This suggests a change in the shape or size of the AgNPs as described in the literature [42–44]. These variations are also observed in TEM studies (figure 2) in which changes in shapes and sizes of AgNPs are demonstrated in both cases: quasi-spherical and multiform with average sizes of 65.7 nm ± 32.8 nm (1 mM AgNO3) and 21.2 nm ± 8.1 nm (10 mM AgNO3).
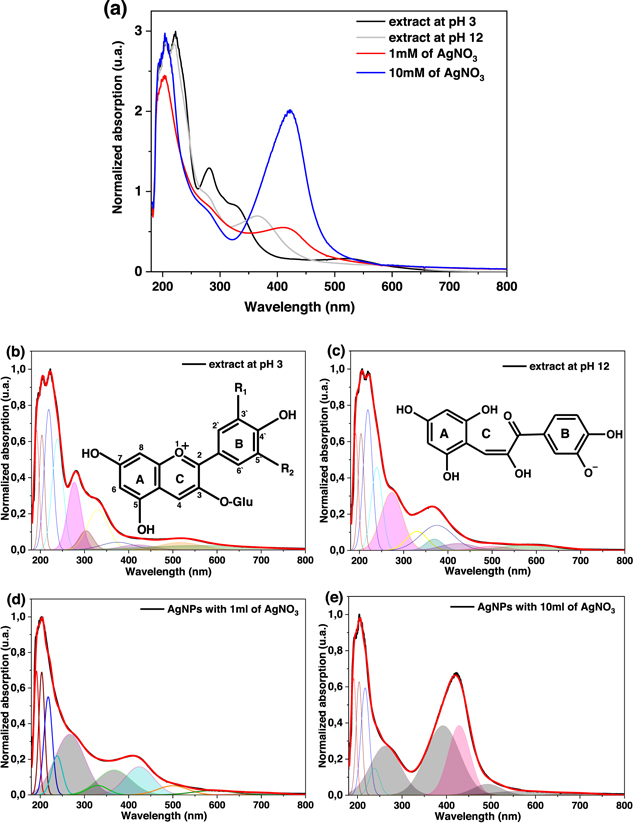
Figure 1. Absorption spectra (a) AgNPs with 1 and 10 mM silver nitrate concentration and reducing agent (Berberis halliiy extract) at pH 3 (normal pH of the extract) and pH 12 (pH used in the synthesis of AgNPs), (b) and (c) deconvolution of the extracts at pH 3 and 12, inset: the chemical structure of the anthocyanins from the extract at different pH, (d) and (e) deconvolution of the AgNPs at different concentrations of silver nitrate (1 and 10 mM).
Download figure:
Standard image High-resolution image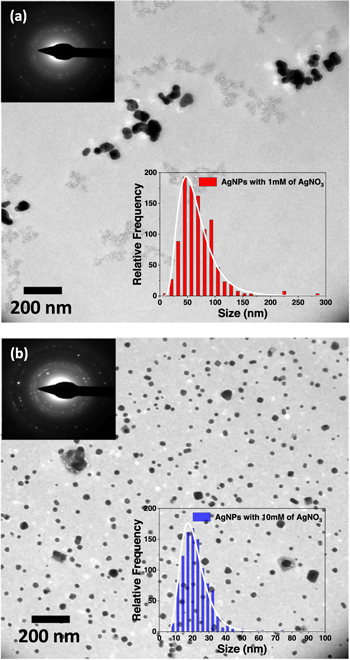
Figure 2. TEM micrographs of AgNPs with different concentrations of silver nitrate (a) 1 mM and (b) 10 mM. SAED patterns and histogram distribution are included.
Download figure:
Standard image High-resolution image3.2. Cyanobacteria Fischerella muscicola
In the characterization of Fischerella muscicola by microbiological, light microscopy and electron microscopy techniques, the presence of an associated bacterium was observed, figure 3(c). Studies show that in the culture medium (Agar BG11-solid) the growth of this bacterium decreases as the cyanobacteria population increases, suggesting that Fischerella muscicola presents cytotoxicity [45–47] which inhibits the growth of this microorganism. The associated bacterium presented a Gram-negative bacillus morphology, figures 3(b) and (c), and its fragment obtained in the PCR of the 16 s ribosomal RNA was approximately 1500 bp. By means of a bioinformatic analysis with Geneious R9.1 software, the consensus sequences were obtained, which were subjected to a similarity analysis in the BLAST database (blastn) of NCBI, for their identification. A Query Coverage of 100% was obtained with a maximum identity of 99.8% with bacterium Pseudomona guguanensi. This bacterium has also been isolated from a geothermal source in Taiwan [48], while the bacterium and cyanobacterium in this study were isolated from the Papallacta geothermal source in Ecuador. A micrograph recorded with electron microscopy shows that the size of the bacterium is 1.68 μm by 0.62 μm, figure 3(c). Its measured surface roughness was 140.6 nm in AFM, figure 3(d). These results could suggest that the associated bacterium functions as a supporting organism for the development of the cyanobacterium Fischerella muscicola. Figure 4 shows cyanobacteria growth curves: (a) in BG-11 and Nitrofoska culture media, without renewal of culture media and O2/CO2 exchange for 63 d (figure 4(a) inset: cyanobacteria culture), (b) with renewal of culture media by a new one every 7 d (BG-11 and Nitrofoska), every 14 d (Nitrofoska) and with O2/CO2 exchange. Figure 4(b) (inset) shows the colorimetry of the cyanobacteria population when they are in different culture media. Figure 4(a) shows the phases of cell growth: latency, exponential, stationary and death. After 50 d of the cyanobacteria remaining in the different culture media, it can be observed that the BG-11 medium has a higher production of 18% of cells compared to Nitrofoska. This suggests that Fischerella muscicola is able to adapt in different culture media despite high and low macronutrient and micronutrient content. These results are evidenced in figure 4(b) with cell growth curves as well as colorimetry results. (BG-11 X = 0.23; Y = 0.29, NITROFOSKA X = 0.22; Y = 0.31). When the culture medium is changed every 7 (BG-11 and Nitrofoska) and 14 d (Nitrofoska), similar cyclic cell growth [49] is evident in the two culture media with a variation of 14.3% (with medium change every 7 d and O2/CO2 exchange) between BG-11 and Nitrofoska. Results of chemical analysis by EDS technique show that Fischerella muscicola consists mostly of C, O, Fe, Ca, P, Mg and K, figure 5(a). Morphology studies by scanning electron microscopy (SEM) show that there is the presence of a mucilaginous membrane as indicated in the literature [10, 16–18], figures 5(b) and (c). This membrane allows it to develop denser cell populations compared to other cyanobacterial species [50]. Also, SEM observation evidences the presence of pores on the cyanobacterial surface, figure 5(a) inset. The average pore size varies approximately from 70 to 190 nm, figure 5(a) inset and figure 6(b). AFM micrographs show a cyanobacterial thickness of 6.0 ± 0.2 μm (figure 6(a)) and a roughness without the presence of the mucilaginous membrane of 362.0 ± 2.3 nm (figure 6(c)). In figure 6(d), a cyanobacterium in cell death phase can be observed whose thickness reaches 0.50 ± 0.01 μm. In the same micrograph of the cyanobacterium without cellular activity, the structure called microplasmodesm that allows communication with its neighboring cells with dimensions of 5.09 ± 0.25 μm long and 303.67 ± 1.15 nm is indicated (arrow).
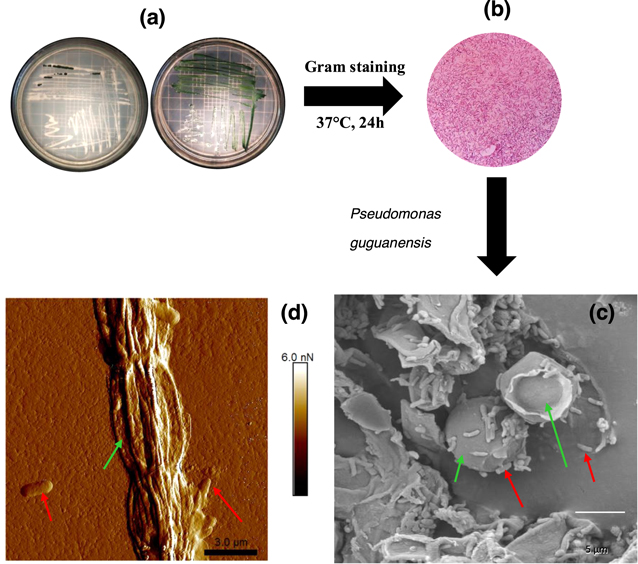
Figure 3. (a) Solid medium culture of Fischerella muscicola (green color) and its associated bacterium (white color), (b) Gram negative stain of the associated bacterium, (c) SEM micrograph (inside green arrow: cyanobacteria and red arrow: bacteria) and (d) AFM micrograph of the cyanobacterium Fischerella muscicola (green arrow) and its associated bacterium Pseudonona guguanensi (red arrow).
Download figure:
Standard image High-resolution image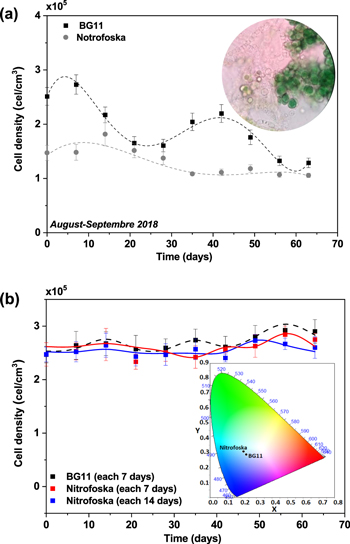
Figure 4. Cell growth kinetics curves of Fischerella muscicola (a) in different culture media (BG-11 and Nitrofoska) and without renewal of culture media or oxygenation, Inset: Cyanobacteria (100×), (b) in different culture media and with renewal every 7 d (BG-11 and Nitrofoska) and every 14 d (Nitrofoska) and oxygen exchange throughout the culture kinetics, inset: cyanobacteria colorimetry palette at 63 d after culture medium renewal every 7 d.
Download figure:
Standard image High-resolution image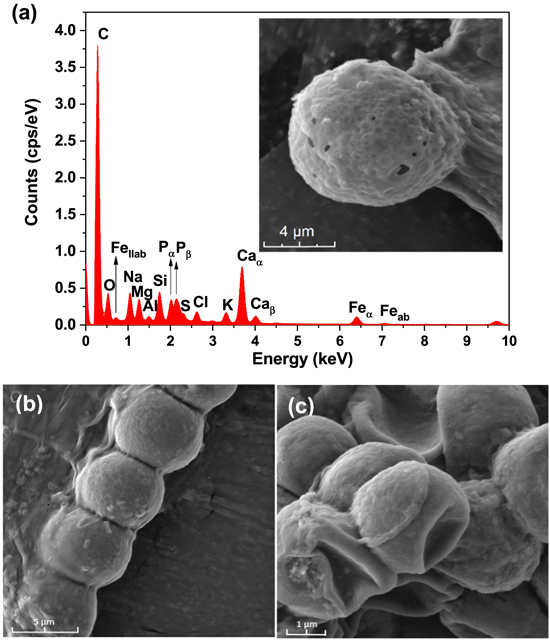
Figure 5. (a) EDS spectra of cyanobacteria without culture medium, inset: SEM micrograph of cyanobacteria, (b) and (c) SEM micrographs of F. muscicola.
Download figure:
Standard image High-resolution image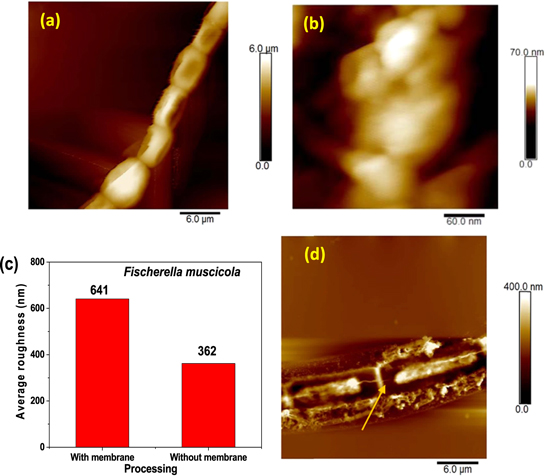
Figure 6. AFM micrographs (a) 6 μm × 6 μm of the chain forming F. musicola in the live state, (b) 60 nm × 60 nm of the cyanobacteria without its mucilaginous membrane, (c) average roughness analysis of the cyanobacteria with and without mucilaginous membrane, (d) 6 μm × 6 μm of the cyanobacteria in the dead state.
Download figure:
Standard image High-resolution image3.3. Hybrid material Cy-AgNPs
The growth curves of the hybrid material (F. muscicola + AgNPs = Cy-AgNps) in the two media BG-11 and Nitrofoska and with different AgNPs sizes are shown in figure 7 (AgNPs with 1 mM AgNO3) and figure 8 (AgNPs with 10 mM AgNO3), on the right side the colorimetry of the hybrid cell with 1.2 ml AgNPs at time zero and 63 d. These results show that cell growth is stable in all cases. Although in the colorimetry studies an attenuation in the blue–green color of the cell is observed, the size and concentration of AgNPs that register less cell death are those samples with a nanoparticle size 36.7 nm ± 20.9 nm in size and 1.2 ml of AgNPs of 1 mM concentration of silver nitrate, both for the cultures with BG-11 and Nitrofoska medium (figure 7). Figures 9(a) and (b) show STEM micrographs where the adhesion of AgNPs to cyanobacteria is observed. This may be due to the presence of their mucilaginous membrane as indicated by the arrows. Figures 9(d), (g) and (i) are fluorescence micrographs of the cyanobacteria (in green) and the dispersion of the nanoparticles (in red) and figures 9(c), (f), (h) correspond to brightfield micrographs. They show the presence of AgNPs in cyanobacteria in both live and dead cells. Figure 10 presents the electric potential difference curves and their respective micrographs of electric potentials analyzed in the AFM of cyanobacteria with and without AgNPs in the different cell culture media BG-11 and Nitrofoska. The results suggest that AgNPs are possibly enhancing the function of the Cy-AgNps hybrid material by generating an increased electrical potential compared to cells without nanoparticles. The results show that cyanobacteria in BG-11 medium have positive potentials as opposed to cyanobacteria in Nitrofoska medium. This difference could be explained by the fact that Nitrofoska, unlike BG-11, contains micronutrients such as: manganese (200 ppm), iron (200 ppm), copper (100 ppm), zinc (50 ppm), boron (150 ppm) and molybdenum (10 ppm). On the other hand, it is observed that the hybrid material with 1.2 ml of AgNPs has an increase in its potential difference by 57% and 18% for the cultures in BG-11 and Nitrofoska culture media, respectively. These results corroborate that there is an energy transfer between AgNPs and cyanobacteria, see figures 11 and 12. In figures 11 and 12, the Cys-AgNPs sample having 1.2 ml of AgNPs and a concentration of 1 mM AgNO3 and BG11 culture medium were analyzed for having the highest potential in the above results. Figure 11(a) shows that as the volume of the cyanobacteria F. musicola or the Cys-AgNPs sample increases, the anodic current peak increases by 24% and 30.5%, respectively, which means that when fusing AgNPs in F. musicola there is an increase in the anodic current peak of 6.5%, and this increase is related to the increase in the volume of the biomass in the cell. The curves also show that as the volume increases the oxidation level of the Cys-AgNPs decreases by 0.2 eV with respect to the F. musicola without AgNPs. In figure 12(a) one can observed a decrease in the oxidation level and an increase in the reducing energy level. These changes are believed to be either by electrostatic interaction [51, 52] or non-covalent, affinity-based receptor-ligand systems [53, 54]. These studies have shown that first, when synthesizing AgNPs with natural extracts, the surface of the nanoparticle depending on the concentration of the natural reducing agent may have an organic coating [55] that may or may not favor the functionalization between the AgNPs and the cyanobacteria. Secondly, F. musicola being Gram negative [56] as well as its associated bacterium (P. guguanensis), have a negative charge due to the ionization of the phosphoryl and 2-keto-3-deoxyoctonate carboxylate groups present in the LPS lipopolysaccharide chains [57, 58]. To better understand the operation of the hybrid system and its energy potentials the HOMO, LUMO and energy GAP were determined, see table 1, but having a non-reversible REDOX curve the LUMO value of the hybrid compound was determined following the analysis processes established in the literature [29, 59]. For this purpose, the energy GAP was determined through the UV–vis absorption spectrum (figure 11(a)) of the samples. Four bands at 350 nm, 612 nm, 656 nm and 696 nm are identified. The last three bands are characteristic of chlorophyll A absorption in F. musicola. The band with a maximum peak at 350 nm is one of the characteristic Gaussian bands obtained in AgNPs with a concentration of 1 mM, see figure 1(d), a band that is not observed in F. musicola without AgNPs. In figure 12(a) it can also be observed in the absorption spectrum of chlorophyll A an almost null toxicity level of F. musicola when it is functionalized at 1.2 ml of AgNPs, a result that is corroborated in the cell growth curves obtained in the Neubaer chamber. Finally, figure 12(b) shows 3.84 ml of Cys-AgNPs at different scan rate and their oxidation and reduction current curve as a function of the square root of the scan rate with their respective linear fits (anodic: R2 = 0.997 and cathodic: R2 = 0.978). The results demonstrate a non-reversible charge transport across the interface between the working electrode (carbon) and the ionic conductor (Cys-AgNPs + KCl), since when extrapolating the anodic and cathodic curves, they do not start from zero. The curve that is closer to zero is the anodic current peak, suggesting that the ionic conductor is more of an electron generator than a hole generator.
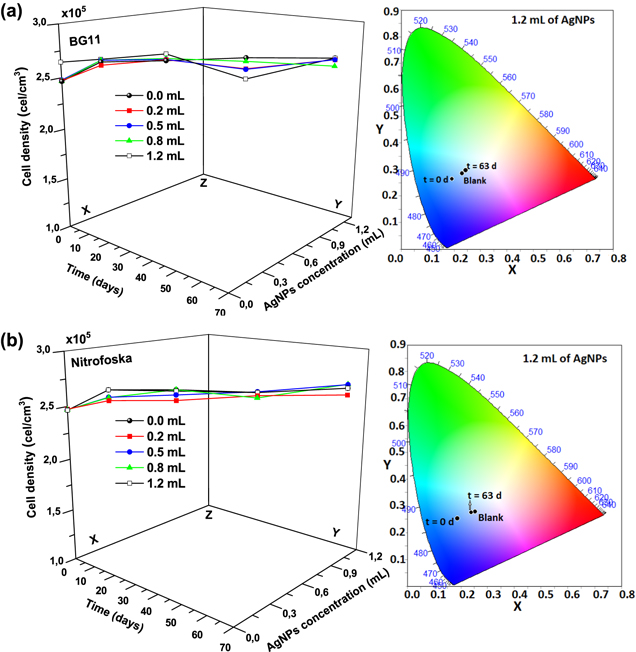
Figure 7. From left to right the cell growth curves of the cyanobacteria with different volumes of AgNPs at 1 mM AgNO3 and the colorimetry palette of the sample with 1.2 mL of AgNPs at t = 0 d and t = 63 d (a) Cy-AgNPs in BG-11 medium, (b) Cy-AgNPs in Nitrofoska medium.
Download figure:
Standard image High-resolution image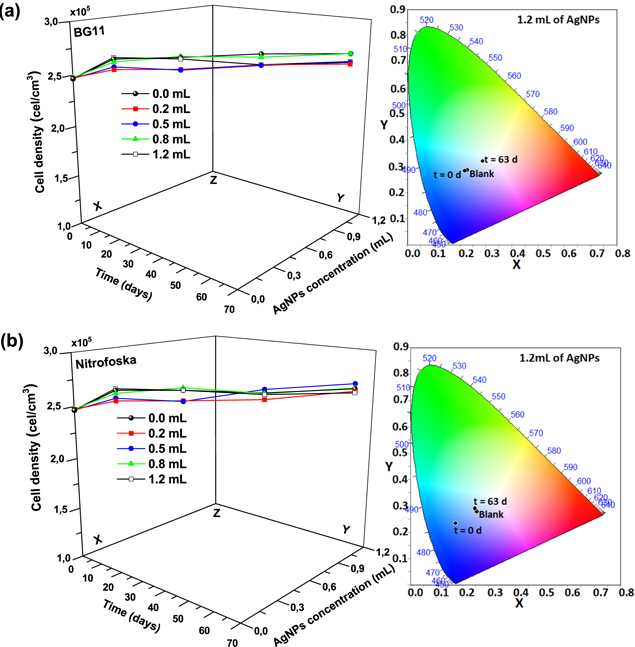
Figure 8. From left to right the cell growth curves of the cyanobacteria with different volumes of AgNPs at 10 mM AgNO3 and the colorimetry palette of the sample with 1.2 mL of AgNPs at t = 0 d and t = 63 d (a) Cy-AgNPs in BG-11 medium, (b) Cy-AgNPs in Nitrofoska medium.
Download figure:
Standard image High-resolution image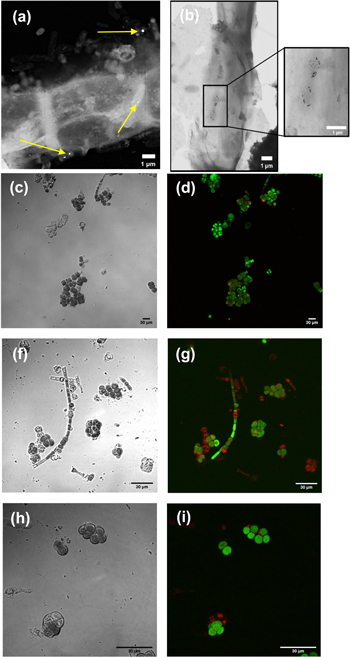
Figure 9. (a) and (b) STEM micrographs of cyanobacteria with AgNPs, (c), (f) and (h) brightfield confocal image of Cy-AgNPs at 40×, 60× and 100×, respectively and in (d), (g) and (i) darkfield confocal image of CyAgNPs at 40×, 60× and 100×.
Download figure:
Standard image High-resolution image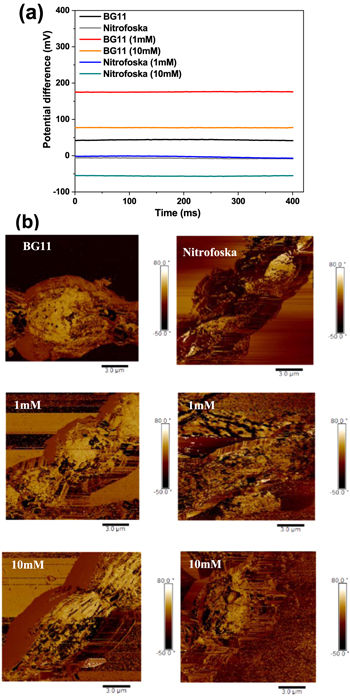
Figure 10. Analysis of cyanobacteria and Cy-AgNPs with 1.2 ml of AgNPs with 1 mM and 10 mM concentrations in different culture media (BG-11 and Nitrofoska). (a) Electric potential curves over time (b) AFM 3 μm × 3 μm electric field micrographs of cyanobacteria.
Download figure:
Standard image High-resolution image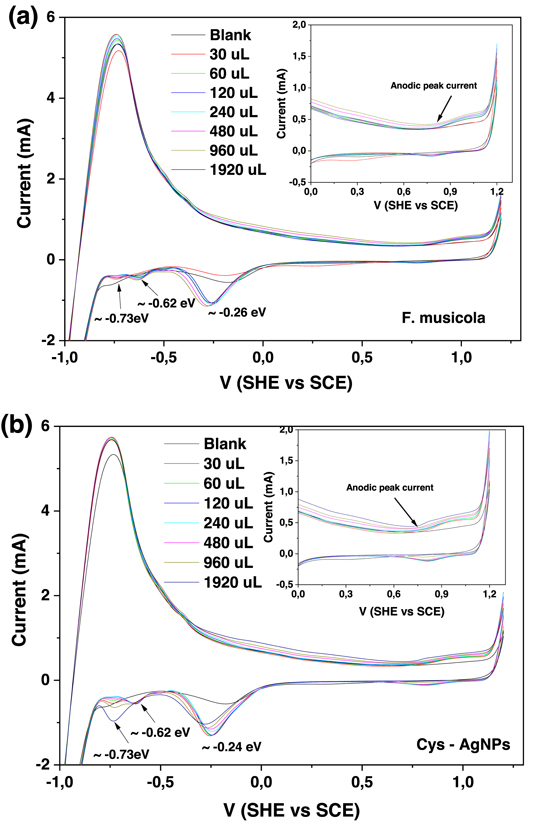
Figure 11. Cyclic voltammetry of different volumes of (a) F. musicola y (b) Cys-AgNPs with scan rate of 0.05 V s−1 at room temperature and a range of −1.2 to 1.2 V (SHE versus SCE).
Download figure:
Standard image High-resolution image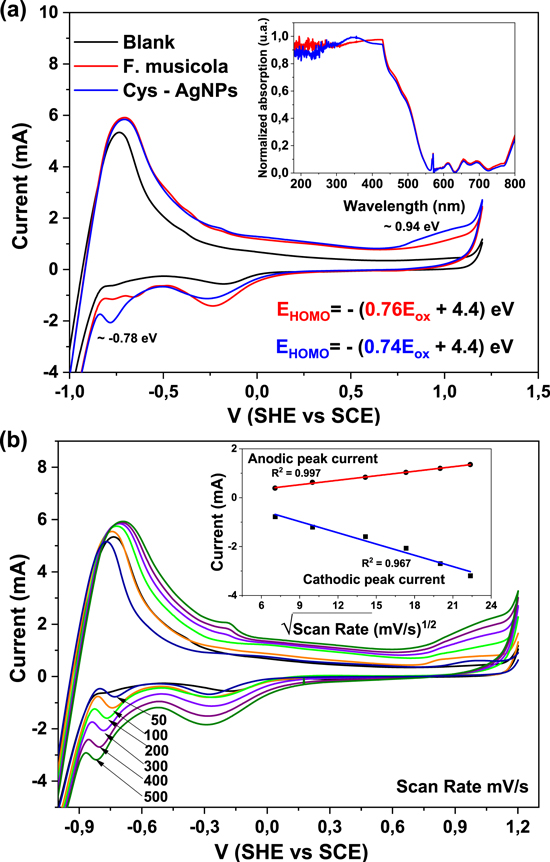
Figure 12. Analysis of F. musicola with and without AgNPs (a) cyclic voltammetry, inserted is the absorption spectrum UV–Vis and the HOMO equation. (b) Cyclic Voltammetry of 3.84 ml of Cy-AgNPs with variations of the scan rate, inserted are the anodic and cathodic curves versus the square root of the scan rate (Current/v1/2).
Download figure:
Standard image High-resolution image
Table 1. Energy levels of HOMO and LUMO of F. musicola and Cys-AgNPs with their corresponding energy gap.
|
4. Conclusion
The analysis of the growth curves of the Cy-AgNPs hybrid material showed that the inclusion of silver nanoparticles in the cyanobacterial culture medium did not represent high toxicity levels, being these of 1.9% and 1.2% for the cultures in the BG-11 and Nitrofoska media with AgNPs with 1 mM AgNO3. This shows that the adhesion of AgNPs does not influence the reproduction of Fischerella muscicola as long as the environment where it develops has a renewal of culture medium and oxygenation. After 63 d of study with weekly renewal of the culture medium of the Cy-AgNPs hybrid material, it was observed that the adherence of AgNPs was maintained in the cyanobacteria. This is probably due to the mucilaginous membrane, although the loss of AgNPs concentration in the renewal of the culture medium should be evaluated in future studies. The increase in the electrical properties of the Cy-AgNPs compared to cyanobacteria alone is significant and was 57% and 18% in the case of BG-11 and Nitrofoska culture medium, respectively, and an increment of 6.5% in their anodic current peak. This allows us to conclude that, for the elaboration of a power cell, it is suggested to use hybrid organometallic material with BG-11 culture medium. This study opens the possibility of creating a new generation of hybrid materials with the addition of silver nanoparticles with cyanobacteria for the increase of electrical energy and its use as a renewable energy source.
Acknowledgments
We thank the Universidad de las Fuerzas Armadas ESPE for funding, project 2015-PIC-002 and PIM1 with rectorate order 2020-167-ESPE-a-1, the Grupo de Investigación en Microbiología y Ambiente (GIMA) for the study and growth of the cyanobacteria, and Eng. David Chavez for his participation in the voltammetry cycle analysis.
Data availability statement
The data that support the findings of this study are available upon reasonable request from the authors.