

Abstract
A microscopic model is still strongly needed to understand the intrinsic photoluminescence (iPL) of metallic nanostructures. In this paper, a phenomenological model concerning the electron dynamics at the excited states, including the electron–phonon (e-p) and electron–electron (e-e) interactions, is developed. This model shows that the dynamics of non-equilibrium electrons at the excited states influence the iPL features significantly. Two main aspects determine the iPL process of metallic nanostructures: the photonic density of states relating to the Purcell effect caused by the surface plasmon resonances, and the electrons transition factor. This model takes into account the contribution of the e-p and e-e interactions to the dynamic electron distribution. The decay process of the non-thermal electrons at the excited states helps understanding most of the iPL features of metallic nanostructures. The calculated and experimental results coincide well regarding the spectral shape, temperature-dependent anti-Stokes emission, and nonlinear behaviors, and time-resolved spectra. The results presented in this paper provide a concise, intuitive, and comprehensive understanding of the iPL of metallic nanostructures.
Export citation and abstract BibTeX RIS
1. Introduction
The metallic nanostructures demonstrate intrinsic photoluminescence (iPL) under light illumination. The iPL has attracted considerable attention due to its potential applications in biosensing [1, 2], imaging tags [3, 4], plasmon mode mapping [5, 6], plasmonic catalysis [7], and thermometers [8–10], and other fields. Though the mechanisms underlying the iPL process are still incomplete, even in heavily debated, some consensus is undisputed. For instance, there are several critical processes involving in the iPL process, including the localized surface plasmon resonance (LSPR), the electron–electron interaction, and electron–phonon interactions [11, 12]. The electron–hole recombination model [13], oscillator model [14], and hot carrier relaxation model [15, 16] have been established to explain the part features of the iPL. These involved factors make it difficult to establish a direct and quantitative theoretical model to understand the iPL processes completely. Hitherto, many theoretical mechanisms, including the interband transition emission, secondary emission, local blackbody emission, Auger relaxation [16], electronic Raman scattering [17], and intraband transition emission, have been proposed.
For instance, Mooradian et al measured the iPL of the Au films firstly. They attributed the iPL to the electron–hole recombination by referring to the emission process of InSb in early [18]. Mertens et al considered the iPL of the metal nanostructure as electronic inelastic light scattering [17], they introduced a virtual middle state into the electron transition [19]. Suemoto et al developed a simple model to describe the intraband radiative transitions across the Fermi surface [20]. Besides, several models combine the electron–hole recombination and Purcell effect. Carattinon et al introduced a phenomenological model and obtained an electron distribution equation containing a Bose–Einstein statistics factor (phonon population distribution) and a Lorentz function factor [10]. Hu et al developed a four-step model to provide a visual picture of the plasmon-modulated iPL [21]. This model can explain the blue-shift of the iPL spectrum compared to the scattering spectrum qualitatively.
Further, Cheng et al developed an oscillator-based model to explain the nonlinear relationship between the iPL intensity and excitation light power [14]. Recently, Liu et al calculated the distribution of hot carriers using the electronic wave function and considered the relaxation of hot carriers, including the electron–electron, electron–phonon, and electron–photon scattering [15]. This model can also explain the nonlinear relationship between iPL intensity and excitation power for the silver sphere with a small size. Most of the mentioned models have been focused on a specific feature of the iPL. However, there has still been a lack of concerning the electron dynamics at the excited states, and the dynamics can influence the iPL phenomena.
In order to overcome this shortcoming, this paper considers the dynamics of electrons at the excited states as the non-thermal electrons, which considerably modify the iPL emission. The focus is on the intraband transition process after the metallic nanostructure is excited by a continuous-wave (CW) laser or a pulse laser. The dynamics caused by the electron–electron and electron–phonon interactions during the thermal decay of 'hot' electrons are investigated [22]. The calculated spectra by the proposed model can explain the peak-shift of the iPL spectra compared to the scattering spectra, temperature-dependent spectrum, and nonlinear features of the iPL spectra. In addition, the time-resolved iPL spectra of the gold nanostructures excited by a pulse laser are calculated, and the obtained results coincide well with the experimental result [20].
2. Proposed theoretical model
The electron–phonon interaction plays a crucial role in the intraband transition during the iPL process. Because the intraband transition in the gold sp band represents an indirect transition process and the momentum mismatches between initial and final states, the iPL process has a very low quantum efficiency than that of the interband transition [23]. A representative thermalization decay process of the 'hot' excited electrons in the gold is presented in figure 1. In this work, besides the electronic intraband transition, the LSPR effect is taken into account, because the LSPR mode modulates the photonic density of states (PDOS) strongly. According to the Fermi golden rule, the iPL emission intensity is related to the Purcell effect enhancing the transition rate greatly. Then, the iPL emission can be expressed as [16, 24]:

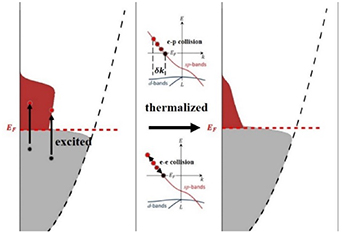
Figure 1. Schematic distribution of 'hot' excited electrons of the gold after photon excitation. The electron–phonon interaction and electron–electron collisions involving the thermal decays.
Download figure:
Standard image High-resolution imagewhere  denotes the strength of electronic intraband transition, and
  represents the PDOS.
The intraband transition process needs the participation of phonons to satisfy the momentum condition. Considering the role of phonon in the intraband transition, we assumed that the iPL related transition is proportional to the electron–phonon interaction strength, which is expressed as:

where  denotes the strength of the electron–phonon interaction.
Then, the electrons distribution involving the electron–phonon interaction during the electron thermalization process under the illumination of a CW laser can be obtained. In this work, the thermalization process of the sp band electrons of the gold is studied. The distribution near the Fermi level is divided into two parts, and the thermal part denoted as  (the gray part in figure 1) and the non-thermal part denoted as
  (the red part in figure 1) [25, 26], which is expressed as:

The thermal part of electrons is defined as the Fermi–Dirac distribution and comprises most electrons in the sp conduction bands [25]. We think the thermal part electrons rarely contribute to the iPL emission at optical band according the luminescence equation [20]. There are several channels for non-thermal electrons decaying, including the radiation as a photon, electron–electron scattering, and electron–phonon scattering [27–29]. The non-thermal electron distribution should be equilibrium under the illumination of a CW laser. For simplicity, the non-thermal part can be expressed as:
where  denotes the electron density of states (EDOS),
  represents the lifetime of the e-e collisions [22];
  is set to approximately 12 fs, which can be calculated based on the Fermi-liquid theory using the random-phase approximation [25];
  represents the electron–phonon interaction; the power of the excitation light is defined as
  , and the photon-electron interaction strength is included the constant C. In general, the lifetimes of excited electrons at different energy levels are not the same [20], which suggests that
  is a function of energy
  of 'hot' electrons. The 'hot' electrons lose their energy in a short time due to interaction with the phonons, which results in a decrease in the electron density. At the same time, the density can increase due to the electrons decaying from higher energy levels. In this work, according to Hu's results [21], the transition probability between different energy levels due to the electron–phonon interaction is considered as an exponential factor, as a function of the energy detuning, so the non-thermal electron density is given by:
where  denotes a constant that is proportional to the mean energy, and
  represents the probability of the electron–phonon interaction. By using a slow varying approximation around
  , we can obtain a result as:

where  denotes the energy of the excitation photon, and
  =
=  .
.
Then,  can be obtained as:
At a low excitation intensity,  is considered as a constant. However,
  can vary with the excitation power due to a large number of non-thermalized electrons at high excitation intensity. For instance, the saturation effect, this saturation process can be modeled by the rate equation (9), which is expressed as:


where  denotes the number of excited electrons, and it has a nearly linear dependence on the excitation power;
  denotes the number of phonons that can interact with the electrons, and lastly,
  denotes the total density of the phonons. The electron–phonon interaction
  is not dependent on the excitation power. Further,
  denotes the rate of the channels where the phonons get energy from the electrons,
  is a constant of cross-section, and
  denotes the loss rate of the phonons. In equation (9), the first part is related to the electron–phonon interaction, and the second part is related to the heat dissipation process. Since
  represents the probability of electron–phonon interaction, the value of
  is direct proportion to the ratio of the first part and
  . Accordingly,
  can be expressed as:

When the excitation power  is much less than
  ,
,  can be treated as a constant. Thus, the relationship between the lifetime and the excitation power can be obtained as:
Thus, the lifetime of the electron–phonon interaction increases with the excitation power. This result is consistent with the previous works [30–32]. Accordingly, the electron transition rate can be expressed as:

Further, the iPL spectrum can be expressed as:
The lifetime of the electron–electron interaction ( ) is shorter than the electron–phonon interaction (
 ) in the intraband transition process [33, 34], so
  can be expressed as:

and, we can obtain the iPL spectrum as:
3. Results and discussion
3.1. iPL spectra of gold thin-films and nanoparticles
According to (17), except for the electron distributions at thermal equilibrium, the non-equilibrium electron modified by the e-e and e-p interactions influence the iPL spectrum. In order to demonstrate the validity of the developed model, the iPL spectrum of the gold thin-film under the illumination of a 633 nm CW laser was determined. The non-thermal electron distribution and the calculated iPL spectrum of the gold thin-film are illustrated in figures 2(a) and (b), respectively. The temperature for Fermi–Dirac distribution was set according to the literature [10] when excited by the CW laser. The calculated spectrum was almost the same as the iPL of the gold film in the experiment. The Purcell effect was ignored because of the broadband response of the surface plasmon polaritons of the thin-film gold.
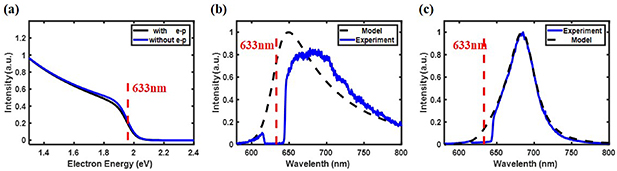
Figure 2. (a) Non-thermal electrons distribution with (black line) or without (blue line) the e-p interactions under the illumination of a 633 nm CW laser. The parameters are as follows:  ,
,  ,
,  , and
, and  . (b) The iPL spectra of the gold thin film excited by a 633 nm CW laser. The experimental result is denoted by the solid blue line, and the black dashed line represents the calculated result. (c) The calculated (black dashed line) and experimental (solid blue line) iPL spectra of the gold nanoparticles. The parameters are set as follows:
  ,
,  ,
,  and
and  . The LSPR wavelength is 687 nm, and the linewidth is 0.118 eV.
Download figure:
Standard image High-resolution imageFor the calculation of the iPL spectrum of the gold nanoparticles, the LSPR would strongly modify the PDOS. The lineshape of the PDOS was assumed to the same as the scattering spectrum of the gold nanoparticle. The calculated iPL spectrum was quite different from that of the thin-films gold because of the high PDOS caused by the LSPR effect. The calculation results were compared to the experimental results. The experiment setup is described in detail in the supplementary material (available online at https://stacks.iop.org/NANO/31/495204/mmedia). The calculated iPL spectra of the thin-films gold and the gold nanorod with the LSPR at a wavelength of 687 nm are presented in figures 2(b) and (c), respectively. In figures 2(b) and (c), it can be observed that in the experimental spectra, there is a gap at approximately 633 nm due to the Notch filters since the reflected excitation laser should be blocked from the spectrometer to obtain the iPL spectrum.
3.2. Spectral shift between iPL and scattering of gold nanoparticles
In the metal plasmonic nanostructure, the peak wavelength of the iPL spectra differs from the peak wavelength of the scattering spectra. Hu et al demonstrated this phenomenon when the metal nanostructure being excited by a 532 nm laser, considering the interband transition [21]. The difference between the peak maximum of the iPL and scattering spectra can be more significant when the nanostructure by a 633 nm laser. Based on the results presented in [14, 23], the peak of the iPL spectra has a more significant difference with the scattering spectra when the LSPR is closer to the excitation photon energy. The iPL spectra and the corresponding scattering spectra of the gold nanoparticles at different detuning between the excitation laser and the LSPR peaks are presented in figure 3(a). The peak maximum of the iPL is always blue-shifted, corresponding to the scattering when the LSPR is red-shifted to the excitation laser frequency. The iPL and scattering spectra of the gold nanoparticles at different LSPR wavelengths are shown in figure 3(b), and these results are consistent with the experimental results reported by Cai et al in [23]. Hu et al have explained the peak difference between the iPL and the scattering spectra and attributed the spectral deviation to the decay process of thermalized 'hot' electrons [21]. According to the mentioned studies, the dynamics of 'hot' electron distributions mentioned above should modulate the iPL emissions considerably.
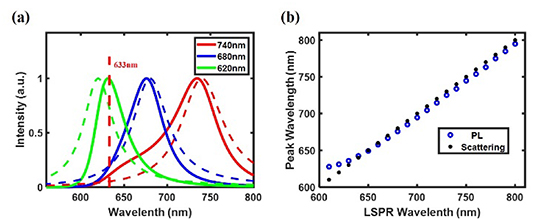
Figure 3. (a) Scattering spectra (dashed lines) at the LSPR wavelengths of 620 nm, 680 nm, and 740 nm, and the corresponding calculated iPL spectra (solid lines). (b) The peak maximum of the iPL and scattering spectra of the nanostructures as a function of the LSPR wavelengths.
Download figure:
Standard image High-resolution image3.3. Nano-thermometer based on anti-Stokes/Stokes iPL spectral ratio
The anti-Stokes iPL spectral shape is supposed to be dependent on the electron occupation distribution near the Fermi level. He et al proposed the spectral profile of the anti-Stokes emission could be applied to probe the localized temperature [8]. Recently, the nanothermometer has been demonstrated to transfer the ambient temperature based on the temperature-dependent anti-Stokes iPL [10, 35]. However, the intensity of the anti-Stokes iPL is often weak, so the fitting error is inevitable when extracting the temperature by the spectral fitting method [10, 36]. The slight change in the spectral shape due to the temperature variation can hardly be extracted. In this work, the thermometer based on anti-Stokes/Stokes iPL spectra is optimized to extract the temperature information by using the integrated spectral intensity. The temperature-dependent ratio of the anti-Stokes and Stokes emission intensities was calculated [37]. The temperature-dependent ratio is displayed in figure 4(a), where the curve shows good monotonicity, being steady with smaller fluctuations. The good monotonicity suggests that it is feasible to extract localized temperature information.
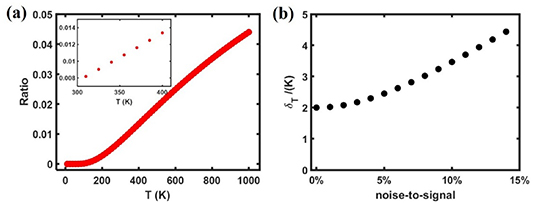
Figure 4. (a) Ratio of the anti-Stokes and Stokes emission intensities calculated by the proposed model. The black and red curves denote the ratios of the nanoparticles for the LSPR at a wavelength of 650 nm. The inset corresponds to the ratio at 300–400 K. (b) The error of temperature probing is a function of the noise-to-signal ratio of the measurement.
Download figure:
Standard image High-resolution imageThe anti-Stokes/Stokes iPL spectral ratio method was implemented in four steps: (1) measure the iPL spectra at different temperatures to calibrate the temperature-dependent ratio curve; (2) fit the ratio curve; (3) measure the iPL spectra at unknown temperature; (4) extract the temperature based on the fitting curve. The errors of the method included the noise-to-signal error of the iPL spectra in Steps (1)  and (3)
  , and the fitting error of the linear interpolation in Step (2)
  . The errors are discussed in detail in the supplementary material. In short, the error varied with the noise-to-signal ratio, as shown in figure 4(b).
3.4. Nonlinear behavior of iPL spectrum
For the one-photon iPL (OiPL) of gold nanoparticles, the linear fitting of the anti-Stokes/Stokes emission integrated intensity as a function of the excitation power has often been considered as a slope of one, i.e. a linear behavior. According to the recent reports [14, 15], the iPL has certain nonlinear features. Namely, the fitting slope of the anti-Stokes is larger than one, and that of the Stokes is less than one. These phenomena can be attributed to the temperature-dependent electron distributions. Besides, the nonlinear behaviors should be influenced by the e-p interaction considerably. In the experiment, the lifetime of the e-p interaction increased with the increase in the excitation light power [30–32]. The power-dependent iPL was calculated, and the ratio of anti-Stokes/Stokes iPL was determined. The power-dependent anti-Stokes and Stokes intensities are presented in figures 5(a) and (b), respectively. The obtained power-law coincides well with the experimental results reported by Carattino [10]. The line shape of the power-dependent ratio shown in figure 5(c) agrees with the experimental results reported by Wen et al [9]. The excitation power-dependent total iPL intensity is displayed in figure 5(d), where it can be seen that the total iPL intensity is slightly nonlinear with the excitation power. Consequently, the nonlinear behaviors of the anti-Stokes, the Stokes, and the total iPL can be due to two factors: the temperature-dependent electrons distribution around the Fermi level, and the saturation effect of the e-p interaction.
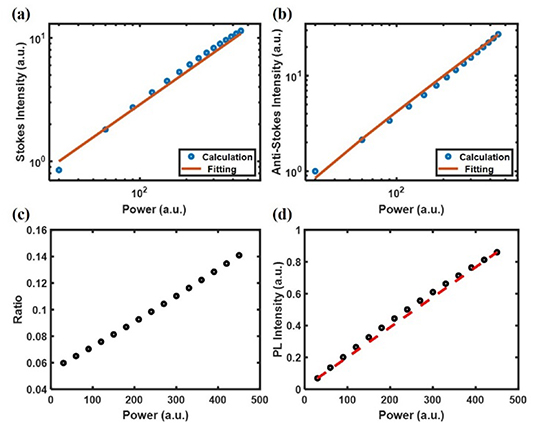
Figure 5. The excitation power-dependent Stokes (a) and anti-Stokes (b) emission intensities. The fitting slopes are 0.88 and 1.2 for the Stokes and the anti-Stokes emissions, respectively. (c) The excitation power-dependent ratio of the anti-Stokes to Stokes components. (d) The excitation power-dependent total iPL intensity (black) and a reference (red) with a slope of 1.0.
Download figure:
Standard image High-resolution image3.5. Time-resolved iPL spectra of gold
By our phenomenological model, the time-resolved iPL spectra of the gold being excited by a pulse laser can be calculated. The thermalization process of the excited electrons is defined as:

And, the solution of non-thermalization electron distribution is:

Similarly, the iPL emission, after being excited by a pulse laser, can be expressed as:
At  , the electrons are excited by a pulse, and the electron distribution is still the same as that in the thermal part. The initial time is set as:
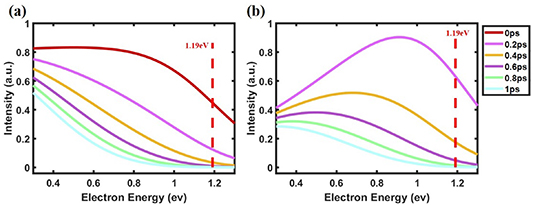
  . The calculated time-resolved electron distribution and the iPL spectra obtained based on our phenomenological model are presented in figure 6. We found that the lifetimes of the 'hot' electrons with different energy are different. The 'hot' electrons with higher energy decay faster. That causes the higher energy band of the iPL to decrease faster and the peak weight of the spectrum to move to lower energy. The 'hot' electrons can deplete in picoseconds and return to the Fermi–Dirac distribution around the Fermi level. The calculated results show an excellent agreement with the experimental results reported by Suemoto et al [20].
Figure 6. Calculated time-resolved non-thermal electrons distribution (a) and the iPL spectra (b) excited by the 1.19 eV photons at the following parameters:  .
.
Download figure:
Standard image High-resolution image
4. Conclusion
This paper proposed a phenomenological model to analyze the iPL features of the gold nanostructures. This model reveals the dynamics of the non-equilibrium electrons at the excited states can influence the iPL characteristic. Here, the e-e and e-p interactions are considered during the thermalization process after being excited by a CW or pulsed laser. By using the proposed model, most of the characteristics of the iPL of gold nanostructures, such as the peak-shift between the iPL and scattering spectra, the anti-Stokes feature of the thermometer, and excitation power-dependent nonlinear behavior, can be explained. Besides, the proposed model is used to calculate the time-resolved iPL of the gold, and the calculated result coincides well with the previously reported experimental results. The results presented in this work help a comprehensive understanding of the iPL of metallic nanostructures. The proposed model provides a relatively simple physical scheme to demonstrate the relationship between the iPL features and the dynamics of the non-equilibrium electrons.
Acknowledgments
The research presented in this work was supported by the National Key Research and Development Program of China (Grant No. 2018YFB2200401) and the National Natural Science Foundation of China (Grant Nos. 91950111, 61521004, and 11527901).
Conflict of interest
The authors declare no competing financial interests.